Karoline Mortensen, PhD, University of Miami Business School, Tianyan Hu, PhD, Merck, Aleeza Vitale, BS, George Washington University, Hanns Kuttner, AB, MA, Hudson Institute
Contact: Karoline Mortensen, kmortensen@bus.miami.edu
This research was supported internally by the Center for Health Management and Policy at the University of Miami Business School; the authors did not receive external funding for this research. Tianyan Hu completed the analyses and worked on the manuscript while she was an assistant professor at Florida International University.
Abstract
What is the message?
As entitlement programs are under pressure to demonstrate value and managed care penetration increases in Medicaid, gaps in knowledge exist about the characteristics of USC practices that serve Medicaid and privately insured patients. This study uses newly available data from the 2015 Medical Expenditure Panel Survey’s Medical Organization Survey, the first nationally representative data that include characteristics on individuals as well as the characteristics of the providers they use. Findings demonstrate that the usual source of care USC providers visited by adult, non-elderly Medicaid enrollees are just as likely as those used by the privately insured to be equipped with an Electronic Health/Medical Record system, provide same-day appointments, send patients reminders, and give physicians reports on clinical quality care, employ case managers, and have X-ray capacity on-site.
What is the evidence?
Analysis of data from a nationally representative survey of USC providers serving individuals who visited their USC in 2016 suggests that the organizational characteristics of providers do not differ significantly between those serving privately insured and Medicaid patients.
Submitted: May 18, 2018. Accepted after review: July 20, 2018.
Cite as: Karoline Mortensen, Tianyan Hu, Aleeza Vitale, Hanns Kuttner. 2018. Characteristics of Providers Serving Medicaid and Private Patients. Health Management Policy and Innovation, Volume 3, Issue 2.
Introduction
There is renewed focus on entitlement programs and the value they provide both taxpayers and their beneficiaries.1 There are concerns that the federal-state Medicaid program may provide inferior care and poor access to care relative to the access and quality enjoyed by the privately insured population. From a management perspective, it is difficult to address issues in Medicaid until there are data to demonstrate where gaps occur.
Medicaid enrollees have historically faced challenges in access to physicians, and these disparities regarding provider acceptance rate are well-documented.2-7 Medicaid patients are concentrated among a relatively small proportion of physicians.8 Median wait time for an outpatient office visit is longer for Medicaid enrollees (4.6 minutes) than for the privately insured (4.1 minutes), and Medicaid enrollees are 20 percent more likely to wait longer than 20 minutes.9 Payment generosity for Medicaid providers plays a significant role,10-13 and Medicaid enrollees face more barriers in securing an appointment with a provider than the privately insured.7,14,15 In-hospital mortality rates are lower for the privately insured than the Medicaid adult population.16 Primary care physicians in the highest tier of quality see more privately insured and fewer Medicaid patients than those in the lowest quality tier.17
However, there may be more parity than was previously thought in access, health services utilization, and delivery of care for the Medicaid population relative to the privately insured. Although overuse of low-value care is perceived to be common among Medicaid enrollees, rates of receipt of both low-value and high-value care are similar across publicly and privately insured patients.18 There is no evidence primary care physicians offer less care to Medicaid enrollees than the privately insured; in fact Medicaid patients received more diagnostic and treatment services than the privately insured.19
Furthermore, as the gap between state Medicaid-to-Medicare fee ratios narrowed, the acceptance of Medicaid patients by many providers was found to increase.6 Primary care appointment availability increased from 58.7 percent to 66.4 percent in 10 states between 2012 and 2014.20 In 2015, 64 percent of nurse practitioners and 59 percent of physicians stated that they had seen an increase in Medicaid patients or in new patients who were previously uninsured.21
Yet we still lack important information. Data limitations have made it difficult to compare the organizational and financial characteristics of the usual source of care providers accessed by Medicaid enrollees and the privately insured. Newly released data allows us to address this gap.
The Agency for Healthcare Research and Quality (AHRQ) has released the first nationally representative data set that links organizational characteristics of usual source of care providers with patients’ experiences.22 The existing literature is descriptive, examining differences in provider characteristics by race and insured/uninsured, but does not examine differences between the Medicaid and privately insured population.23 In this paper, we address this gap by examining the differences in characteristics of usual source of care providers accessed by Medicaid and privately insured respondents to the Medical Expenditure Panel Survey. Specifically, we analyze differences in provider organization characteristics, health information technology, practice case management and use of clinical quality data, and financial arrangements.
Health Information Technology. The prevalence of health information technology in health care is on the rise, partly as a result of incentives under the Affordable Care Act and HITECH Act, in effort to achieve greater care coordination, quality, and adaptability across care settings. In 2015, 87 percent of office-based physicians had adopted any electronic health record (EHR) system,24 up from 78 percent in 2013.25 The capabilities of these systems varied, as out 3 of 4 of these physicians (78 percent) adopted a certified EHR, and over 54 percent a “Basic EHR” system. This represents a significant increase of 66 percent in EHR utilization over the 11-year time frame.24 EHRs were present in practices serving 90 percent of patients who saw their usual source of care provider in 2015, with guidelines/screening reminders provided to 88 percent of patients.23 Furthermore, 78 percent of these EHR systems possessed secure messaging capabilities.23 Adoption of EHRs may be uneven, as large urban practices in Georgia are more likely to “Go Live” than similar rural environments, while Medicaid predominant providers are at a 47 percent higher risk of not achieving “Go Live” status in comparison to their private insurance counterparts.26
Case Management Clinical Quality. EHR capabilities (including clinical decision support, computerized physician order entry, and health information exchange) improve quality, reduce medical errors, and increase adherence to evidence-based clinical guidelines.28 Clinical information systems and patient scheduling systems are associated with adherence to best practices and greater total process quality.29
Financial arrangements. Physician remuneration method is strongly associated with technical quality of care.30 Almost 70 percent of physicians treating Medicaid patients indicate they receive variable compensation, with 67.7 percent of payment determined by productivity rather than quality and patient satisfaction.31 The concentration of Medicaid enrollees within a practice has implications for compensation. If 50 percent or more of a practice’s revenue is derived from Medicaid patients, physicians in that practice are 75 percent more likely to receive variable compensation than those with less than 5 percent Medicaid patients.31 Changes in physician income affect the likelihood that a physician may refuse to accept uninsured or Medicaid patients.32
Methods
Data and Samples The primary data source is the Medical Expenditure Panel Survey (MEPS) Medical Organizations Survey (MOS) data for 2015, fielded in 2016, maintained by the Agency for Healthcare Quality and Research (AHRQ). The data expands current Medical Provider Component of MEPS data by including information on the organizational characteristics of the practices of office-based care providers identified as a usual source of care in the Household Component (HC) and who were seen by the respondent in 2015. We further extract patient demographic and socioeconomic characteristics, as well as health conditions from 2015 MEPS consolidated file using the unique person identifier.
The Medical Organizations Survey is the first Federal survey to directly link practice characteristics with patient experiences.22 (The National Ambulatory Medical Care Survey asks physicians questions similar in nature, but does not link to nationally representative data and has a much shorter data collection window of visits that occur at a site within one randomly selected week.) The data are designed to provide nationally representative estimates of the characteristics of patients’ office-based usual source of care provider in 2015. The data are an internally consistent source of information on individuals’ characteristics, health care utilization and expenditures, and characteristics of the providers they use.33
The Medical Organizations analytic file contains 7,974 sample persons, associated with 4,216 unique responding practices (average of 1.7 sample persons per practice). Our analytic sample is a subset of this file that includes adults age 18-64 with either private insurance or Medicaid coverage for all of 2015, n=2,650.
Outcome Variables The outcome variables that we focus on in this paper are 1) provider organization characteristics; 2) practice implementation of health information technology; 3) practice case management and use of clinical quality data, and 4) financial arrangements. Tables 3 and 4 provide a detailed description of characteristics for each category.
Statistical Analyses We conduct descriptive analyses to examine differences in characteristics of primary care practices utilized by Medicaid and privately insured patients. Medicaid is defined by having received Medicaid insurance coverage for the entire year (fee-for-service or managed care), while private is an indicator for receipt of private health insurance coverage (via employer, exchanges, and other mechanisms) for the entire calendar year. We first compare summary statistics of patients’ characteristics as well as characteristics of providers that treat patients with Medicaid insurance and private insurance.
Patient characteristics include patients’ age categories (from 18 to 24; 25 to 34; 35 to 44; 45 to 54; and 55 to 64 years), sex, race and ethnicity categories (White non-Hispanic, African American non-Hispanic, Hispanic, and other race non-Hispanic), education level (below high school, beyond high school, 4-year college, beyond college), region of residence (Northeast, Midwest, South, and West regions), health status (excellent or very good, good, fair, or poor), whether patient has any chronic conditions, as well as whether patient ever had diabetes, asthma, high blood pressure, arthritis, emphysema, joint pain, heart disease and stroke.
Chi-squared tests assess statistical significance in the bivariate tabulations. We also analyze the association between provider characteristics for Medicaid and privately insured respondents using logistic regression to perform the estimation, controlling for respondents’ demographic and socioeconomic characteristics. In all analyses, we account for complex survey design including primary sampling unit, strata, and sampling weight in estimations. Analyses are conducted with Stata 14.1.
Results
Medicaid patients with a usual source of care provider that responded to the Medical Organizations Survey are more disadvantaged than private patients with a usual source of care on every dimension of disadvantage. There are significant differences in their demographic and socioeconomic characteristics, as well as health status (Table 1). More Medicaid patients are in younger age groups compared to private patients (18-24 group Medicaid vs private: 18.2 percent vs 8.8 percent, p=0.01; 25-34 group: 22.7 percent vs 14.6 percent, p=0.01); on the other end of the age range, fewer Medicaid patients are age 55-64, compared to private patients (18.7 percent vs 31.4 percent, p<0.001). More than 73 percent of Medicaid patients are female, compared to only 56.3 percent of private patients (p<0.001). The racial and ethnic compositions are different; 73.3 percent of private patients are non-Hispanic White, compared to only 43.0 percent of Medicaid patients (p<0.001). Medicaid patients are more likely to be non-Hispanic African American (21.6 percent vs 8.7 percent, p<0.001), or Hispanic (24.9 percent vs 9.5 percent, p<0.001) than the privately insured. Medicaid patients are also more likely to have lower than high school education (68.2 percent vs 30.3 percent, p<0.001), while private patients are more likely to be college educated (4.1 percent vs 23.9 percent, p<0.001), or have post graduate degrees (1.5 percent vs 16.3 percent, p<0.001).
More Medicaid patients perceive their physical health status as fair or poor (37.8 percent vs 10.5 percent, p<0.001) or good (33.8 percent vs 25.8 percent, p=0.02), instead of very good or excellent (28.4 percent vs 63.7 percent, p<0.001). Medicaid patients are also more likely to have any chronic conditions (68.4 percent vs 55.9 percent, p<0.001), specifically diabetes (16.7 percent vs 9.3 percent, p=0.01), asthma (16.8 percent vs 11.0 percent, p=0.04), high blood pressure (41.1 percent vs 32.4 percent, p=0.02), heart disease (4.4 percent vs 2.0 percent, p=0.03), and stroke (6.5 percent vs 2.8 percent, p=0.01). Respondents who saw their usual source of care in 2015 and are therefore in the MOS are older and also more likely to be female, white, and have chronic conditions than the general MEPS respondents (see Online Appendix Table 1 for demographic differences).
Organization Characteristics
Compared to private patients, Medicaid patients are more likely to be seen at nonprofit or government clinics (32.1 percent vs 26.1 percent, p<0.001) instead of independent practices (38.2 percent vs 51.2 percent, p=0.01). There are no statistically significant differences between the number of doctors or primary care providers at the practice seen by Medicaid and private patients. Fewer Medicaid patients see providers with no nurse practitioner or physician assistants (14.8 percent vs 24.7 percent, p=0.01). Medicaid patients are also more likely to visit multi-specialty group practices (48.4 percent vs 39.0 percent, p=0.02) and practices with more than one location (57.1 percent vs 40.9 percent, p<0.001).
Practice Implementation of Health Information Technology
There is no statistically significant difference between the percentage of practices with EHR/EMR system for Medicaid and private patients. Most of the practices seen by both types of patients are equipped with EHR/EMR systems (91.2 percent vs 93.2 percent, p=0.38). Over two thirds of patients with either Medicaid or private patients visit practices with EHR/EMR systems that send electronic reminders (68.5 percent vs 74.4 percent, p=0.11) or use secure electronic messages to communicate with patients (68.7 percent vs 75.3 percent, p=0.076).
Practice Case Management and Use of Clinical Quality Data
The results indicate that there are no statistically significant differences on any of the characteristics concerning case management and use of clinical quality data in the dimensions measured by the MOS between practices for Medicaid patients and those for private patients. Most practices provide same day appointments (91.3 percent vs 95.2 percent, p=0.10), send patients reminders (87.1 percent vs 88.3 percent, p=0.74), and give physicians reports on clinical quality care (76.5 percent vs 77.6 percent, p=0.77). Over half of practices employ case managers to coordinate patient care (55.6 percent vs 50.3 percent, p=0.22). Over a third of them also have an x-ray machine onsite (33.8 percent vs 40.6 percent, p=0.10).
Financial Arrangements
The types of patients also tend to cluster by type of practice. Significantly more Medicaid patients are seen by practices with greater than 50 percent Medicaid patients (47.1 percent vs 10.4 percent, p<0.001). Medicaid patients are also more likely to see practices that have capitated contracts (45.1 percent vs 33.3 percent, p=0.01) and pay physicians a base salary (52.2 percent vs 38.7 percent, p=0.005). By contrast, we do not observe significant differences with practices certified as a patient-centered medical home between Medicaid and private patients. We estimated each of these outcomes with logistic regression to control for demographic and socioeconomic status, with similar results (see Online Appendix Table 2).
Limitations
Our study has several limitations. Data are only available for respondents who saw their usual source of care in 2015, so these results are only representative of Medicaid and privately insured patients who accessed their usual source of care. This is the first year of the MOS, so there are no prior data for comparative analysis. Knowledge of practice capabilities varies depending on the staff respondent at the provider practice site and AHRQ does not impute data in this survey, so some questions generate high “don’t know/refused” responses.
Discussion
Our results show that while health status and demographic characteristics between Medicaid patients and their privately insured counterparts differ, fewer disparities are identified in the organizational characteristics and structural quality of care of providers between the two groups. Although Medicaid patients are more likely to be seen at nonprofit or government facilities, the number of doctors or primary care providers at the practice seen by Medicaid and private patients remains similar. A large and similar share of both Medicaid and privately insured patients usually visit practices that utilize EHR/EMR systems and over two thirds of patients, regardless of status, visit practices that send electronic reminders. Case and clinical quality management, additionally, does not seem to be impacted by Medicaid or private insurance status.
Nonetheless, more Medicaid patients are seen by practices in which Medicaid patients are a significant part of their patient base. This is consistent with the previous literature.8
Our results have important implications for future policy emphasis. While there is seemingly more parity regarding quality of care among Medicaid and private pay patients, health status still varies between the two groups. Despite the differences in health status, few disparities are seen in several measures of structural quality of care and services offered between these two patient groups. While initial concerns regarding the federal-state Medicaid program’s care and access capabilities are warranted, our data suggests that the dimensions of structural quality of care examined in this analysis are similar across the Medicaid and privately insured patient population.
Policy Implications
To our knowledge, this is the first study to use nationally representative data to compare the organizational characteristics of providers treating Medicaid and private pay patients. Perhaps surprising, we find that the characteristics of these practices are quite similar. The inferior access and capability arguments among Medicaid providers could soon become relics of the past.
The United States has been experiencing a significant transformation in the delivery of publicly financed health insurance, with the majority of enrollees (approaching 80 percent) in the Medicaid program in private insurance plans funded by the government.34 Managed care plans achieve savings for Medicaid through the government’s ability to negotiate lower prices with health plans rather than impacting the actual practice of Medicaid providers.35 These structural changes could explain the similarities in practice characteristics.
Future work should further explore the organizational and patient characteristics in the MEPS MOS survey data, as they relate to different health outcomes in the Medicaid and privately insured populations. While the rapid transition of EHR adoption has resulted in equity in practices visited by Medicaid and private patients, whether this parity in adoption leads to improved outcomes is still to be determined.
Table 1: Demographic and Socioeconomic Characteristics by Insurance Coverage
|
Insurance Type |
||||||||
| Variable | Private (%) | Medicaid (%) | P-value | |||||
| Age | ||||||||
| 18-24 | 8.8 | 18.2 | 0.01 | |||||
| 25-34 | 14.6 | 22.7 | 0.01 | |||||
| 35-44 | 19.1 | 18.8 | 0.91 | |||||
| 45-54 | 26.2 | 21.5 | 0.19 | |||||
| 55-64 | 31.4 | 18.7 | 0.01 | |||||
| Sex | ||||||||
| Male | 43.7 | 26.6 | 0.01 | |||||
| Female | 56.3 | 73.4 | 0.01 | |||||
| Race/Ethnicity | ||||||||
| Non-Hispanic white | 73.3 | 43.0 | 0.01 | |||||
| Non-Hispanic black | 8.7 | 21.6 | 0.01 | |||||
| Other | 8.5 | 10.5 | 0.55 | |||||
| Hispanic | 9.5 | 24.9 | 0.01 | |||||
| Education | ||||||||
| DK | 0.1 | 1.0 | ||||||
| 9-12 years | 30.3 | 68.2 | 0.01 | |||||
| Beyond high school | 29.4 | 25.2 | 0.22 | |||||
| 4-year college | 23.9 | 4.1 | 0.01 | |||||
| Master or higher | 16.3 | 1.5 | 0.01 | |||||
| Region | ||||||||
| Northeast | 20.7 | 25.7 | 0.27 | |||||
| Midwest | 23.5 | 19.4 | 0.24 | |||||
| South | 34.2 | 26.2 | 0.07 | |||||
| West | 21.7 | 28.7 | 0.14 | |||||
| Perceived Health Status | ||||||||
| DK | 0.0 | 0.0 | ||||||
| Very good/excellent | 63.7 | 28.4 | 0.01 | |||||
| Good | 25.8 | 33.8 | 0.02 | |||||
| Fair/poor | 10.5 | 37.8 | 0.01 | |||||
| Chronic Condition | ||||||||
| No | 44.1 | 31.6 | 0.01 | |||||
| Yes | 55.9 | 68.4 | 0.01 | |||||
Notes: Author’s analysis of the 2015 Medical Expenditure Panel Survey (MEPS) Medical Organizations Survey (MOS) data. Data are only for respondents to the MEPS who reported visiting their usual source of care in 2015, n=7,952. DK=respondent at provider’s office didn’t know this information.
Table 2: Differences in Organizational Characteristics and Types of Practices by Insurance
| Type of Practice | Private (%) | Medicaid (%) | P Value | |
| DK/REFUSED | 3.7 | 1.7 | ||
| Independent practice | 51.2 | 38.2 | 0.01 | |
| Physician network hospital owned | 26.1 | 19.6 | 0.16 | |
| Nonprofit or government clinic | 10.8 | 32.1 | 0.01 | |
| Practice owned academic medical center | 3.0 | 2.6 | 0.78 | |
| HMO | 1.5 | 0.3 | 0.05 | |
| Corporation owned | 2.9 | 3.7 | 0.54 | |
| Other | 0.9 | 1.9 | 0.35 | |
| Number of Physicians | ||||
| DK/REFUSED | 5.0 | 5.6 | ||
| 0 | 0.6 | 1.3 | 0.53 | |
| 1 | 19.3 | 18.2 | 0.72 | |
| 2-3 | 25.2 | 24.0 | 0.77 | |
| 4-10 | 27.0 | 21.4 | 0.13 | |
| 11-50 | 17.9 | 25.1 | 0.10 | |
| 51-100 | 2.5 | 1.6 | 0.28 | |
| 101-249 | 0.8 | 1.3 | 0.63 | |
| 250 | 1.7 | 1.6 | 0.87 | |
| Number of PCP | ||||
| DK/REFUSED | 6.0 | 7.4 | ||
| 0 | 4.4 | 7.7 | 0.29 | |
| 1 | 19.5 | 20.0 | 0.87 | |
| 2-3 | 25.9 | 22.2 | 0.31 | |
| 4-10 | 27.4 | 21.2 | 0.06 | |
| 11-50 | 15.0 | 20.0 | 0.19 | |
| 51-100 | 1.9 | 1.5 | 0.62 | |
| Number of NP and PA | ||||
| DK/REFUSED | 5.8 | 7.3 | ||
| 0 | 24.7 | 14.8 | 0.01 | |
| 1 | 20.7 | 20.9 | 0.95 | |
| 2-3 | 24.7 | 24.6 | 0.97 | |
| 4-10 | 19.7 | 23.6 | 0.28 | |
| 11-49 | 3.6 | 7.5 | 0.06 | |
| 50 | 0.9 | 1.3 | 0.35 | |
| Is the Practice a Multi-Specialty Group Practice? | ||||
| DK/REFUSED | 0.7 | 2.3 | ||
| Yes | 39.0 | 48.4 | 0.02 | |
| No | 60.2 | 49.3 | ||
| Does the Practice Have More Than One Location? | ||||
| DK/REFUSED | 0.0 | 0.2 | ||
| YES | 40.9 | 57.1 | 0.01 | |
| NO | 59.1 | 42.7 | ||
Notes: Author’s analysis of the MEPS MOS database. HMO is health maintenance organization. PCP is primary care provider. NP is nurse practitioner. PA is physician assistant. DK/REFUSED is respondent for provider practice didn’t know/refused.
Table 3: Electronic Medical Record Usage and Features
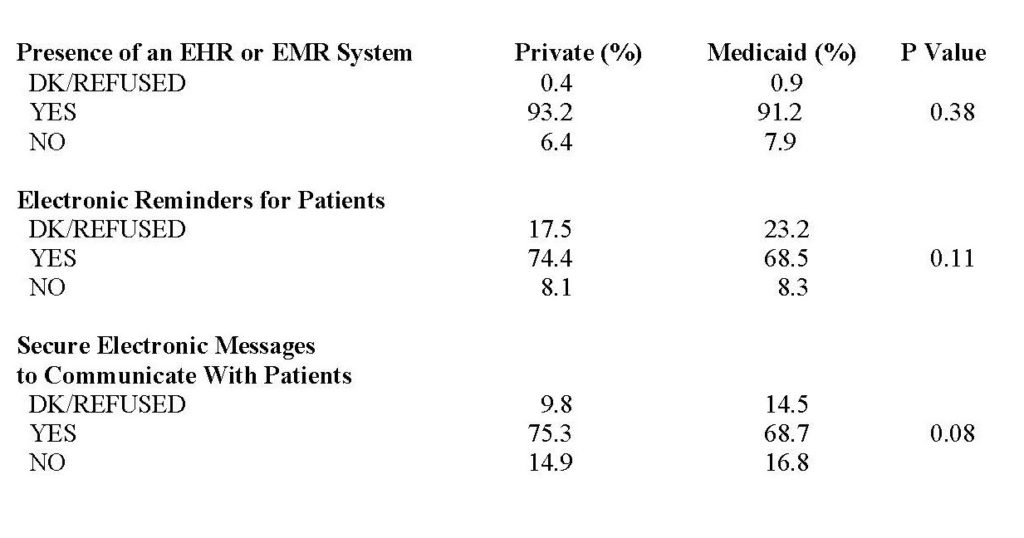
Notes: Author’s analysis of the MEPS MOS database. EHR is electronic health record. EMR is electronic medical record. Utilization is compared across Medicaid and private pay patients.
Table 4: Differences in Practice Case Management & Use of Clinical Quality Data by Insurance Status
| Insurance Status | ||||
| Provide Same Day Appointments? Private (%) | Medicaid (%) | P Value | ||
| DK/REFUSED | 0.7 | 2.7 | ||
| Yes | 95.2 | 91.3 | 0.10 | |
| No | 4.2 | 6.1 | ||
| Send Patients Reminders? | ||||
| DK/REFUSED | 2.0 | 2.4 | ||
| Yes | 88.3 | 87.1 | 0.73 | |
| No | 9.8 | 10.5 | ||
| Have An X-ray Machine On Site? | ||||
| DK/REFUSED | 1.6 | 0.2 | ||
| Yes | 40.6 | 33.8 | 0.10 | |
| No | 57.8 | 65.9 | ||
| Give Reports To Physicians
On Clinical QOC? |
||||
| DK/REFUSED | 13.2 | 14.7 | ||
| Yes | 77.6 | 76.5 | 0.77 | |
| No | 9.3 | 8.8 | ||
| Employ Case Managers To
Coordinate Patient Care? |
||||
| DK/REFUSED | 6.7 | 4.7 | ||
| Yes | 50.3 | 55.6 | 0.22 | |
| No | 43.1 | 39.7 | ||
| Contact The Patient Within 48
Hours of Discharge From Hospital? |
||||
| DK/REFUSED | 7.0 | 9.1 | ||
| Yes | 68.9 | 66.6 | 0.59 | |
| No | 24.2 | 24.3 | ||
Notes: Authors’ analysis of the MEPS MOS database. QOC is quality of care.