Oluwatobi A. Ogbechie-Godec, MD, MBA, Clay P. Wiske, MD, MBA, New York University; Kevin A. Schulman, MD, MBA, Clinical Excellence Research Center and the Department of Medicine, Stanford University
Contact: Kevin Schulman, kevin.schulman@stanford.edu
Abstract
What is the message? The lowest-spending decile in the 2016 Medical Expenditure Panel Survey (MEPS) in the U.S. provided 70.4% of the premium revenue to support healthcare services, while receiving only $0.11 in resources for every $1 invested in health insurance. Failure to provide services that are relevant for those payers will damage the willingness to purchase insurance, damaging the financial viability of the health system.
What is the evidence: Analysis based on the U.S. 2016 Medical Expenditure Panel Survey (MEPS)
Submitted: January 15, 2019; accepted after review: April 15, 2019.
Cite as: Oluwatobi A. Ogbechie-Godec, Clay P. Wiske, Kevin A. Schulman. 2019. Decomposing the Value of Health Insurance. Health Management Policy and Innovation, Volume 4, Issue 1.
Introduction
Health insurance plays a critical role in financing health care services in the United States, serving as the major revenue source for hospitals, physicians, and pharmaceutical firms. Given the importance of this financial model, it is remarkable how little effort has gone into understanding the disparate perspectives of value of insurance to people purchasing this product.
It is generally thought that people with low expected healthcare utilization buy health insurance to meet their immediate needs and to protect against the risk of catastrophic illness. For example, Healthcare.Gov suggests, “No one plans to get sick or hurt, but most people need medical care at some point. Health insurance covers these costs and offers many other important benefits.”1 These types of approaches are supported by public health assessments of the value of insurance to a population.2 Yet, it remains an open question whether these benefits are worth the cost to low-risk individuals in the current healthcare marketplace.
Methods
The 2016 Medical Expenditure Panel Survey (MEPS)3 is a nationally-representative and publicly-available de-identified sample of a civilian non-institutionalized population. MEPS has two components: a household component, which derives from surveys of individuals; and an insurance component, which derives from surveys of private and public sector employers. While a previous MEPS from 1996 included an institutional component, more recent surveys, including the one used here, have not included data on institutional patients. Weighting is done based on demographics to ensure that the MEPS survey accurately represents the general population. Using the 2016 MEPS, we created a model with 10 deciles of mutually-exclusive population segments by weighted health care spend that each had approximately equal total healthcare expenditures of $162 billion. Expenditures, which may be made by patients, private insurers, or other public payers, included payments to hospitals, healthcare professionals, and pharmacies. The 2016 survey received 34,655 responses, which were weighted by MEPS to allow for an extrapolation of the data to the entire United States population.
For each decile, we calculated the average annual per-capita spend [using total expenditures and population size] and calculated premium revenue from each decile. We estimated individual health insurance premiums for the entire population by summing total expenditures across each decile, assuming a medical loss ratio of 85% and premium contribution solely from the insured population. We also examined the demographic characteristics of populations in each decile.
Results
The calculated average annual premium was $6,387 per insured-individual (Figure 1). Consistent with previous estimates, the utilization of resources was highly skewed, with the highest-spending decile, 0.27% of the population, requiring an average per capita expenditure of $183,610. The lowest-spending decile, 70.40% of the population, had an average per capita expenditure of only $711.
Figure 1
2016 Average Annual Expenditure and Premium Revenue by Decile*

*Calculated using the 2016 MEPS survey, a nationally-representative and publicly-available sample of a civilian non-institutionalized population that enables population-level estimates of medical expenditures and insurance coverage. Bars represent the per capita expenditures (left Y axis) and lines represent the total premium revenue (right Y axis).
In terms of financing, the lowest-spending decile provided 70.4% of the resources for this population, and the two lowest-spending deciles provided 81.9% of the resources. Populations in the remaining eight highest-spending deciles had an average per capita expenditure that was more than the calculated premium.
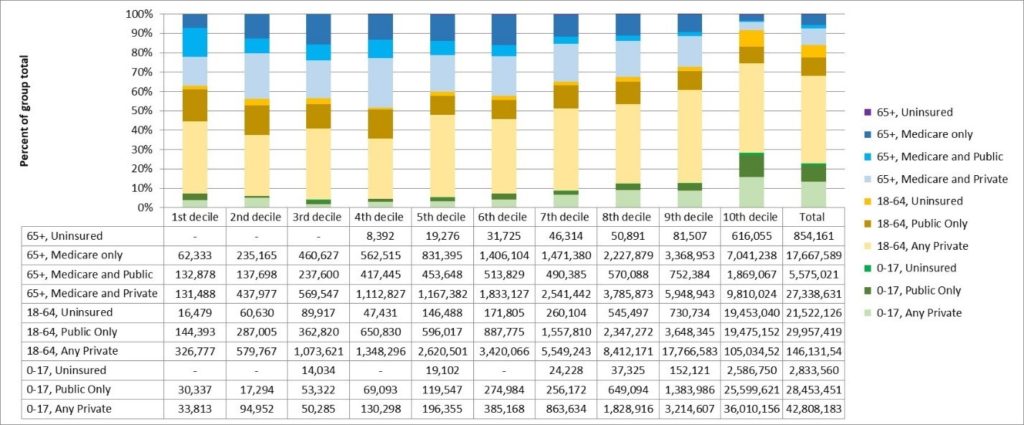
Spending deciles varied by age, people with public insurance, and those without insurance. Elderly individuals and those with public insurance were disproportionally represented amongst the higher-spending deciles. By contrast, children and the uninsured were overrepresented amongst the lowest-spending deciles (Figure 2).
Figure 2
2016 Age and Insurance Status per Decile
Implications
Both the financing and utilization of health care resources are highly skewed, with a small proportion of the population experiencing catastrophic levels of expenditures. At the same time, the lowest-spending populations are the disproportionate financers of the health care system.
The demographics of each decile provides a broader view of the higher and low-spending populations. Prior studies to assess demographics and clinical characteristics of high-spending populations focus on the Medicare population.4,5 While it is true that the elderly have disproportionately higher medical expenditure, 62.8% of the 1st decile were individuals younger than 65 years. Furthermore, over 50% of the 2nd through 8th deciles were non-elderly, which should prompt exploration on their healthcare utilization, especially with higher-cost pharmaceuticals and elective medical procedures.
The results have implications for the sustainability of health insurance programs. Given the relatively low individual risk of catastrophic medical expenditures on an annual basis, low-risk individuals may perceive that health insurance is of limited value. Further, health system strategies that undermine the quality of the services used by low-spending patients — whether through barriers to accessing primary care physicians, shortening visit times, or diminishing the quality of provider interactions — may further exacerbate the challenges of finding value in health insurance for these populations. Indeed, consistent with our concern surrounding the perceptions of the value of health insurance for this population, the lower-spending populations had higher levels of uninsured.
Economists have described the skewed distribution of health expenditures in the United States, where a small segment of the population accounts for the majority of the expenditures.6 From a policy perspective, these results have been used to focus attention on changing the ways that health care services address the highest-spending segments through approaches such as disease management. By contrast, we have long neglected looking at the world from the perspective of the people in the lowest-cost decile.
Yet, the lowest-cost decile has important characteristics that we need to understand in designing health systems. People in this population have average annual medical costs of $711 per person and only receive $0.11 in resources for every $1 invested in health insurance annually. Further, included in their insurance premium is $617 for the costs of services of the uninsured, or almost as much as they will personally receive in health care services.
Consider the example of high and knee surgery. By 2016, there were over 1 million total hip and knee replacements in the U.S., at a cost of over $30,000 per procedure. Given this population size and cost, total joint replacement patients could represent just under 25% of the population in decile 4, which could translate into $147 in premium payments for the lowest-spending individuals.
In the Healthcare.Gov formulation, the balance of premiums above projected expenditures may be seen as representing insurance against catastrophic health care expenses. However, under 0.3% of the population falls into the highest cost decile. This suggests that low-cost individuals have a 1 in 370 chance of experiencing these catastrophic expenditures in any given year. If we include the people who fall into the next highest spending decile, that’s still only 0.84% of the population. In other words, low-cost individuals have less than 1 in 100 chance of having catastrophic expenditures in a given year.
An obvious question for this population is how much should they spend to insure against the remote risk of catastrophic medical events? If we look outside of healthcare, we see many people living in 100-year and 500-year flood zones that lack flood insurance. It is clear that, when given a choice, people are divided on the question of whether to insure against such remote risks. This reluctance may occur because they do not believe that remote events such as floods will be relevant for them or, altneratively, because they expect that public funds will cover the costs when catastrophic weather events do occur. In either case, many do not self-insure.
Seen from this perspective, the quality and availability of services for people in the top deciles of spending may not make health insurance more valuable for low-risk individuals. In fact, it may be just the opposite.
Trends in the past few decads are reinforcing this divide. Approximately 50% of the increase in the cost of health care since 1996 has been due to increases in prices and intensity of services.7 Common business practices such as provider consolidation add to market power for providers and are associated with significant increases in health care prices, with increases in prices of 20% or more after a merger.8 All of these practices add to the cost of care for patients in the top decile of spending, while adding directly to the cost of health insurance premiums that are borne particularly by the lower-cost deciles. Since 1999, health insurance premiums for employer-based insurance have increased 270% for individuals and 224% for employers.9
One implication of this analysis is the question of who is the customer for today’s health care systems. Health care systems seem designed to provide access to profitable tertiary care services, rather than primary and acute care services used by the low-cost population. One major health care system has stated publically that it needs to control the health care services for six million people in order to have a stable financial future. Yet, why would 5,949,600 consumers, the proportion of the population not in the two highest cost deciles, be interested in financing such a system?
The point of view here is important. From a profit perspective, the current approach makes significant sense. From a financing perspective, however, the critical concern is whether low-cost individuals continue to see value in the purchase of health insurance. Without their willingness to purchase health insurance, there would be an inability to finance the costs of the 20% of the population where costs exceed premium contributions.
On a basic level, this funding population is often under-appreciated. How many hospital CEO’s, for instance, have publically thanked their community for buying health insurance during the most recent open-enrollment season?
Limitations and next steps
Our analysis has limitations centered around the use of the MEPS database. This database excludes indirect health care (indirect patient care and research) and special populations (military, institutionalized, and long-term care populations) expenses. There is also concern that the survey may not capture large numbers of the higher-spending populations, so that much of the reliability of the data depends on the MEPS survey weighting methods. Finally, we excluded the uninsured population to calculate average premiums, although some insured patients may contribute financially through out-of-pocket spending or taxes.
Despite the limitations, this analysis helps to explain political debates about some of the resistance to health insurance. Health care leaders, physicians, and policy makers should acknowledge this increasing divergence of value from the perspective of the individuals financing the system. Even more importantly, they should work to ensure that the system provides value to this critical segment of the population. This responsibility may conflict with current evaluation of health care systems leaders where few performance metrics relate to the value provided to the low-cost insured patients that are critical to the financial viability of the health care system.
References
- Healthcare.Gov. Health insurance: How it protects you from health and financial risks. 2018; https://www.healthcare.gov/why-coverage-is-important/coverage-protects-you/. Accessed December 19, 2017.
- Sommers BD, Gawande AA, Baicker K. Health Insurance Coverage and Health. The New England journal of medicine. Nov 16 2017;377(20):2000-2001.
- Cohen JW, Cohen SB, Banthin JS. The medical expenditure panel survey: a national information resource to support healthcare cost research and inform policy and practice. Medical care. Jul 2009;47(7 Suppl 1):S44-50.
- Clough JD, Riley GF, Cohen M, et al. Patterns of care for clinically distinct segments of high cost Medicare beneficiaries. Healthcare. Sep 2016;4(3):160-165.
- Joynt KE, Figueroa JF, Beaulieu N, Wild RC, Orav EJ, Jha AK. Segmenting high-cost Medicare patients into potentially actionable cohorts. Healthcare. Mar 2017;5(1-2):62-67.
- Cohen SB. The Concentration and Persistence in the Level of Health Expenditures over Time: Estimates for the U.S. Population, 2012-2013. Statistical Brief (Medical Expenditure Panel Survey (US)). Rockville (MD)2001.
- Dieleman JL, Squires E, Bui AL, et al. Factors Associated With Increases in US Health Care Spending, 1996-2013. JAMA : the journal of the American Medical Association. Nov 7 2017;318(17):1668-1678.
- Robinson JC, Miller K. Total expenditures per patient in hospital-owned and physician-owned physician organizations in California. JAMA : the journal of the American Medical Association. Oct 22-29 2014;312(16):1663-1669.
- Claxton G, Rae M, Long M, Damico A. Employer Health Benefits: 2017 Annual Survey United States 2017.