Xiaole Liu, Columbia University, and Kevin Schulman and David Scheinker, Stanford University
Abstract
Contact: David Scheinker, PhD, dscheink@stanford.edu
Cite as: Xiaole Liu, Kevin Schulman, David Scheinker. 2019. Private and Public Incentives for Hospitals to Improve the Quality and Reduce the Cost of Care. Health Management Policy and Innovation, Volume 4, Issue 3.
The U.S. Needs a Hospital Quality-Cost Comparison Tool
Improving the quality of care while reducing spending is one of the few healthcare goals that enjoys near universal bipartisan political support. Hospitals account for over one third of all U.S. healthcare spending. [1] Yet a large percentage, over 50 percent by some estimates, of hospital spending growth results from price increases unrelated to the quality of the care provided and from wasted spending. [2, 3] The challenge, then, is to provide proper incentives for hospitals to improve quality and reduce costs. [4–10]
There are successful, though imperfect, examples of how such incentives may be driven by public and private sources of data. Hospital ratings programs such as the Center for Medicare and Medicaid Services Stars Rating System (public) and US News & World (private) are available. Hospital costs, though not prices, are available from sources including the CMS Cost Report (public) and the American Hospital Association Survey (private). This essay argues that a more reliable, comprehensive, and interactive hospital quality, cost, and price comparison tool should be developed and used to incentivize simultaneous improvement in all three areas.
We propose that, unlike current incentive schemes that focus primarily on quality or cost, hospitals should have competitive incentives to invest in structural operational improvements and contractual negotiations that also reduce price. We review empirical literature to argue that such incentives may be effective, but only if designed to account for differences in populations and prevent gaming. We document the availability of relevant data, identify data that must be made available, and demonstrate the feasibility of this approach with a proof-of-concept version of a quality-cost measurement tool. We use our tool to produce a simple, interpretable metric to incentivize competitive improvement. We conclude by proposing a public and a private incentive that a more mature version of such a tool would facilitate.
Evidence: Incentives Can Control Quality, Cost, and Price
Empirical studies suggest that hospitals can control quality, cost, and price when faced with the proper incentives. Laurence Baker provides evidence that vertical integration of hospitals and physician practices increases providers’ market power and results in higher hospital prices and spending. [4] James Robinson finds that based on market concentration, hospitals shift costs to private insurers facing Medicare shortfalls, while in competitive markets hospitals focus on cutting costs. [5] Chapin White shows that some high-price hospitals enjoy significant financial margins and high rankings while scoring low on some measures of quality, but that these are largely based on reputation as they belong to systems with large market shares. [6]
These and similar analyses, though sometimes controversial, accord with the widely accepted economic theory that firms facing limited competition will set prices to maximize profits. They also match empirical evidence that U.S. healthcare services, including those provided in hospitals, are priced significantly higher than those of other rich nations. [7,8] The analyses also accord with well-accepted economic theory and empirical observation that firms with pricing power have weaker incentives to control costs and are less effective at controlling costs.
If incentives are to be used to drive down costs and prices while improving quality, they must be designed to account for heterogeneous populations and potential gaming. Work by Ashish Jha and colleagues shows that the socioeconomic status of the patient population is strongly associated with hospital quality and must be considered when designing incentives. [9] They categorize hospitals into groups such as the “best” (high-quality, low-cost institutions) and the “worst” (low-quality and high-cost) and show that they serve markedly different populations, with the former serving significantly lower percentages of elderly black, Hispanic, and Medicaid patients.
Hamsa Bastani shows that hospitals are less likely to game incentives when performance is closely monitored. [10] They provide quantitative evidence that over 10,000 out of nearly 60,000 annually reimbursed claims for present-on-admission infections (18.5%) were misreported hospital-acquired infections resulting in an added cost burden of $200 million to Medicare and that the prevalence of misreporting is closely associated with the quality of monitoring. They develop a framework to create a more effective pay-for-performance mechanism.
Creating a Quality-Cost Comparison Tool
Sources of data
Meaningful comparison of the efficiency—including quality, cost, and price—of U.S. hospitals must account for the significant differences in the services provided and the populations served. A variety of the data necessary for comparing quality are publicly available although data about prices are lacking.
We produced a proof-of-concept tool using five publicly available sources of data that provide a relevant baseline for cost-quality measurement. Current sources include (1) The 2014–2017 Hospital Compare data, which is created by the Centers for Medicare & Medicaid Services and contains Hospital Compare Overall Hospital Quality Star Rating data; [11] (2) the CMS Hospital Cost Report, which contains total cost variable of hospitals for fiscal year 2014 to 2017; [12] (3) the CMS Casemix File Hospital Inpatient Prospective Payment System, which contains hospitals case mix indexes representing the average diagnosis-related group relative weight for that hospital and number of cases for 2014–2017; [13] (4) the CMS Market Basket data, which is also known as hospital input price index, reflecting input price inflation facing providers in the provision of medical services ;[14] and (5) U.S. News 2018–2019 Best Hospitals Honor Roll, which listed 20 hospitals. [15]
More precise estimates of quality and cost could be developed using detailed state-specific data sources such as OSHPD, which produces datasets and data products in topics including Cost Transparency and Healthcare Quality, [16] as well as several proprietary national data sources such as the MarketScan Databases, which track millions of patients throughout the healthcare system; [17] the American Hospital Association Annual Survey, which contains data on hospital characteristics such as operations and expenses; [18] and the Agency for Healthcare Research and Quality, which contains encounter-level information on inpatient stays, emergency department visits, and ambulatory surgery in U.S. hospitals. [19] If enacted, a recently proposed rule from the Department of Health and Human Services would make available the prices hospitals charge private insurers. [20]
Proof-of-concept: An interactive quality-cost comparison tool
We produced an interactive tool for comparing hospital efficiency based on costs adjusted for case mix, hospital input price index, and inflation and quality as measured by the CMS star-rating system. If price data were available, these would be an important additional value to incorporate into the tool or to replace cost; institutions remain viable only if their costs are lower than their prices. Figure 1 shows, at the hospital level, the time trend from 2014 to 2017 of the relationship between cost and quality for those hospitals that improved their rating while increasing costs and those hospitals that maintained the highest possible star rating while decreasing costs.
Figure 1.
Top: Hospitals that improved their CMS star rating while increasing costs.
Bottom: Hospitals that had a star rating of 5 for all years and decreased costs.

This tool provides a baseline of quality-cost measurement. The tool allows for real-time, interactive comparison of quality ratings and hospital costs as well as changes over time in quality and cost. The tool allows for relevant peer-to-peer comparison by allowing the user to filter, in real time, for hospitals in a given region, of a certain size, and from a specific list. Selecting or zooming in on the points or lines corresponding to a specific hospital or searching for a hospital by name reveals more detailed information. For instance, in Figure 1, the highlighted hospital, Summit Medical Center in California, saw an increase from 2014 to 2017 in its case mix adjusted costs per day with an increase in its CMS quality star rating.
The appendix depicts examples of the potential of the tool to identify highly performing hospitals include hospitals that: (1) made the U.S. News 2018–2019 Best Hospitals Honor Roll and (2) improved their star rating while decreasing costs. These visual and underlying algorithmic analyses reveal quality-cost relationships and allow for meaningful comparisons. For example, The Mayo Clinic in Rochester, Minnesota is consistently ranked as one of the top-performing hospitals in the country and was identified by the interactive tool as having maintained a 5-star rating for all years while decreasing costs.
An interpretable quality-cost metric
Comparing hospital efficiency using quality, cost, and price may allow for a single, hospital-specific metric that approximates the potential for a given hospital to improve and can be used to identify specific opportunities for improvement. We propose categorizing a hospital as highly efficient (HE) if, when compared to an appropriate peer group, its quality and cost performance is Pareto optimal, meaning that no other hospital has both better quality and lower costs. We propose using the tool to define, for each appropriate peer group, the HE hospitals whose performance constitutes the Pareto-optimal frontier. For each non-HE hospital, the opportunity to improve is defined as the average of the cost and quality differences to the three closest HE hospitals. This metric quantifies the magnitude of improvement a hospital should strive for. The practices of the HE hospitals identified in the comparison provide a guide for potential improvement efforts.
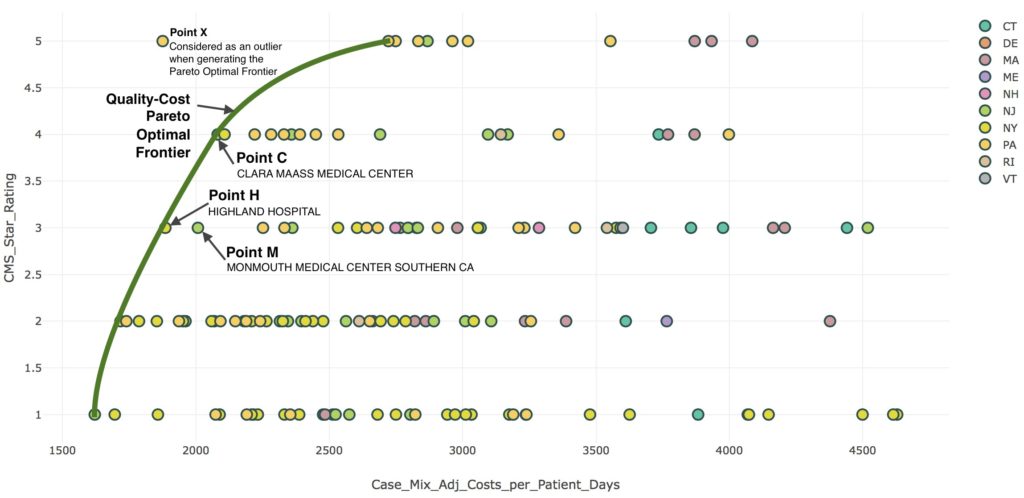
Figure 2 depicts this metric for hospitals in the Northeast with 200 to 500 beds. The Pareto-optimal cost-quality frontier is shown with a green line. This frontier excludes an exceptionally efficient, high-quality hospital X, which the figure reports as an outlier. Hospitals H (Highland Hospital) and C (Clara Maass Medical Center) are on the Pareto-optimal quality-cost frontier since no hospital has both higher quality rating and lower costs. Hospital M (Monmouth Medical Center) is not on the frontier since it has higher costs or lower quality rating than each of these. Correspondingly, Hospital M should face incentives to invest in operational changes that allow it to reduce costs and improve quality, while containing costs, to move toward an operational profile similar to that of hospitals H or C.
Figure 2 Quality-cost Pareto optimal frontier for hospitals in the Northeast with 200-500 beds
Incorporating prices into the metric
The current tool incorporates only costs since hospital-specific private insurance price data generally are not publicly available. If price data become available, as has recently been proposed by the Department of Health and Human Services, the tool would have the options for using cost or price for the x-axis. [20] If private and public insurers, patient advocacy groups, and employers have direct access to price data, they could more effectively incentivize hospitals to pass cost savings on in the form of lower prices.
Looking Forward: Public and Private Incentive Schemes
Given a metric to guide hospitals on how to improve efficiency, there are numerous potential public and private schemes to incentivize hospitals to do so. Public and private payers already make efforts to incentivize efficiency improvements. The CMS Merit-based Incentive Payment System and Advanced Alternative Payment Models tie hospital payments to quality and cost metrics. Health insurance companies negotiate with hospitals to reduce unnecessary care and guide patients toward lower-cost providers. Both types of efforts could benefit from an analytical approach more focused on systemic efficiency improvements.
This proposal has bipartisan appeal. There is political consensus on the need to reduce healthcare spending without compromising quality. Academic and professional literature identify the most viable approaches as targeting improvements in prices, waste, and efficiency. A number of Democratic proposals favor increasing competition through the use of a public option or pricing schemes that will exert downward pressure on hospital prices and insurance premiums. [20,21] A number of Republican proposals favor the same goal through price-transparency. [22] There is even bipartisan legislation around regulating pricing practices. [23,24]
Outside of healthcare, firms differentiate goods and services such as cars and flights based on price and quality. In competitive markets, firms offering non-Pareto-optimal goods and services such as lower-quality, more expensive cars are either driven to improve or forced out of the market. Creating incentives for hospitals to compete on quality, cost, and price would produce dynamics comparable to those that emerge naturally in competitive markets. Such a market-inspired approach should find support across the political spectrum.
References
[1] CMS.gov, National Health Expenditures 2017 Highlights. Centers for Medicare & Medicaid Services, available at:https://www.cms.gov/Research-Statistics-Data-and-Systems/Statistics-Trends-and-Reports/NationalHealthExpendData/Downloads/highlights.pdf. Accessed on 10/13/2019.
[2] Dieleman JL, et al. Factors associated with increases in U.S. health care spending, 1996–2013. Journal of the American Medical Association 2017;318(17):1668-1678.
[3] Shrank WH, Rogstad TL, Parekh N. Waste in the U.S. health care system: Estimated costs and potential for savings. Journal of the American Medical Association 2014;315(16):1750-1766.
[4] Baker LC, Bundorf MK, Kessler DP. Vertical integration: Hospital ownership of physician practices is associated with higher prices and spending. Health Affairs 2014;33(5):756-763.
[5] Robinson, J., 2011. Hospitals respond to Medicare payment shortfalls by both shifting costs and cutting them, based on market concentration. Health Affairs 2011;30(7):1265-1271.
[6] White C, Reschovsky JD, Bond, AM. Understanding differences between high- and low-price hospitals: Implications for efforts to rein in costs. Health Affairs 2014;33(2):324-331.
[7] Anderson GF, Reinhardt UE, Hussey PS, Petrosyan V. It’s the prices, stupid: Why the United States is so different from other countries. Health Affairs 2003;22(3):89-105.
[8] Anderson GF, Hussey P, Petrosyan V. It’s still the prices, stupid: Why the U.S. spends so much on health care, and a tribute to Uwe Reinhardt. Health Affairs 2019;38(1):87-95.
[9] Jha AK, Orav EJ, Epstein AM. Low-quality, high-cost hospitals, mainly in south, care for sharply higher shares of elderly black, Hispanic, and Medicaid patients. Health Affairs 2011;30(10):1904-1911.
[10] Bastani H, Goh J, Bayati M. Evidence of upcoding in pay-for-performance programs. Management Science 2018;65(3):955-1453.
[11] Medicare.gov. Hospital Compare Website. Hospital Compare Datasets, the Centers for Medicare & Medicaid Services 2019. Available at: https://data.medicare.gov/data/hospital-compare.
[12] The National Bureau of Economic Research. Healthcare Cost Report Information System (HCRIS) data. The Centers for Medicare & Medicaid Services 2019. Available at: https://www.nber.org/data/hcris.html.
[13] The National Bureau of Economic Research. CMS casemix file hospital Inpatient Prospective Payment System (IPPS),” the Centers for Medicare & Medicaid Services 2017. Available at: https://www.nber.org/data/cms-casemix-file-hospital-inpatient-prospective-payment-system-ipps.html.
[14] CMS.gov. Market basket data. Centers for Medicare & Medicaid Services 2019. Available at: https://www.cms.gov/Research-Statistics-Data-and-Systems/Statistics-Trends-and-Reports/MedicareProgramRatesStats/MarketBasketData.html.
[15] U.S. News & World Report. U.S. News 2018–19 Best Hospitals Honor Roll. U.S. News & World Report August 14, 2018. Available at: https://www.usnews.com/info/blogs/press-room/articles/2018-08-14/us-news-announces-2018-19-best-hospitals.
[16] California’s Office of Statewide Health Planning and Development (OSHPD), 2019. Available at: https://oshpd.ca.gov/data-and-reports/.
[17] IBM MarketScan Research Databases. Available at: https://www.ibm.com/us-en/marketplace/marketscan-research-databases. Accessed on 09/23/2019.
[18] AHA Annual Survey Database™, 2019, American Hospital Association. Available at: https://www.ahadata.com/aha-annual-survey-database-asdb/.
[19] Healthcare Cost and Utilization Project, 2018, HCUP Databases. Agency for Healthcare Research and Quality 2018. Available at: https://www.hcup-us.ahrq.gov/databases.jsp. Accessed on 09/23/2019.
[20] Uhrmacher K, Schaul K, Firozi P, Stein J. Where 2020 Democrats stand on Medicare-for-all. The Washington Post 2019 December 2. Available at: https://www.washingtonpost.com/graphics/politics/policy-2020/medicare-for-all/.
[21] Nisen M, He E. The Democrats are fighting for your health in 2020. Bloomberg 2019 October 14. Available at: https://www.bloomberg.com/graphics/2019-opinion-democratic-presidential-medicare-debate/.
[22] 21st Century Cures Act: Interoperability, information blocking, and the ONC health IT certification program. A proposed rule by the Health and Human Services Department 2019 April 3. Available at https://www.federalregister.gov/documents/2019/03/04/2019-02224/21st-century-cures-act-interoperability-information-blocking-and-the-onc-health-it-certification. Accessed on 09/23/2019.
[23] Huetteman E. Legislation to end surprise medical bills has high public support—in both parties. Kaiser Health News 2019 September 12. Available at: https://khn.org/news/legislation-to-end-surprise-medical-bills-has-high-public-support-in-both-parties/.
[24] KHN Morning Briefing. Long-awaited drug pricing bill from Senate Finance Committee would cap Medicare ‘Part D’ copays for first time. Kaiser Health News 2019 July 24. Available at: https://khn.org/morning-breakout/long-awaited-drug-pricing-bill-from-senate-finance-committee-would-cap-medicare-part-d-copays-for-first-time/.
Appendix
Figure A1. Hospitals that were U.S. News 2018-19 Best Hospitals Honor Roll

Figure A2. Hospitals that improved their CMS star rating while reducing costs