Stacy Wood, North Carolina State University; Richard C. Mather, Carolyn Hutyra, Duke University School of Medicine; and Kevin A. Schulman, Stanford University
Abstract
What is the message? As we move from clinical medicine to digital medicine, we are moving from a one to one provider-patient relationship to a one to many provider-patient relationship. The key communication skill set in the former approach is considered “bedside manner,” but such an approach will not carry over to the digital environment. We suggest that a one to many relationship is best understood through the perspective of the field of marketing. In this paper, we highlight the potential development and application of a marketing approach to patient segmentation in making patient recommendations for population health.
What is the evidence? Collection and analysis of novel patient survey data from an orthopedics clinic. Using marketing theory, we develop a new segmentation technique to construct phenotypes of patient non-adherence that can be used to promote effective adherence interventions.
Links: Appendix 1
Timeline: Submitted: January 19, 2022; accepted after review: January 20, 2022.
Cite as: Stacy Wood, Richard C. Mather, Carolyn Hutyra, Kevin A. Schulman. 2022. Effective Patient-Centric Engagement in Population Health: Using Marketing Segmentation Methods to Address Patient Non-Adherence, Health Management, Policy and Innovation (www.HMPI.org), Volume 7, Issue 1.
Introduction
Population health has emerged as a focus of modern health care delivery systems1; one critical aim of this framework is to identify and stratify patients in need of clinical intervention or supportive care. To date, improved patient engagement has become the means of increasing the effectiveness of this approach and most efforts focus on enhancing interaction with the clinical team.
An alternative—and potentially more successful—approach is to identify the bases of health behaviors of individual patients within the population, and to influence those behaviors with tailored messages or programs. Such an approach would require us to reconceptualize the health care of populations as a challenge requiring deeper insights into individual patient expectations, perceptions, and choices. Scaling individual insights to large-scale targeting of populations is foundational to many service industries, and builds from the field of consumer psychology in marketing.
While medical practitioners may balk at the term “marketing,” the contrast between a marketing approach and a health services research approach to population health care can be instructive. Extant research suggests that consumer psychology insights could improve both our prediction of population health patterns and success in crafting interventions to help patients achieve improved health. Recent calls for this kind of “psychology of choice” approach indicate a growing interest among practitioners and policy-makers2 and medical leaders already see promise for the use of behavioral phenotypes specifically in adherence interventions3—what would this approach look like in practice? Here, we offer a case study.
Marketing, as an academic field, is based on understanding populations through their behaviors and choices. However, characterizing each individual in a population on these domains is a daunting task. Fortunately, one central insight of marketing is that it is possible to group populations, not by demographic variables alone, but based on similarities in terms of individuals’ behaviors, attitudes, and beliefs. This approach is called market segmentation: the identification of sub-groups of the population (or “segments”) that have similar behavioral personae4. It leads to the development of actionable insights and is a powerful tool in accomplishing three objectives: a) imputing the specific motivations of any given individual, b) predicting patterns of behavior, and c) developing the means to influence suboptimal behaviors with segment-specific strategies and persuasive messages. This process of segmentation has become more refined with the increasing availability of different types of consumer data (that go beyond simple demographic information) and powerful analytic models.
Segmentation focused on changing behavior requires an understanding of how to influence people to take an action—for example, to choose to exercise, eat differently, or purchase goods and services. To date, this type of approach has been largely absent from discussions of population health. We set out to understand if an approach to market segmentation could provide unique insights in an effort to encourage a common health behavior-exercise, among a group of patients with a diagnosis of arthritis.
Methods
The methods here follow standard practices in marketing for conducting a segmentation analysis as adapted to a medical population where adherence to a physician recommendation is the key behavior of interest.
The eight stages of this process are indicated in Figure 1.
Figure 1. Using Segmentation to Address Patient Non-adherence: Analytical Process
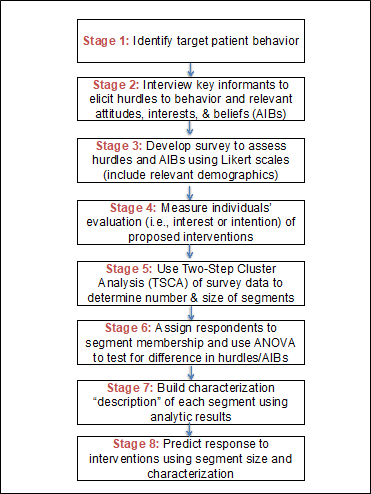
Target Patient Behavior
To understand phenotypes of behavior for osteoarthritis knee patients in adhering to a clinician’s recommendation to exercise, we sought to understand the relevant drivers of nonadherence and the potential interest in four different types of predetermined intervention (described below). In determining the relevant attitudes impacting this behavior, we considered whether it is more helpful to investigate why people engage in this behavior (motivations) or why they don’t (barriers/hurdles). Since consumers are loss averse, marketers often find an analysis of hurdles to be more actionable in designing interventions to encourage a behavior.
Item Development
Qualitative interviews were conducted among osteoarthritis physicians and advanced practice providers (APPs) that included orthopedic surgeons, sports medicine and primary care physicians, physician assistants, and a health center administrator. These interviews helped generate an exhaustive list of salient pain points or barriers faced by patients with knee osteoarthritis, as well as explanations and beliefs espoused by patients. Interviews were conducted with both individuals and groups for an approximate duration of one hour. Further input was obtained from an extensive review of the literature, and a review of public patient forums, including online chat rooms and social media posts.
Survey Development
A survey was created in Qualtrics and emailed to patients with knee OA. Survey questions included 32 possible exercise hurdles as well as relevant attitudes, interests, and beliefs (AIB). Hurdles were measured using a five-point scale: where 1 = “Does not describe my feelings”; 2 = “Slightly describes my feelings”; 3 = “Moderately describes my feelings”; 4 = “Mostly describes my feelings”; and 5 = “Clearly describes my feelings.” We also included limited demographic items.
Respondents were also asked to assess their personal evaluation of four potential interventions to improve exercise: an insurance rebate, a social support group, an educational app, and a “gamified” reward program, with responses collected on a three point scale (1 = “Honestly, this would not help me exercise more,” 2 = “This might help me a little to exercise more,” and 3 = “This would greatly help me to exercise more.”). Here, we measured individuals’ evaluations of interventions within the same survey as hurdles. This does not need to be the case if other evaluative data for individuals already exists.
The full survey is included as Appendix 1.
Study Population
Individuals (ages 18-80) who received care at a large academic medical center with a clinical diagnosis of knee osteoarthritis and an email address on file, and who received an exercise recommendation from their clinician, were eligible for participation.
Survey Release
Email addresses were collected through an internal osteoarthritis database at a large, academic medical center. Participants received a securely delivered email from their orthopedic provider. The email contained a link to the Qualtrics consent form and survey. Subjects did not receive compensation for participation. No Protected Health Information (PHI) was collected.
Statistical Analysis
SPSS version 24 was used to analyze the data, including behavioral, attitudinal, and demographic characteristics. Two-Step Cluster Analysis (TSCA) was used to identify segments by selected variables. TCSA allows for analysis of a combination of categorical and continuous variables. Additionally, it can yield clusters of differing sizes which is valid here because it is probable that groups based on attitudes toward exercise adherence are not of uniform size. The Bayesian Information Criterion (BIC) was applied to determine the number of discrete clusters when the model was unconstrained.
Analysis-of-variance tests identified characteristics that differ significantly between groups to understand the behavioral phenotype or “personality” of the segment. Finally, we assessed key demographics (e.g., age, gender) by segment membership.
This study underwent review and approval by the Duke Medicine Institutional Review Board for Clinical Investigations (Pro00082003).
Results
5,159 emails were released to the osteoarthritis knee cohort. Of the emails released, 4,887 were delivered successfully. Emails to 272 participants had permanent fatal errors and could not be delivered. 657 participants responded to the survey for a 13.4% response rate. Of the 657 responses, 431 individuals indicated they had received an exercise recommendation from their provider following a knee osteoarthritis diagnosis and the segmentation analysis was conducted on these individuals.
Descriptive analyses (Table 1) indicate that the research population is more female and more highly educated than the population at large.
Table 1. Survey Population Demographic Descriptions
| Overall Population* | Segment 1 | Segment 2 | Segment 3 | Segment 4 | |
| n | 431 | 100 | 95 | 118 | 60 |
| Gender (% Female) | 67.8% | 77.0% | 63.1% | 72.0% | 54.2% |
| Mean age | 65 | 58 | 70 | 62 | 65 |
| Education (% Obtaining) | |||||
| 1. High school degree | 22.0% | 23.0% | 22.3% | 19.4% | 21.6% |
| 2. College, Undergraduate degree | 38.7% | 37.0% | 41.4% | 38.1% | 38.3% |
| 3. College, Graduate degree | 38.5% | 39.0% | 36.1% | 40.6% | 40.0% |
| Use social media (% Yes) | 74.3% | 82.0% | 76.8% | 74.5% | 56.6% |
*Total survey respondents = 657; segmentation conducted on those who specified that exercise had been prescribed to them, n = 431. Segment sizes can be based on fewer than n = 431 depending on patterns of nonresponse within the survey.
Age of this population ranged between 55 and 75, with a mean age of 64.8. Roughly 75% use social media and 19% have had a knee replacement surgery. Exercise was recommended by a doctor (personal physician or orthopedic surgeon) most of the time, however, patients report that five minutes or less was devoted to talking about this recommendation in a majority (62%) of cases.
Segmentation
Segmentation was conducted by analyzing respondents’ evaluations of interventions to increase exercise. Two-Step cluster analysis was used to determine if there are multiple significant segments based on evaluations of the four interventions. When the model is unconstrained, four segments emerge. The cluster analysis demonstrates fair cohesion/separation (Silhouette measure =.4) and the ratio of sizes (1.97) is also good.
Segment 3 is the largest at 31.6% of the population and indicates a clear preference for the social support group. Segment 1 is the next largest at 26.8% of the population; this segment indicates interest in any of the interventions. Segment 2 is similarly sized at 25.5% of the population and prefers the insurance rebate. Segment 4 is the smallest at 16.1% of the population; this segment likes none of the interventions (see Figure 2).
Importantly, exercise hurdles differed across the population. Only six hurdles have a mean above 2 indicating “slightly describes my feelings.” However, in analyzing the data, attention to the overall mean is misleading if the distribution of responses varies across clusters. For example, concern for hurting one’s joint has a relatively low mean (mean = 2.09), however, considering the distribution of responses, we can see this is a function of both the ~68% of respondents who report this hurdle does not keep them from exercising (responded 1 or 2) and the ~20% of respondents who report that it does (responded 4 or 5). The insight of segmentation is to consider these two groups differently—being afraid of hurting one’s joint is not a problem for many but a sizeable problem for others.
TSCA analysis created a segment membership variable in the database for each individual respondent. ANOVA with Bonferroni correction then was used to determine if other variables differed by segment. We found significant differences for four AIB measures and eight exercise hurdles (Table 2) which are used to develop the segment personality.
Table 2. Differences in survey response by segment type. AIB measures used a 7-point Likert scale. Perceived hurdle measures used a 5-point Likert scale.
| Segment 1 | Segment 2 | Segment 3 | Segment 4 | ||
| Descriptor | Amiable Inept | Tire Tread Theorist | Feeling Old | Able Alone | |
| Population % | 26.8% | 25.5% | 31.6% | 16.1% | |
| Mean age | 58 | 70 | 62 | 65 | |
| Differences in AIB measures | Sig: F(p) | ||||
| 1. I’ve had health problems my whole life | 2.85 | 2.51 | 2.64 | 1.92 | 3.45 (.017) |
| 2. I’ve been an athletic person in my life | 4.39 | 5.13 | 4.84 | 5.63 | 4.87 (.002) |
| 3. I’ve always been the kind of person who loves to exercise | 3.84 | 4.36 | 4.06 | 4.90 | 3.84 (.010) |
| 4. Joints are like tire treads – they only have so much “life” in them. | 4.22 | 4.45 | 3.86 | 4.03 | 2.03 (.108) |
| Differences in perceived hurdles (“One thing that really keeps me from doing the exercise is that…”) | |||||
| 1. I don’t feel like I’m seeing the results as fast as I should. | 2.18 | 1.93 | 2.19 | 1.71 | 2.79 (.040) |
| 2. I start strong but get discouraged. | 2.26 | 2.00 | 2.24 | 1.51 | 6.32 (.000) |
| 3. I don’t enjoy the exercise. | 2.10 | 1.73 | 2.21 | 1.69 | 4.02 (.008) |
| 4. It reminds me that my body has aged. | 1.78 | 1.84 | 1.91 | 1.29 | 4.10 (.007) |
| 5. I don’t like exercising alone. | 1.83 | 1.46 | 1.78 | 1.27 | 5.13 (.002) |
| 6. I don’t know if I’m doing it right. | 1.82 | 1.46 | 1.60 | 1.28 | 5.05 (.002) |
| 7. I don’t have anybody to show me. | 1.59 | 1.22 | 1.44 | 1.12 | 5.03 (.002) |
| 8. I’m not the athletic type. | 1.66 | 1.38 | 1.70 | 1.37 | 2.53 (.056) |
Segment “Personality” Development
Examining the four segments, we see that two segments (#1 and #3) do not perceive themselves as athletic, whereas the other segments (#2 and #4) do. Thus, the first divide in this population appears to be an indentity-orientation attitude as either non-athlete or athlete.
Figure 2. Interpretation of four segments with personae descriptors. Note that, for each segment, the figure highlights the key hurdles to exercise adherence, ways the clinician can identify likely patient membership in a segment, and the persuasive levers for the most appealing intervention for each segment.
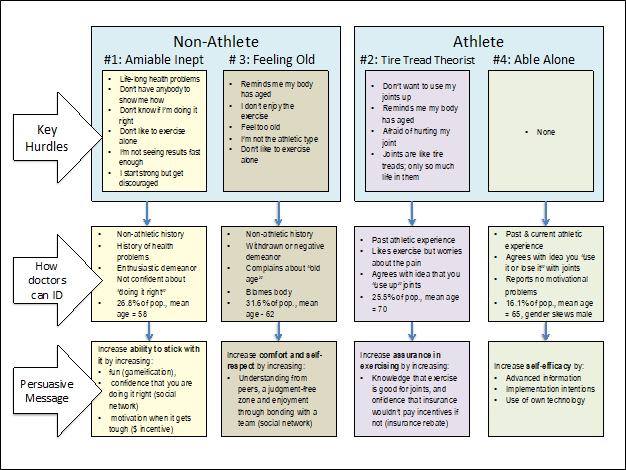
Of the non-athletes, segments #1 and #3 differ in their feeling toward exercise. Segment #1 is interested in exercise (reporting that they start strong), but often get discouraged because they aren’t seeing results fast enough and don’t know if they are doing the exercises right. We term this segment, the “Amiable Inept.” They are interested in all four interventions.
Segment #3 wants to avoid exercise, noting that they don’t enjoy exercise and it reminds them that their bodies have aged. This segment we term, “Feeling Old.” Here, comparing segments #1 and #3, we observe that neither group has a history of exercise, but the dominating feeling for one group is uncertainty/fickleness and the dominating feeling for the other is embarrassment/shame.
Of the athletes, we see divergent patterns that are focused on a key belief about how joints work. Segment #2 reports enjoying exercise, but is worried by joint discomfort they feel and are anxious about further injuring their joint—this is predicated on their belief that joints are like tire treads and are a resource that is used up eventually. Not surprisingly, then, they are interested in the insurance rebate. We term this segment, the “Tire Tread Theorists.” On the other hand, segment #4 does not agree with a tire tread theory and reports no significant hurdles to exercising. This group also reports no interest in any of the interventions and seems confident to manage on their own. We term this segment, “Able Alone.”
Finally, we look at the descriptions of demographic variables by segment. These data did not improve our models—for example, the segment here that doesn’t exercise because of feeling old (Segment #3) is the second youngest of the population.
Discussion
Most approaches to population health focus on stratification of patients using clinical data. In this paper, we present an approach to understanding populations of patients using tools developed in consumer research. Using market segmentation, we were able to generate novel insights into barriers that impact patient adherence.
Overall, we found that adherence is influenced, not by demographic factors, but by different behavioral and attitudinal factors that subsequently predict the efficacy of different interventions. With knowledge of the different segments that exist, their relative size, and their unique barriers to engage in a behavior, we can better predict what interventions will be effective across the entire population and to design segment-specific interventions with a higher likelihood of success. This analysis illuminates key hurdles for each segment and, taken together, leads us to build a phenotype characterization (or “personality”) for each segment. The phenotypes suggest how providers might identify any given patient’s likely segment membership through visual or conversational cues and better predict what intervention is most attractive to them. Importantly, it guides the precise persuasive content to include in an appeal to adopt the intervention. In essence, this segmentation analysis allows us to understand why the individual is hindered and, therefore, why a particular solution will appeal to that patient.
This approach can offer patients the most appealing intervention approach and the tailored persuasive lever by segment. For example, for segment #1, the persuasive message entails increasing patients’ ability to stick with it by increasing fun, confidence in skills, or an external monetary incentive when the going gets boring or results are slow. The persuasive key for segment #2 is to increase assurance in exercising through educating them about the fallacy of the tire tread theory and using their lay theory that insurance companies wouldn’t incentivize a behavior that would cost more down the line. For segment #3, the persuasive message is that a social support group will offer understanding from peers in the same situation. For Segment 4, persuasion to exercise is not needed and a clinician could instead share advanced fitness techniques, discuss specific implementation intentions, or suggest using personal technology (phones, FitBits, etc) to monitor adherence.
This segmentation approach is critical to our understanding of the effectiveness of population health interventions (Figure 3).
Figure 3. Development of market size for each intervention. This market size indicates the realistic cap on the number of likely adopters (“consumers”). We see that, because the social network intervention appeals to two of the larger segments, it is the intervention with the largest market size.
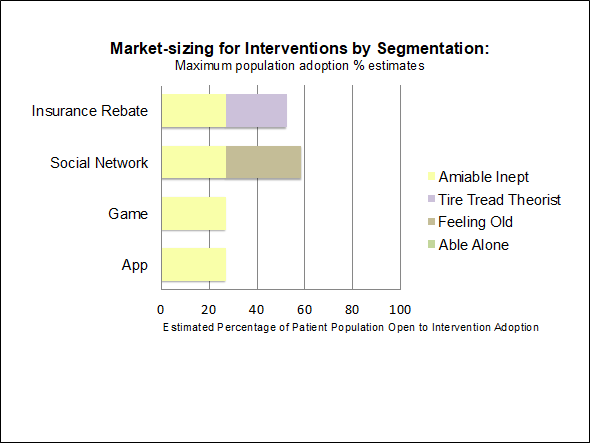
For example, the most popular intervention is the insurance rebate, but if launched, the best possible adoption rate would not be greater than 60% of the total patient population. In other words, low adoption rates of interventions may not mean that they don’t work but that they work very well for a small segment of the population. Second, using tailored persuasive messages to encourage adoption of a relevant intervention is an important step toward target marketing, a practice that follows logically from segmentation insights.
Importantly, we examined patients at one academic medical center and with one medical condition, targeting one behavior. These findings do not generalize to other populations or target behaviors. However this should not be framed as a limitation of the analytic approach but rather as its point. The ease of running this sort of individualized analysis and its usefulness in increasing patient engagement suggest that such studies can and should be conducted to understand any number of desirable patient behaviors for specific populations.
Population health is an exciting and important challenge. Imagining effective population health will need to consider both clinical and behavioral dimensions of patient engagement. The data, the analyses, and the interventions required for effective population health need to extend far beyond current approaches. This paper provides insights into one interdisciplinary framework with the potential to dramatically increase the effectiveness of population health interventions and adherent patients.
Acknowledgements
We would like to thank the following individuals for their assistance in making this project a success: Rhett K. Hallows, MD, Ashley N. Grimsley, PA-C, Donald F. O’Malley, Jr., MD, Michael C. Comstock, MD, Samuel S. Wellman, MD, Andre C. Grant, MD, David E. Attarian, MD, Blake R. Boggess, DO, Scott L. Buckel, DO, Lee H. Diehl, MD, Christopher B. Cole, MMSc, PA-C, Joseph P. Shinnick, MHP, PA-C, Paul J.W. Tawney, MD, Thorsten M. Seyler, MD, Cody Malley III, ATC, LAT, PA-C, Alan Moses, PA-C, and Marianne Paul, PA-C.
References
- Kindig D, Stoddart G. What is population health? Am J Public Health 2003; 93(3):380-3.
- Avorn J. The psychology of clinical decision making — Implications for medication use. N Engl J Med 2018; 378:689-691.
- Volpp KG, Krumholz HM, Asch DA. Mass customization for population health. JAMA Cardiol 2018; 3(5):363-364.
- Wind Y. Issues and advances in segmentation research. J Mktg Res 1978; 15(3): 317-337.