Austin J. Triana, Lauren A. Hatcher, Stefan Koester, Vanderbilt University School of Medicine; Dawn Iacobucci, Vanderbilt University Owen Management School of Business; Arthur B. Laffer, The Laffer Center; and R. Larry Van Horn, Vanderbilt University Owen Management School of Business
Contact: austin.j.triana@gmail.com
Abstract
What is the message? U.S. hospitals and insurers must publicly disclose the negotiated rates for healthcare services. However, U.S. consumers’ use of price transparency tools is low because of limited awareness and motivation. To better understand consumer attitudes, the authors conducted a survey that revealed a discrepancy between beliefs and preferences: While most Americans strongly prefer less expensive healthcare options, they do not see the value in shopping for care and underestimate the opportunity to save. The findings thus highlight an opportunity to educate patients about price variations and ways they can save.
What is the evidence? Primary data collected through an online survey administered to a census-matched sample of 1,539 Americans from December 15, 2021, to January 5, 2022.
Timeline: Submitted: August 14, 2022; accepted after review: September 23, 2022.
Cite as: Austin J. Triana, Lauren A. Hatcher, Stefan Koester, Dawn Iacobucci, Arthur B. Laffer, R. Larry Van Horn. 2022. Ignorance is Not Bliss: Discordant Beliefs and Preferences for Prices Among Healthcare Consumers in the United States. Health Management, Policy and Innovation (www.HMPI.org), Volume 7, Issue 3.
Funding: This work was supported financially by the Vanderbilt Center for Healthcare Market Innovation and the 1065 Institute (the Laffer Center). Austin Triana received a stipend from the 1065 Institute as part of this work.
Conflict of interests: No other income derived from this work, and the authors have no potential conflicts of interest to disclose.
Ethics approval: This research was approved by the Vanderbilt University Institutional Review Board.
Introduction
Over the past decade, patient financial responsibility for healthcare has increased with a corresponding need for more transparency in price and quality for consumers.1,2 Three recent federal rules address this need. First, the Centers for Medicare and Medicaid Services (CMS) price transparency rule, effective January 1, 2021, requires hospitals to publicly disclose the negotiated rates for 300 “shoppable” services in a machine-readable file.3 Second, the No Surprises Act, effective January 1, 2022, establishes federal protection against surprise medical bills, requiring providers to deliver good-faith estimates for out-of-network medical care.4 Third, insurers are required to publicly disclose negotiated rates for in-network providers, effective July 1, 2022.5 Collectively, these three rules introduce a level of price visibility into healthcare markets that was previously opaque, with the hope of empowering patients to shop for low-cost, high-quality care.
With greater transparency, patients have become actors making choices with financial responsibility. Around 30% of American workers with insurance are on high-deductible plans.6 In addition, prices for the same service vary widely between different hospitals in the same city.7 Considering these factors, consumers could save a significant amount of money by shopping for medical care.8,9 However, several studies have shown low engagement with price transparency tools.10–14 Similarly, the usage of online quality tools remains low.2,15 The accessibility and reliability of these tools are highly variable, and the information contained within them is often incomplete.16 However, the low usage of these tools is likely multifactorial and is not well understood.
With low engagement, it appears that cost-sharing and comparison tools have had a limited impact in advancing consumer-driven healthcare.17 Empowering patients as consumers will require a deeper understanding of their perspective. If barriers to shopping are better understood, it may be possible for policymakers and healthcare organizations to better engage patients as consumers, allowing them to choose healthcare that best aligns with their own preferences. To fill these gaps, we assessed the attitudes, beliefs, and preferences of U.S. healthcare consumers using a multimodal survey. Our objective was to investigate and quantify barriers to consumer-driven healthcare in the United States in the setting of price transparency.
Methods
Study Design
This observational study was designed in two parts. In the first portion, demographic data was gathered, and respondents were asked in a survey about their attitudes and beliefs regarding healthcare utilization and prices. Using the Engel-Blackwell-Miniard Model, we assessed barriers at multiple stages of the consumer decision process, including awareness, motivation, information search, and comparison of alternatives.18
In the second portion of the study, we administered three discrete choice experiments (DCEs) to assess theoretical tradeoffs among respondents when purchasing healthcare. DCEs and choice-based conjoint analyses are commonly used to assess consumer preferences when making purchase decisions.19,20 In marketing, this approach is used to understand customer choices to determine the optimal price of a product for a given set of attributes. In the medical literature, this technique has been used extensively to understand preferences around intensive treatments, such as chemotherapy.21
We designed three separate DCEs to assess consumer preferences. In the first experiment, we asked respondents to choose a primary care provider for a routine visit or check-up based on their current state of health. In the second DCE, respondents were given a scenario in which they had severe knee pain and were asked to choose an imaging facility for an MRI of the knee. In the third DCE, female respondents were given a scenario in which they were pregnant and were asked to choose a hospital for the delivery. We studied these particular scenarios because the importance of several of the attributes was likely to vary, and we sought to test the relationships in multiple scenarios to improve external validity and generalizability.
For all three scenarios, our DCEs included four service attributes: price, quality, provider relationship, and convenience. The levels for each attribute are shown in Appendix 1. Prior work indicates that these four features heavily influence healthcare choices.20 In our experiments, price was described as the “out-of-pocket cost” for respondents. Healthcare prices can vary up to ten-fold between providers, so the out-of-pocket costs in these experiments reflect plausible price ranges that patients are often exposed to. 10,22–26 Quality was represented on a scale from one to five stars. We intentionally omitted a detailed description of quality to replicate the true experience that consumers face, as hospitals and providers are scored by many different rating agencies (including CMS, US News & World Report, Healthgrades, Yelp, Google, and others) on complex, nonstandard criteria. For example, the CMS star rating can reflect over 100 different individual quality measures.27 Convenience was represented by travel time from home, ranging from 15 to 90 minutes.
For the primary care and newborn delivery DCEs, three levels captured the provider relationship: 1) a doctor that you know, 2) a doctor that is recommended by a friend, and 3) a new doctor. For the knee MRI DCE, there were only two levels: 1) a facility that your doctor recommended and 2) a facility that you found online. We made this distinction because the physician usually does not interact with the patient during the imaging process, unlike a primary care visit or newborn delivery.
Participant population
This study received approval from our university’s institutional review board. Participants were recruited through CloudResearch Prime Panels, a survey fielding recruitment platform that aggregates several market research panels to ensure high-quality data collection.28 This method of recruitment enables data collection that is more representative of the U.S. population than other survey panels or microtask sites like MTurk. A total of 1,694 respondents completed the survey. Participants were excluded if they self-reported living outside the United States (n = 11), failed an attention check (n = 114), or sped through the survey questions at less than 30% of the median time (n = 30).29 The remaining 1,539 responses were distributed across the three DCEs as follows: 575 respondents in the primary care group, 540 respondents in the knee MRI group, and 424 respondents in the newborn delivery group. For the primary care and knee MRI groups, participants were at least 26 years old. In the newborn delivery group, all participants were females from 18 to 50 years old.
Survey Distribution and Data Collection
Data collection took place between December 15, 2021, and January 5, 2022. Once the survey was activated, respondents selected the job in the CloudResearch platform and were redirected to the survey. After completion, respondents were redirected back to the CloudResearch platform where they received credit and were paid $5.
Respondents were first asked about attitudes and beliefs regarding healthcare prices. Afterward for each DCE, respondents were given nine choice sets (or tasks) in which they had to choose one of three options (Appendix 2). Respondents were encouraged to pick the choice that best aligned with their own preferences for the scenario. In each task, respondents could select a fourth option if they would not choose any of the three options presented.
Sawtooth Software Lighthouse Studio, an application designed and validated for choice-based conjoint analysis, generated 300 permutations of the survey, each with nine tasks in which respondents had to choose one of three provider options.30 With this approach and a sample size of at least 400 respondents, the DCEs were powered for statistically significant main effects as well as interactions and subgroup analyses.31
Data Analysis
Data analysis was performed in Sawtooth software (version 9.13.1) and a statistical software package (R, version 4.0.1).
There are two common methods to analyze DCEs: multinomial logistic regression and hierarchical Bayes estimation.19 Despite different mathematical approaches, both methods estimate preferences based on observed choices among alternatives. In this study, both methods were used in the analysis.
First, multinomial logistic regression models were used to understand the marginal effect of choice attributes for the entire aggregated sample. The dependent variable was the consumer’s choice, and the independent variables were price, quality, convenience, and provider relationship. In the models, each of these input variables has a corresponding coefficient—also called a utility—which is a numerical score that reflects how much an input influences the consumer’s decision to choose a certain option.
After computing aggregate utilities for the entire sample, a hierarchical Bayes approach was used to estimate preferences for each respondent, as implemented by Sawtooth. In a hierarchical Bayes algorithm, individuals’ part-worth utilities are estimated two-fold with draws from a multivariate normal distribution in addition to a logit model. This introduces stochasticity that improves the accuracy of the final utility estimations and allows us to analyze the tradeoff preferences of each respondent.32 Once individuals’ part-worth utilities were calculated, it was possible to compare the importance of features by analyzing the differences in utility.30 Importance scores were calculated for each respondent, and respondents were grouped by their strongest preferences.
Results
A total of 1,539 respondents were analyzed. Most of the patients were female (69%) and white (72%) with a median age of 44 and a median household income of $44,000. Summary statistics with a comparison to the U.S. population are shown in Table 1.
Table 1: Demographic characteristics of survey respondents and representativeness of sample to U.S. population
| Characteristic | Survey respondents,
n = 1,539 |
US Populationa
n = 328,000,000 |
| Median age | 44 | 39 |
| Median household income | $44,000 | $65,700 |
| Gender | ||
| Female | 69% | 51% |
| Male | 31% | 49% |
| Raceb | ||
| White | 72% | 75% |
| Black | 14% | 14% |
| Asian | 5% | 6% |
| Hispanic or Latinx | 13% | 18% |
| Native American | 2% | 2% |
| Other | 1% | 6% |
| Educationc | ||
| Less than high school | 4% | 10% |
| High school graduate | 28% | 29% |
| Some college | 36% | 26% |
| 4-year degree | 22% | 21% |
| Master’s degree or higher | 11% | 13% |
| Health Insurance | ||
| Uninsured | 10% | 9% |
| Medicaid | 24% | 18% |
| Medicare | 25% | 18% |
| Self-paid | 8% | 14% |
| Commercial | 32% | 54% |
Source: Authors’ survey data, American Community Survey, United States Census. Notes: Data are expressed as median or %; aUS population data include children younger than 18; bCumulative percentage of race is greater than 100% because some respondents chose more than one race; cU.S. Population: educational attainment of adults aged 25 and older
We identified multiple barriers that likely obstruct shopping behavior in practice (Figure 1).
Figure 1: Attitudes and beliefs of survey respondents regarding prices and finances in healthcare
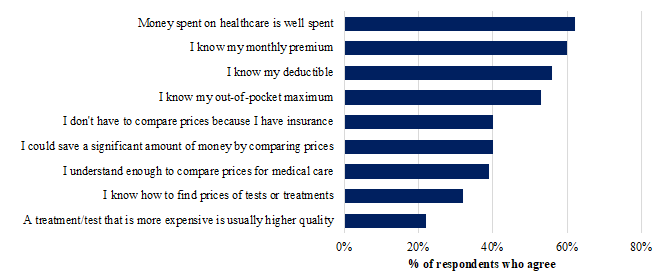
Source: Authors’ survey data. Notes: Respondents were given a five-point Likert scale (strongly disagree, somewhat disagree, neither agree nor disagree, somewhat agree, strongly agree).
Few respondents (24%) were aware that hospitals are required to publicly disclose prices for tests and treatments. Over half of respondents reported that they knew their insurance deductible, out-of-pocket maximum, and monthly premium, and 40% of respondents agreed that they did not have to compare prices for medical care because they had insurance. However, 40% of respondents agreed that they could save a significant amount of money by comparing prices for medical care. Only 32% of respondents reported knowing how to find prices for tests or treatments.
Respondents were asked to estimate the amount of price variation between providers within the same city (Figure 2).
Figure 2: Respondent expectations for price variation between hospitals in the same city
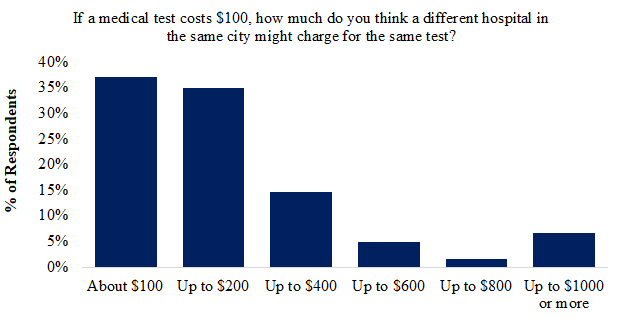
Most respondents (72%) expected price to vary less than 200% for the same test at two different hospitals in the same city. Nearly 15% of respondents expected price to vary up to 400%, and 13% of respondents expected price to vary more than 400% between hospitals.
Multinomial logistic regressions revealed the average marginal effects of each service attribute (Appendix 3). Across the three healthcare scenarios, respondents on average preferred providers who were less expensive, higher quality, more convenient, and more familiar. For all three DCEs, price was the most important variable for most respondents (59%), followed by quality (33%). Nearly all (93%) respondents preferred to pay less rather than more. Figure 3 shows that this finding was consistent in all three DCEs with some minor differences.
Figure 3: Feature Importance Analysis: Breakdown of respondents by which feature was most important in choosing a healthcare provider
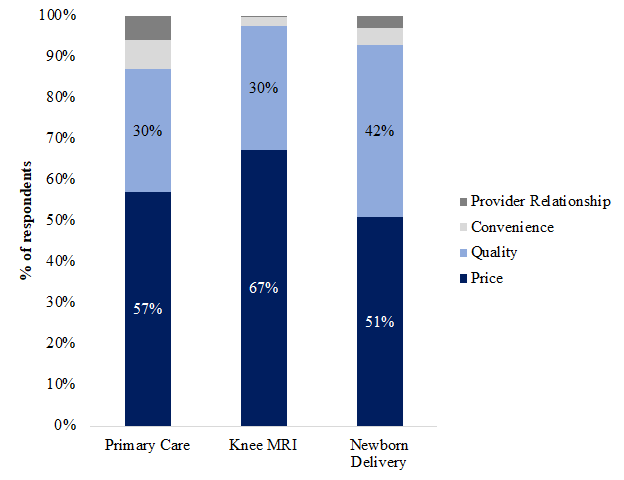
Source: Authors’ discrete choice experiment data. Notes: Using individuals’ utility scores, it was possible to determine the most influential variable for each respondent. Overall, price was the most important variable for most respondents.
For a knee MRI, price was most important for 67% of respondents, more than double the number for which quality was most important (30%). For a newborn delivery, price was most important for 51% of respondents, slightly more than quality (42%). In all three DCEs, convenience and provider relationship were the most important factors for less than 10% of respondents.
Discussion
There has been a prevailing narrative that patients cannot or will not shop for medical care. Prior studies have shown that price information alone is important but unlikely to reduce patients’ spending.10,17,24 However, our study is unique in that we have quantified and compared prior beliefs with experimental behavior.
First, like other studies, we have shown that consumer-driven behavior is impacted by barriers at multiple levels: awareness, motivation, self-efficacy, health literacy, and technology literacy.33,34 Awareness of publicly available prices is a major hindrance, with less than a quarter of respondents knowing that hospitals are required to publicly disclose prices. However, it appears that awareness is rapidly improving, increasing from 9% to 25% in less than a year.35
In addition to awareness, we identified multiple factors influencing motivation to shop for care. Nearly half of the respondents felt that they did not need to shop for care because they had insurance. This is surprising given the prevalence of insurance plans with cost-sharing mechanisms. In other words, consumers feel protected by insurance and do not see the benefit of shopping for care. Similarly, 60% of respondents do not agree that they could save a significant amount of money by shopping for care. A large majority of respondents underestimated the amount of price variation between providers.
Regarding healthcare prices, ignorance is not bliss. Consumers do not feel motivated to shop for care, yet they could be significantly better off by shopping for care. It has been shown that healthcare prices regularly vary up to ten-fold between providers.7,22,36 Less than 15% of respondents are aware of this degree of price variation.
However, when respondents were shown this price variation experimentally in the DCEs, most respondents became price sensitive: Price was the most important factor for most consumers (59%), more so than quality, convenience, and the provider relationship. This experimental finding demonstrates discordant prior beliefs and demonstrated preferences among healthcare consumers. While most respondents were not aware of the degree of price variation, they reacted strongly to the information experimentally. When patients are given complete information that is easy to understand, they make economic trade-offs according to their own preferences, as they would when shopping for other goods and services outside of healthcare. Just as when shopping for milk or automobiles, patients can make rational choices if they can access the relevant information.
In our research, we also built upon the existing literature. Prior studies have shown mixed results in understanding the healthcare purchasing process. Some studies have shown that quality is more important to consumers than price.37,38 As we have replicated, other studies have shown the opposite.39 These contradictory findings are the result of different study samples and designs. More importantly, we have highlighted something that is actionable. Consumers are not aware of price transparency and price variation, yet their experimental behavior indicates that they would find this information highly valuable. Thus, patients with financial responsibility may start acting as price shoppers if they understood the potential benefit.
Limitations
One limitation is that the study sample was not perfectly representative of the U.S. population, potentially limiting generalizability. By design, we created one DCE for women’s health; thus, the sample was skewed with more women than men. As discussed earlier, we believe this design improves generalizability, as our findings in Exhibit 4 were consistent across samples from different populations. However, in the future, it would be reasonable to include another DCE for men’s health to investigate how trade-offs apply for gender-specific healthcare. In addition, the study sample had a lower median income than that of the US population. It is likely that online workers tend to be more price sensitive than the average American, possibly confounding the study results.
Another limitation of this study is that respondents were not seeking care at the time of the survey. In other words, these were not real patients facing real healthcare decisions. It is possible that their preferences would be different when faced with these decisions outside of a research setting. This may be particularly important for patients with existing physician relationships, as they may value continuity of care and the provider relationship even more.
An additional limitation is that we did not collect data on survey interpretation and understanding. It is possible that some respondents did not completely understand the tasks, levels, or features, and that their choices did not reflect their true preferences. In addition, survey fatigue could have contributed to data noise. Furthermore, one weakness of DCEs is that the results are dependent on the design of the experiment. While the price levels in this study were evidence-based, the importance scores are thus in part related to the range of price levels. If this study were repeated with different price ranges, the importance scores may differ.
Conclusion
There have been great advancements toward consumer-driven healthcare in recent years, particularly in price transparency. Most patients value low prices more than quality, convenience, or provider relationship when purchasing health care. However, there are multilevel barriers that impede consumer-driven healthcare and price shopping behavior. Notably, consumers are not aware of the degree of price variation between healthcare providers.
This research highlights an unprecedented opportunity for policymakers and healthcare organizations to focus on consumer motivation. Most consumers are highly price sensitive, preferring lower prices. If consumers understand the amount of price variation between healthcare providers, a significant number of patients may become price shoppers, using price and quality comparison tools to realize savings in out-of-pocket costs.
As data and technology continue to improve, it is vital to enable patients as informed decisionmakers. Further research can build on this work by understanding barriers to consumer-driven healthcare, exploring interventions to empower patients as consumers, and investigating how patients make trade-offs in practice.
References
- Taylor K. Embracing and Advancing the Consumerist Era in Healthcare. Front Health Serv Manage. 2019;36(2):15-25.
- Consumer Preferences and Online https://www.hsr.org/node/453119Comparison Tools Used to Select a Surgeon. JAMA Surgery. Accessed March 10, 2022. https://jamanetwork.com/journals/jamasurgery/fullarticle/2595025
- New Year, New CMS Price Transparency Rule For Hospitals. Health Affairs. Accessed March 10, 2022. https://www.healthaffairs.org/do/10.1377/forefront.20210112.545531/full/
- Dec 10 KPP, 2021. No Surprises Act Implementation: What to Expect in 2022. KFF. Published December 10, 2021. Accessed July 19, 2022. https://www.kff.org/health-reform/issue-brief/no-surprises-act-implementation-what-to-expect-in-2022/
- Trump Administration Finalizes Transparency Rule For Health Insurers. Health Affairs. Accessed July 19, 2022. https://www.healthaffairs.org/do/10.1377/forefront.20201101.662872
- Nov 10 P, 2021. 2021 Employer Health Benefits Survey – Summary of Findings. KFF. Published November 10, 2021. Accessed July 19, 2022. https://www.kff.org/report-section/ehbs-2021-summary-of-findings/
- Kliff S, Katz J, Taylor R. Hospitals and Insurers Didn’t Want You to See These Prices. Here’s Why. The New York Times. https://www.nytimes.com/interactive/2021/08/22/upshot/hospital-prices.html. Published August 22, 2021. Accessed July 19, 2022.
- Does Enrollment in High‐Deductible Health Plans Encourage Price Shopping? HSR. Accessed July 19, 2022.
- Association of a national insurer’s reference‐1based pricing program and choice of imaging facility, spending, and utilization. HSR. Accessed July 19, 2022. https://www.hsr.org/node/57048
- Chernew M. Are Health Care Services Shoppable? Evidence from the Consumption of Lower-Limb MRI Scans. National Bureau of Economic Research; 2018.
- Desai SM, Hatfield LA, Hicks AL, Chernew ME, Mehrotra A, Sinaiko AD. What are the potential savings from steering patients to lower-priced providers? a static analysis. Am J Manag Care. 2019;25(7):e204-e210.
- Whaley CM, Vu L, Sood N, Chernew ME, Metcalfe L, Mehrotra A. Paying Patients To Switch: Impact Of A Rewards Program On Choice Of Providers, Prices, And Utilization. Health Aff (Millwood). 2019;38(3):440-447. doi:10.1377/hlthaff.2018.05068
- Patterns of Use of a Price Transparency Tool for Childbirth Among Pregnant Individuals With Commercial Insurance. JAMA Network Open. Accessed March 10, 2022. https://jamanetwork.com/journals/jamanetworkopen/fullarticle/2783178
- Mehrotra A, Dean KM, Sinaiko AD, Sood N. Americans Support Price Shopping For Health Care, But Few Actually Seek Out Price Information. Health Aff Proj Hope. 2017;36(8):1392-1400. doi:10.1377/hlthaff.2016.1471
- Public Awareness, Perception, and Use of Online Physician Rating Sites | Health Care Quality. JAMA. Accessed March 10, 2022. https://jamanetwork.com/journals/jama/fullarticle/1829975
- Berkowitz ST, Siktberg J, Hamdan SA, Triana AJ, Patel SN. Health Care Price Transparency in Ophthalmology. JAMA Ophthalmol. 2021;139(11):1210-1216. doi:10.1001/jamaophthalmol.2021.3951
- Desai SM, Shambhu S, Mehrotra A. Online Advertising Increased New Hampshire Residents’ Use Of Provider Price Tool But Not Use Of Lower-Price Providers. Health Aff (Millwood). 2021;40(3):521-528. doi:10.1377/hlthaff.2020.01039
- Gordon D, Ford A, Triedman N, Hart K, Perlis R. Health Care Consumer Shopping Behaviors and Sentiment: Qualitative Study. J Particip Med. 2020;12(2):e13924. doi:10.2196/13924
- Lancsar E, Louviere J. Conducting discrete choice experiments to inform healthcare decision making: a user’s guide. PharmacoEconomics. 2008;26(8):661-677. doi:10.2165/00019053-200826080-00004
- Eline M. van den Broek-Altenburg P, Adam J. Atherly P. Patient Preferences for Provider Choice: A Discrete Choice Experiment. Am J Manag Care. 2020;26(7):e219-e224. Published online July 15, 2020. Accessed March 10, 2022. https://www.ajmc.com/view/patient-preferences-for-provider-choice-a-discrete-choice-experiment
- Norman R, Anstey M, Hasani A, Li I, Robinson S. What Matters to Potential Patients in Chemotherapy Service Delivery? A Discrete Choice Experiment. Appl Health Econ Health Policy. 2020;18(4):589-596. doi:10.1007/s40258-020-00555-y
- The Transformative Potential for Price Transparency in Healthcare: Benefits for Consumers and Providers. HMPI. Published December 9, 2019. Accessed July 19, 2022. https://hmpi.org/2019/12/09/the-transformative-potential-for-price-transparency-in-healthcare-benefits-for-consumers-and-providers/
- What do we know about people with high out-of-pocket health spending? Peterson-KFF Health System Tracker. Accessed March 10, 2022. https://www.healthsystemtracker.org/chart-collection/know-people-high-pocket-spending/
- Saloner B, Polsky D, Kenney GM, Hempstead K, Rhodes KV. Most Uninsured Adults Could Schedule Primary Care Appointments Before The ACA, But Average Price Was $160. Health Aff Proj Hope. 2015;34(5):773-780. doi:10.1377/hlthaff.2014.1258
- Glass DP, Kanter MH, Jacobsen SJ, Minardi PM. The impact of improving access to primary care. J Eval Clin Pract. 2017;23(6):1451-1458. doi:10.1111/jep.12821
- Mehrotra A, Huckfeldt PJ, Haviland AM, Gascue L, Sood N. Patients Who Choose Primary Care Physicians Based On Low Office Visit Price Can Realize Broader Savings. Health Aff Proj Hope. 2016;35(12):2319-2326. doi:10.1377/hlthaff.2016.0408
- Overall hospital quality star rating. Provider Data Catalog. Accessed March 10, 2022. https://data.cms.gov/provider-data/topics/hospitals/overall-hospital-quality-star-rating/
- Chandler J, Rosenzweig C, Moss AJ, Robinson J, Litman L. Online panels in social science research: Expanding sampling methods beyond Mechanical Turk. Behav Res Methods. 2019;51(5):2022-2038. doi:10.3758/s13428-019-01273-7
- Greszki R, Meyer M, Schoen H. The impact of speeding on data quality in nonprobability and freshly recruited probability-based online panels. Online Panel Research. John Wiley & Sons, Ltd; 2014:238-262. doi:10.1002/9781118763520.ch11
- Lighthouse Studio Help. Accessed July 19, 2022. https://sawtoothsoftware.com/help/lighthouse-studio/manual/index.html?hid_web_getstart.html
- de Bekker-Grob EW, Donkers B, Jonker MF, Stolk EA. Sample Size Requirements for Discrete-Choice Experiments in Healthcare: a Practical Guide. The Patient. 2015;8(5):373-384. doi:10.1007/s40271-015-0118-z
- CBC/HB Technical Paper (2009). Accessed July 19, 2022. https://sawtoothsoftware.com/resources/technical-papers/cbc-hb-technical-paper
- Whaley C, Schneider Chafen J, Pinkard S, et al. Association between availability of health service prices and payments for these services. JAMA. 2014;312(16):1670-1676. doi:10.1001/jama.2014.13373
- Gourevitch RA, Desai S, Hicks AL, Hatfield LA, Chernew ME, Mehrotra A. Who Uses a Price Transparency Tool? Implications for Increasing Consumer Engagement. Inq J Med Care Organ Provis Financ. 2017;54:46958017709104. doi:10.1177/0046958017709104
- Jun 28 P, 2021. Poll: Few are Aware of Hospital Price Transparency Requirements. KFF. Published June 28, 2021. Accessed March 10, 2022. https://www.kff.org/health-costs/press-release/poll-few-are-aware-of-hospital-price-transparency-requirements/
- Oseran AS, Ati S, Feldman WB, Gondi S, Yeh RW, Wadhera RK. Assessment of Prices for Cardiovascular Tests and Procedures at Top-Ranked US Hospitals. JAMA Intern Med. 2022;182(9):996. doi:10.1001/jamainternmed.2022.2602
- Schwartz AJ, Yost KJ, Bozic KJ, Etzioni DA, Raghu TS, Kanat IE. What Is The Value Of A Star When Choosing A Provider For Total Joint Replacement? A Discrete Choice Experiment. Health Aff (Millwood). 2021;40(1):138-145. doi:10.1377/hlthaff.2020.00085
- Manik R, Carlos RC, Duszak R, Sadigh G. Costs Versus Quality in Imaging Examination Decisions. J Am Coll Radiol JACR. 2022;19(3):450-459. doi:10.1016/j.jacr.2021.11.015
- Mühlbacher AC, Bethge S, Reed SD, Schulman KA. Patient Preferences for Features of Health Care Delivery Systems: A Discrete Choice Experiment. Health Serv Res. 2016;51(2):704-727. doi:10.1111/1475-6773.12345