Angela Chen, The Wharton School, University of Pennsylvania; William S. Comanor, UCLA Fielding School of Public Health; H.E. Frech III, University of California, Santa Barbara; and Mark V. Pauly, The Wharton School, University of Pennsylvania
Contact: pauly@wharton.upenn.edu
Abstract
What is the message? If non-U.S. countries, i.e. all countries in the rest of the world (ROW), were to contribute more toward drug development costs, the impact on the number of new drugs, health improvements, and consumers’ surplus worldwide would be modest. Conversely, if U.S. prices were cut to ROW average levels or to the marginal cost, the impact on the flow of new drugs would be substantial.
What is the evidence? An examination of new FDA-approved drugs in the 2010’s to determine the ROW contribution share to these new branded drugs, and whether the contribution varied across drugs based on their total revenues and drug type.
Timeline: Submitted: June 10, 2023; accepted after review Sept. 1, 2023.
Cite as: Angela Chen, William S. Comanor, H.E. Frech III, and Mark V. Pauly. 2023. The Global Distribution of New Drug R&D Cost: Does the Rest of the World Free Ride? Health Management, Policy and Innovation (www.HMPI.org), Volume 8, Issue 2.
Introduction
New, effective branded drugs are usually sold in developed countries around the world, but the largest market for such drugs is the United States. Nearly all countries in the rest of the world (ROW) have controlled or regulated the price a drug firm can charge if its drug is to be sold in that country, whereas in the United States there have been – and still are – no national limits on the prices or revenues that can be collected (Kyle, 2007). As is well known, the U.S. market supports a disproportionate share of global drug revenues; U.S. drug spending per capita on branded drugs is the highest in the world (Lakdawalla et al., 2008). This means that, relative to population size, U.S. buyers contribute proportionately more to drug firm profits than ROW. Those current profits both incentivize future R&D and provide a return on past R&D.
Higher U.S. prices have led to bipartisan complaints from Republican and Democratic administrations, concerned that countries in ROW with incomes per capita similar to that in the U.S. are inappropriately free riding on payments by Americans. Not only is this pattern alleged to be unfair (by some subjective definition of fairness), but it is also alleged to be economically inefficient because it reduces the expectations of future profits that provide incentives for firms and outside investors to invest in new drug development. The Trump Council of Economic Advisors claimed that ROW countries free ride by seeking to pay only the marginal cost of production and distribution of drugs, making no contribution to global R&D (CEA, 2018).
Prior research provides convincing evidence that unit list prices are much higher in the U.S. than in ROW for branded drugs (Mulcahy et al, 2021). Because drug use per capita does not vary much with prices, there is also a higher contribution to total profits by the U.S. than ROW; the U.S. market was estimated by the Council of Economic Advisors (2018) to contribute 66% or more of global (U.S. plus other developed countries) profits. Both the Trump and Biden administrations have regarded this pattern as one that needs correction. Roughly speaking, the Republican administration wanted ROW to pay more, while recent legislation passed by the Democratic administration intends to help American public insurers and those they cover to pay less.
To provide baseline measures of the current pattern of contributions and to assist in policy formulation going forward, we present in this paper data on the distribution of total revenues and estimated profits for a five-year window after approval for the full set of drugs newly approved by the U.S. FDA between 2014-2017. We estimate revenue (as a proxy for profits) contributions from U.S. and ROW for this set of drugs, as well as the distribution of revenues across drugs. We then draw inferences from this analysis of the magnitude of the impact of any free-riding on the flow of new drugs, compared to counterfactuals in which ROW pays less than it currently does, or pays more toward global R&D. Because future profits expected by the drug firm at the time of R&D investments are hard to measure, and because the relationship between expected profits and the flow of new drugs is uncertain, we present a range of possible values for these alternative scenarios. We also discuss the flow of investment and new drugs under current arrangements relative to the theoretically optimal flow of both R&D and drug discovery.
Our goal was to focus on the universe of recent drug approvals, rather than on a sample of drugs for specific conditions such as cancer (Tay-Teo et al., 2019) or a random sample of older drugs (Di Masi et al., 2016). The lifetime of a patented and approved drug from approval until expiration of protection from generic competition is typically about one decade. Thus, we compare the sum of revenues in our five-year observation period to half of a benchmark estimate of R&D costs per new drug to judge whether U.S. and ROW buyers were expected to cover that cost. Note that our investment analysis focusses on revenues (price times quantity) in comparison to an estimate of R&D spending averaged across all drugs (including those which failed to make it to market). It therefore differs from the Wouters et al (2022) study that looked only at unit price and at the R&D costs of a sample of marketed drugs .
In addition to describing the fractions of recently approved drugs that were sold only in the U.S. versus sold in both the U.S. and ROW, we provide a bracketed range of estimates comparing the number and types of drugs that made it to market with the (smaller) number that would have done so if ROW only paid marginal cost as the CEA charged. We also consider the more challenging question of how many more drugs might have made it to market had ROW paid the same profit contribution per capita as did the U.S. We find that variations in ROW contributions do matter, but their likely impact is relatively modest in terms of the number of new drugs, and that those marginal drugs probably had equally modest contributions to health improvements and consumers’ surplus worldwide. However, we also find that if U.S. markets cut U.S. prices either to ROW actual average levels or further to just marginal cost, the impact on the flow of new drugs would be substantial. We conclude that ROW paying its fair share would be preferable, but U.S. pricing matched to ROW contributions would be disastrous.
Methods
Variation in global public good contributions by drug
Ongoing empirical work (Frech, Pauly, Comanor and Martinez 2023) found that ROW contributions to R&D for older drugs marketed before the mid 2010’s were lower than U.S. contributions but higher than plausible estimates of short-run marginal cost. Most ROW countries did contribute to the profits that can incentivize and direct production of drug innovation – a global public good. In this paper we examine a sample of new drugs with FDA approvals in the 2010’s to determine the ROW contribution share to these new branded drugs, and to see whether contribution varied across drugs depending on their total revenues and drug type.
Drug sample and data sources. We obtained lists of FDA New Molecular Entity (NME) Approvals from 2014 to 2017, inclusive, from the FDA’s website (U.S. Food and Drug Administration, 2022). Of these, we excluded those with orphan designation, resulting in 70 drugs. We then obtained from several sources measures of U.S. and global revenue for up to five years after approval. First, we consulted BioMedTracker from Informa Pharma Intelligence, which is a pharma and biotech database (BioMedTracker, 2023). If revenue data were missing, we next consulted SEC 10-K company filings to locate publicly-reported drug revenue data. If both approaches failed, we searched for company annual reports as a last resort. However, data were not publicly available for drugs launched by private companies, and some public companies did not report drug-specific revenue. Of the initial universe of 70 newly approved drugs, we located data on five years of U.S. revenue and global revenues in the five-year post-launch period for 48 drugs. Table 1 lists the sample of 48 drugs we studied.
Table 1: Revenue sources of 48 non-orphan New Molecular Entity (NME) drugs with positive revenues, approved by the FDA, 2014-2017
| Proprietary Name | Approved Name | Approval Year | NDA Applicant | Revenue source | US Revenue
(5-year, $M) |
ROW Revenue (5-year, $M) |
| Farxiga | Dapagliflozin | 2014 | AstraZeneca | Biomedtracker | 2335 | 3000 |
| Otezla | Apremilast | 2014 | Celgene | Biomedtracker | 5031 | 952 |
| Dalvance | Dalbavancin | 2014 | Durata Therapeutics | Biomedtracker | 249 | 11 |
| Jublia | Efinaconazole | 2014 | Dow Pharmaceutical Sciences | Biomedtracker | 613 | 1036 |
| Jardiance | Empagliflozin | 2014 | Boehringer Ingelheim Pharmaceuticals | Biomedtracker | 1457 | 6217 |
| Orbactive | Oritavancin | 2014 | The Medicines Company | SEC filings | 48 | 13 |
| Belsomra | Suvorexant | 2014 | Merck & Co | Biomedtracker | 286 | 490 |
| Movantik | Naloxegol | 2014 | AstraZeneca | Biomedtracker | 457 | 24 |
| Harvoni | Ledipasvir/sofosbuvir | 2014 | Gilead Sciences | Biomedtracker | 21199 | 10108 |
| Rapivab | Peramivir | 2014 | BioCryst Pharmaceuticals | SEC filings | 27 | 35 |
| Viekira Pak | Ombitasvir/paritaprevir/
ritonavir |
2014 | AbbVie | SEC filings | 1258 | 2949 |
| Zerbaxa | Ceftolozane/tazobactam | 2014 | Cubist Pharmaceuticals | SEC filings | 63 | 58 |
| Savaysa | Edoxaban | 2015 | Daiichi Sankyo Company | Biomedtracker | 92 | 4068 |
| Ibrance | Palbociclib | 2015 | Pfizer | Biomedtracker | 15416 | 5037 |
| Avycaz | Avibactam/ceftazidime | 2015 | Cerexa | SEC filings | 331 | 0 |
| Kybella | Deoxycholic acid | 2015 | Kythera Biopharmaceuticals | SEC filings | 162 | 23 |
| Viberzi | Eluxadoline | 2015 | Furiex Pharmaceuticals | Biomedtracker | 652 | 7 |
| Entresto | Sacubitril/valsartan | 2015 | Novartis | Biomedtracker | 3076 | 2776 |
| Rexulti | Brexipiprazole | 2015 | Otsuka Pharmaceuticals | Biomedtracker | 3581 | 201 |
| Daklinza | Daclatasvir | 2015 | Bristol-Myers Squibb | SEC filings | 1259 | 1830 |
| Vraylar | Cariprazine | 2015 | Forest Laboratories | Biomedtracker | 2859 | 488 |
| Lonsurf | Tipiracil/trifluridine | 2015 | Taiho Pharmaceutical | Biomedtracker | 886 | 418 |
| Tresiba | Insulin degludec | 2015 | Novo Nordisk | Biomedtracker | 2808 | 1941 |
| Aristada | Aripiprazole lauroxil | 2015 | Alkermes | SEC filings | 718 | 0 |
| Veltassa | Patiromer | 2015 | Relypsa | Company annual reports | 409 | 23 |
| Genvoya | Cobicistat/elvitegravir/
emtricitabine/tenofovir alafenamide |
2015 | Gilead Sciences | Biomedtracker | 13598 | 3612 |
| Bridion | Sugammadex | 2015 | Merck & Co | Biomedtracker | 1819 | 2966 |
| Zurampic | Lesinurad | 2015 | Ardea Biosciences | SEC filings | 7 | 0 |
| Zepatier | Elbasvir/grazoprevir | 2016 | Merck & Co | Biomedtracker | 1447 | 1760 |
| Briviact | Brivaracetam | 2016 | UCB Pharma | Biomedtracker | 873 | 280 |
| Nuplazid | Pimavanserin | 2016 | ACADIA Pharmaceuticals | SEC filings | 1147 | 0 |
| Epclusa | Sofosbuviri/velpatasvir | 2016 | Gilead Sciences | Biomedtracker | 7579 | 4675 |
| Xiidra | Lifitegrast | 2016 | Shire Development | Biomedtracker | 1269 | 0 |
| Eucrisa | Crisaborole | 2016 | Anacor Pharmaceuticals | Biomedtracker | 348 | 4 |
| Trulance | Plecanatide | 2017 | Synergy Pharmaceuticals | Biomedtracker | 289 | 0 |
| Parsabiv | Etelcalcetide | 2017 | Amgen | Biomedtracker | 1607 | 609 |
| Kisqali | Ribociclib | 2017 | Novartis | Biomedtracker | 907 | 1508 |
| Symproic | Naldemedine | 2017 | Shionogi | Biomedtracker | 36 | 69 |
| Ingrezza | Valbenazine | 2017 | Neurocrine Biosciences | SEC filings | 3354 | 30 |
| Tymlos | Abaloparatide | 2017 | Radius Health | SEC filings | 712 | 26 |
| Nerlynx | Neratinib | 2017 | Puma Biotechnology | SEC filings | 824 | 178 |
| Vosevi | Sofosbuvir/velpatasvir/
voxilaprevir |
2017 | Gilead Sciences | Biomedtracker | 842 | 236 |
| Mavyret | Glecaprevir/pibrentasvir | 2017 | AbbVie | Biomedtracker | 4903 | 5458 |
| Verzenio | Abemaciclib | 2017 | Eli Lilly and Company | Biomedtracker | 2178 | 941 |
| Ozempic | Semaglutide oral | 2017 | Novo Nordisk | Biomedtracker | 7219 | 2391 |
| Xepi | Ozenoxacin | 2017 | Ferrer International | SEC filings | 1 | 0 |
| Rhopressa | Netarsudil mesylate | 2017 | Aerie Pharmaceuticals | Biomedtracker | 227 | 0 |
| Giapreza | Angiotensin II | 2017 | La Jolla Pharmaceutical Company | SEC filings | 96 | 16 |
We assume that approved drugs developed by public companies for which there is no evidence of any positive revenue had minimal sales or were not offered to any patients, and so are considered as drugs with no sales. Nine drugs that were sold by privately owned firms and did not report revenues may have had positive sales, but those sales were likely to be small.
Sales revenue and contribution to profit-based R&D incentives. The incentive for investment in research and development of a new drug idea is the profit the drug firm can expect to earn from a new drug. Revenue measures exceed profit measures because production and distribution of new drugs once launched has a positive (marginal) cost. This cost is typically thought to be small, in the range of 10 to 25 percent of U.S. revenues (Frech, Pauly, Comanor and Martinez 2023). However, these data cannot be located for either U.S. sales or ROW sales. The cost of production relative to revenue is likely to be larger for ROW than for the U.S. alone. Hence, ROW revenue may overestimate ROW contribution to profits relative to U.S. revenue. Nonetheless, comparing U.S. and ROW revenues across products should still approximately describe profitability differences across products in U.S. versus ROW markets.
ROW revenue share across all marketed drugs. Figure 1 shows the frequency distributions of the 48 drugs by total U.S. and global revenue five years after approval. Figure 2 shows the distribution of U.S. share vs. ROW share.
Figure 1: US and Global Revenue 5 years After Approval
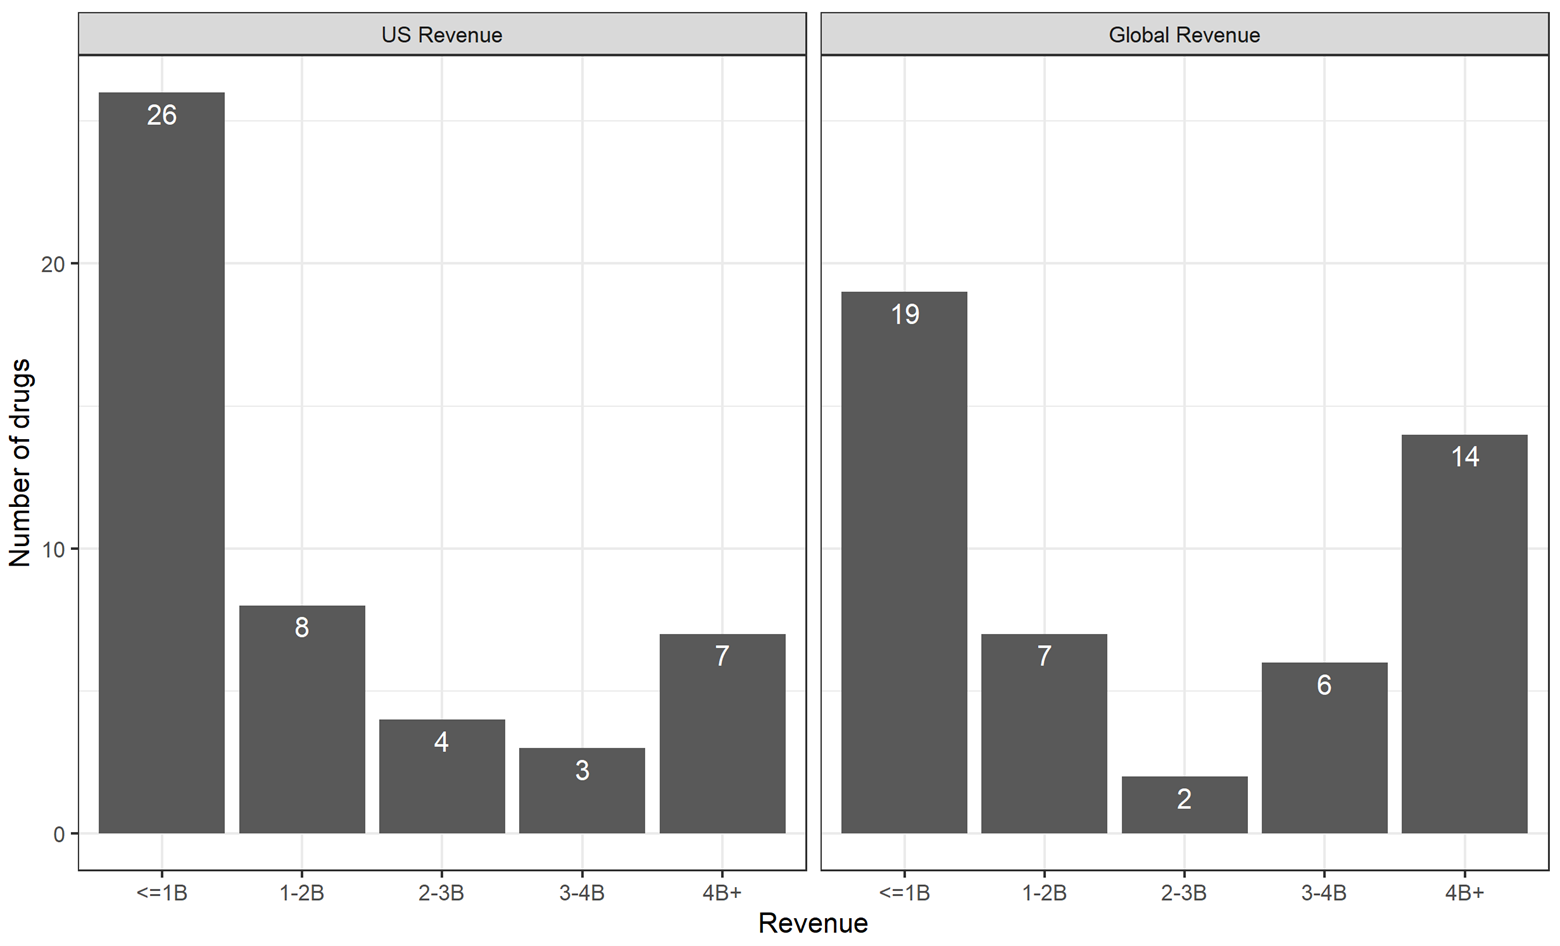
Source: Revenue data from BioMedTracker, SEC 10-K filings, and company annual reports, as described in Table 1.
Figure 2: Proportion of U.S. vs. ROW (5-year revenue)
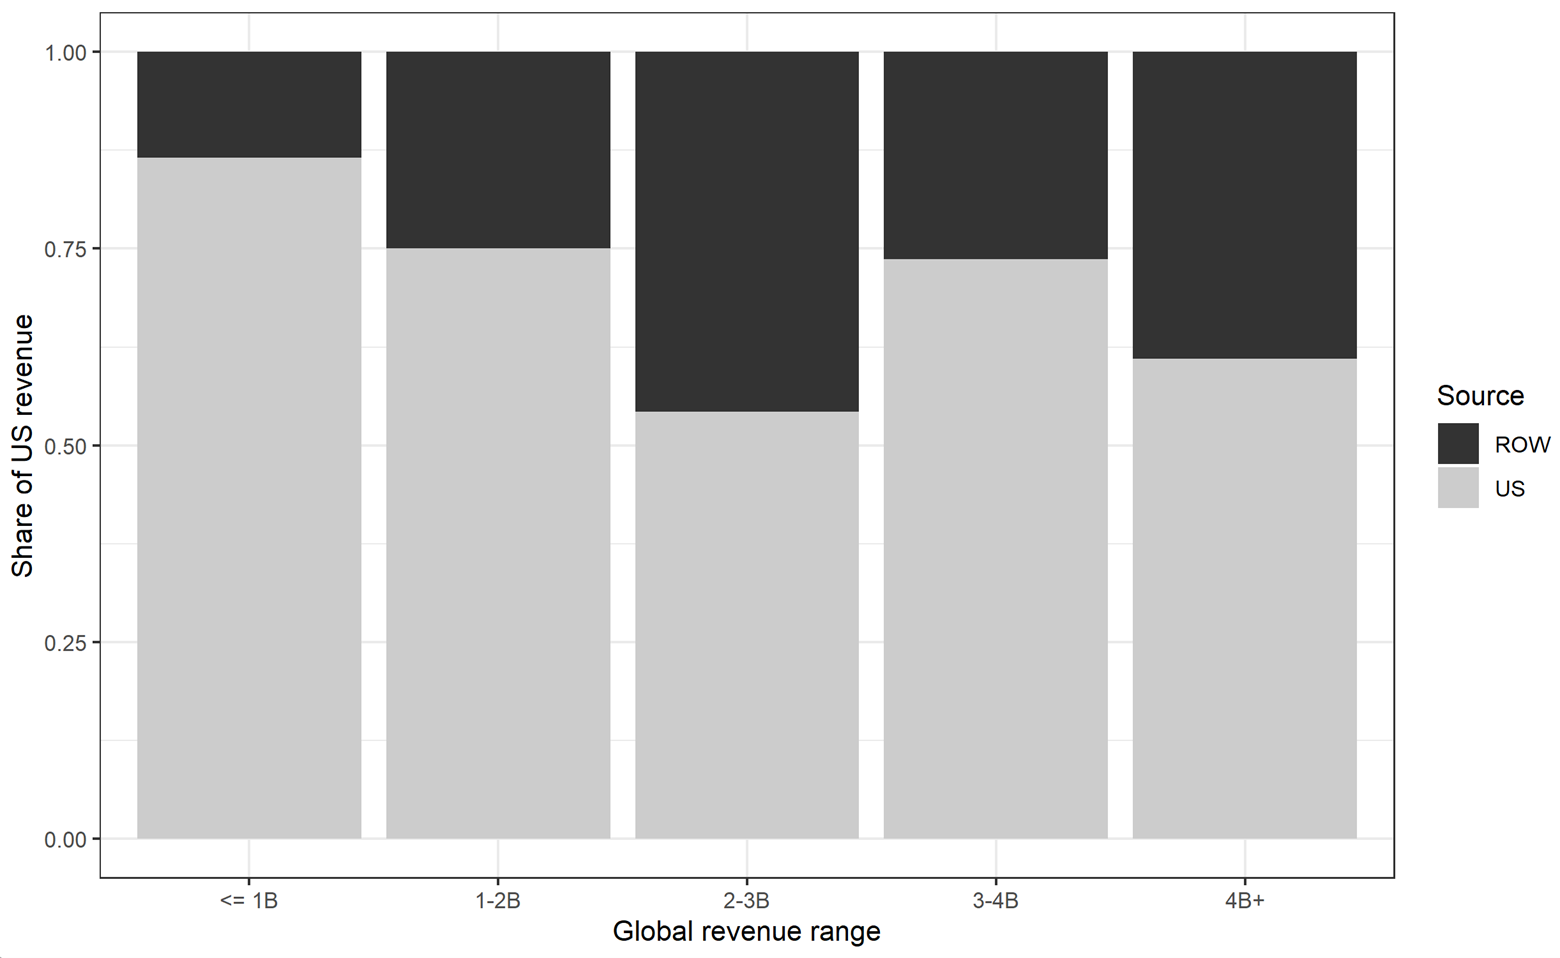
Source: Revenue data from BioMedTracker, SEC 10-K filings, and company annual reports, as described in Table 1.
Over all intervals of total revenue, the U.S. revenue share for this sample was approximately 71% (ROW 29%) – close to the proportion estimated in Frech at al. (Frech, Pauly, Comanor and Martinez 2023) for a much larger sample of older drugs. The ROW contribution is lowest among drugs with the lowest total revenue, at about 14%. Of note, only two drugs had total revenue in the 2 to 3 billion range, so the apparent increase of ROW contribution in that range may be noisy. At 39%, ROW contribution for the last category of drugs (“blockbuster” drugs; over $4 billion in revenue) is greater on average than in the other categories.
Tabular results
The distribution of total (global) revenues and U.S. revenues alone is shown in Figure 1. DiMasi, Grabowski, and Hansen (2016) have provided a frequently cited (and much discussed) estimate of the R&D cost of a new drug brought to market in their study period (up to 2010) of about $2.6 billion in 2013 dollars. Applying their annual growth rate of 9% for clinical costs over the five-year period from 2013 to 2018, that estimate would have grown to about $4 billion. (We assume in this illustration that the drugs we studied would have launched as late as 2018, one year after FDA approval.) From this, we judge a drug to be on track to cover its R&D cost in our observation period if revenue exceeds a benchmark value of $2 billion.
Using the difference between actual revenue and this measure of R&D costs, only a minority of drugs in our sample are on track to be profitable— but there are a few blockbusters. Of the 22 drugs with revenues exceeding $2 billion, most (14) also had U.S. revenues that exceeded $2 billion. These drugs are ones whose U.S. revenues alone (without ROW contribution) would have made them profitable. Some analysts have proposed that only the U.S. market is relevant when firms plan R&D (Hooper and Henderson, 2022).
The count of 14 drugs is the minimum number of the 48 drugs that would have been available if ROW engaged in full free-riding. In reality, ROW revenue pushed 8 more drugs (for 22 in total) over the $2 billion threshold. Hence, we can view 8 (out of 48) as a lower bound on the number of drugs for which ROW contributions made a difference. Had drug firms planned R&D thinking only of U.S. market profitability, they would have dropped the 8 drugs that needed ROW revenue to push them over the top.
However, comparing realized revenues to a uniform R&D cost raises a serious conceptual question: why did investors and drug firms advance the remaining 26 drugs to market if they were sure to be unprofitable? The answer must be that the expected R&D cost associated with taking the drug forward was always less than the expected future revenues at each stage in the development process. Either expected revenues were higher than realized revenues, or, for those drugs whose expected revenues at some point fell below $2 billion, the expected additional R&D costs to take them forward from that point also fell below $2 billion. In what follows, we consider only the first scenario, although we note the possibility that over the course of development, a drug whose prospective revenues fell might still be continued if the incremental R&D costs to bring it to market also fell. Given how many drugs never make it to market or generate quasi-rents below the $2 billion mark, the distribution of expected revenues must be flatter than the distribution of ex post revenues. One way to account for that is to flatten the distribution of ex post revenues to represent a rough guide to expectations. Ex post, the expectations for the low-performing drugs were overly optimistic.
To implement this idea, we redistribute some of the excess revenue of the 22 profitable drugs back to the 26 drugs whose realized revenue fell short, and divide it between the U.S. and ROW by prorating it on the same basis as actual revenues. If we add $1 billion of overly optimistic forecasts to the actual revenues of the lower performing drugs, the additional revenue pushes 7 more drugs over the cost of R&D in the global market. Of those, 2 would have exceeded R&D cost based on U.S. revenues alone. Under this assumption about expectations, the difference that ROW-expected revenues made to the count of profitable drugs, compared to the count with U.S.-expected revenues only, is therefore 5 new drugs.
Summary. Subtracting revenues from ex post profitable drugs still leaves enough revenue for nearly all of them to be expected to be profitable. Adding this revenue to the drugs below the $2 billion R&D threshold pushes several into the range of positive expected profits. In most of these cases, expected ROW revenues would have made a difference.
Because the drugs for which expected profits mattered were by assumption ones with low actual revenues, the welfare loss if those profits were missing would be positive but not large. The 8 drugs (out of 48) that made the cut because of realized ROW profits are of moderate value, and would have been lost without those profits. Hence, positive profits that contributed to the public good (in contrast to complete free riding) in ROW did add to global welfare.
Finally, although we assumed that the 14 drugs covered entirely by U.S. profits would have been taken to market even without ROW contributions, it is theoretically possible that their development was threatened at some point and only continued because expected ROW revenues made up a shortfall in expected U.S. revenues — but, actual US revenues were higher than forecasted. While these are all high-value drugs, their loss without ROW, though consequential, seems unlikely. Hence, we conclude that ROW profits (compared to ROW payment limited to marginal cost) made a positive contribution to global welfare.
Regression analyses of cross-drug ROW contributions
In the analysis above, we simply used the distribution of revenues by source. Importantly, this showed that the ROW contributions were a higher percentage of world contributions for more successful drugs. To confirm that this finding is not due to confounding the revenue earned by a drug with its indication, we used multiple regressions to hold the possible confounding variables constant. One version classified drugs by the revenue intervals used in Figure 1. The regression results (Table 2) confirm the tabular and graphical results.
Table 2: Regression Coefficients for share of ROW contribution
| Dependent variable: | ROW share of 5-year revenue | Overall1 | |
| Model: | (1) | (2) | |
| Variables | |||
| Constant | 0.103*
(0.060) |
-0.116
(0.158) |
|
| Global revenue 1-2B | 0.049
(0.111) |
7 (14.6%) | |
| Global revenue 2-3B | 0.311
(0.185) |
2 (4.2%) | |
| Global revenue 3-4B | 0.104
(0.121) |
6 (12.5%) | |
| Global revenue 4B+ | 0.284**
(0.106) |
14 (29.2%) | |
| log(5-year global revenue) | 0.045*
(0.022) |
7.02 (2.02) | |
| Anti-infective | 0.208*
(0.109) |
0.239*
(0.120) |
6 (12.5%) |
| Cancer | 0.071
(0.125) |
0.091
(0.119) |
5 (10.4%) |
| Type 2 Diabetes Mellitus | 0.120
(0.145) |
0.227
(0.135) |
4 (8.3%) |
| Hepatitis C | 0.168
(0.112) |
0.197*
(0.109) |
7 (14.6%) |
| Fit statistics | |||
| Observations | 48 | 48 | |
| R2 | 0.364 | 0.283 | |
| Adjusted R2 | 0.234 | 0.197 | |
| c̅ | 0.287 | 0.287 | |
| *p<0.1; **p<0.05; ***p<0.01
1 Summary statistics: Mean (SD) for log(5-year global revenue); N (%) all else |
|||
The omitted category in the first regression is the smallest revenue cell, zero to $1 billion. The regression in column 2 uses a log transformation of the total revenue for each drug. Results from column 1 indicate that drugs in the “blockbuster” category with over $4 billion in total five-year revenue had significantly higher ROW shares than nearly all lower total revenue categories. That is, ROW spending was directed not at drugs that needed help to be profitable, but rather to drugs that were established bestsellers. On average, compared with drugs in the lowest revenue category, blockbuster ROW share was nearly 30% greater. The second regression in column 2 using log-transformed total revenue also demonstrates a significant, positive relationship between total revenue and ROW contribution. Drug characteristics associated with higher ROW were anti-infectives (both regressions) and hepatitis C drugs (second regression). We have no theory as to why authorities in ROW would have favored such drugs, but there may have been political pressure to foster them.
Discussion
If low realized revenue is correlated with low expected revenue, these results are not strong evidence of governmental authorities in ROW systematically increasing a large share of their contribution to profits for drugs whose U.S. revenues would fall short of expected R&D costs. These findings, therefore, are not consistent with either of the global public goods voluntary contribution models (the alliance model or the foresight sharing model). Nor are they consistent with the full free-rider model advanced by the Council of Economic Advisors (2018) and Hooper and Henderson (2022). They are most plausibly linked to the myopic bargaining model, in which drug firms with some global market power obtain some contributions toward short-run profits from authorities in at least some countries worldwide. If firms considering investing in new drugs expect to exercise similar leverage for successful research efforts, then the supply of new drugs will be larger than the suboptimal U.S.-only Nash equilibrium.
Optimality. Suppose we assume that the actual U.S. contribution to the global public good is the optimal contribution. (Though in reality, current U.S. contribution is likely a lower bound, for reasons to be discussed below.) If ROW contribution were also optimal in that sense, what would it be? To answer this question, we must adjust the ROW contribution based on U.S. values of population and income per capita. ROW population is larger than the U.S. population, but its average income or GDP per capita is lower. With some strong simplifying assumptions, we can ballpark roughly where the optimal world contribution would be and, therefore, how far the current situation is from that optimum.
The U.S. population in 2021 was 332 million, and the population of the rest of the OECD was 1.044 billion, for a total of 1.376 billion (OECD, 2023). Thus, the U.S. population share of the total is 0.241. Additionally, estimates from Frech et al. 2023 show that the U.S. contributed 72% of the total world contribution (for MC = 0.24 U.S. prices).
Let us therefore make the simplifying assumption that the U.S. contribution at the global optimum would be the same as it is now. This amounts to ignoring the income effect of other countries’ contributions on U.S. contributions. Further assume that, at the optimum, ROW countries would contribute the same relative amount as the U.S., scaled down for lower GDP.[1] Since the ROW GDP per capita is about half as high as that of the US (World Bank, 2023), we divide the U.S. per capita contribution (from Frech et al. 2023) by 2 and multiply by the ROW population. This gives us our estimate that ROW countries’ contribution should be $461.47B, while the U.S. contribution would be unchanged at $289.17 billion. Thus, the optimal total world contribution would be $750 billion, nearly double (1.88 times) the current total world contribution.
While this estimate is rough and should not be taken literally, this calculation suggests that the current world system’s contribution to the global public good of new drug R&D is below the optimum. If the U.S, contribution is held constant, ROW should contribute about twice what it does now.
Nevertheless, the U.S. contribution to profits, large as it is relative to ROW, may be thought to fall well below the marginal value to American consumers alone for a new drug (Hall and Jones, 2007). In theory, a monopolist who cannot price discriminate cannot capture all of the consumer surplus from a product (only 2/3 of it if demand is linear). In reality, the extent of capture (“appropriability” in the literature on innovation) appears to be far less (Frech, Pauly, Comanor and Martinez 2022; Philipson and Jena, 2006). Further, the high prices of new patented drugs are only temporary. It therefore seems that underinvestment in R&D as a public good is suboptimal across the globe – not just due to the behavior of ROW. In fact, Nordhaus has found low levels of appropriability across the economy (2004).
When considering drug R&D, part of the problem is that, from available data, we cannot identify the unresearched and undeveloped foregone drugs, nor how much benefit they would bring in terms of additional health attained relative to the cost of moving them through FDA approval to market. The fact that some drugs in our sample were FDA approved but may have never launched, or had failed launches, suggests how imprecise the process can be. Further work on the drug pipeline — for example, identifying drugs that were developed up to a point and then canceled because they were expected to just miss profitability targets — would be helpful.
Footnote
[1] As mentioned above, scaling by GDP for the value of health, e.g. the value of a statistically life, is roughly supported by empirical work and is often done in practice.
References
BioMedTracker. Accessed March 8, 2023. https://www.biomedtracker.com/.
DiMasi, Joseph A., Henry G. Grabowski, and Ronald W. Hansen, “Innovation in the Pharmaceutical Industry: New Estimates of R&D Costs.” Journal of Health Economics, vol. 47 (2016): 20-33. doi: 10.1016/j.jhealeco.2016.01.012.
Kyle, Margaret K. “Pharmaceutical Price Controls and Entry Strategies.” The Review of Economics and Statistics 89, no. 1 (2007): 88-99. doi: https://doi.org/10.1162/rest.89.1.88.
Frech, H.E., III, Mark V. Pauly, William S. Comanor and Joseph R. Martinez, “Costs and Benefits of Branded Drugs: Insights from Cost-Effectiveness Research,” Journal of Benefit-Cost Analysis 13(2) (2022); 116-181.
Frech, H.E., III, Mark V. Pauly, William S. Comanor and Joseph R. Martinez, “Pharmaceutical Pricing and R&D as a Global Public Good,” Working Paper (2023)
Grabowski, Henry G., and John M. Vernon. “Returns to R&D on New Drug Introductions in the 1980s.” Journal of Health Economics 13, no. 4 (1994): 383-406. doi: 10.1016/0167-6296(94)90010-8. PMID: 10140531.
Hall, Robert E., and Charles I. Jones. “The Value of Life and the Rise in Health Spending.” The Quarterly Journal of Economics 122, no. 1 (2007): 39-72. https://doi.org/10.1162/qjec.122.1.39.
Hooper, Charles A. and David Henderson. “Expensive Medications Are a Bargain.” Wall Street Journal, November 14, 2022. Accessed March 8, 2023. https://www.wsj.com/articles/expensive-medications-are-a-bargain-drug-cost-expense-inflation-reduction-act-brand-name-pharmaceutical-treatments-11663080540.
Lakdawalla, Darius N., Dana P. Goldman, Pierre-Carl Michaud, Neeraj Sood, Richard Lempert, Zhun Cong, Heather de Vries, and Itziar Gutierrez. “U.S. Pharmaceutical Policy in a Global Marketplace.” Health Affairs (Millwood) 28, no. 1 (2009): w138-w150. doi: 10.1377/hlthaff.28.1.w138. Epub 2008 Dec 16. PMID: 19088101; PMCID: PMC3804349.
Mulcahy, Andrew W., Christopher Whaley, Mahlet G. Tebeka, Daniel Schwam, Nathaniel Edenfield, and Alejandro U. Becerra-Ornelas. International Prescription Drug Price Comparisons: Current Empirical Estimates and Comparisons with Previous Studies. Rand Research Report, 2021.
Nordhaus, William D., “Schumpeterian Profits in the American Economy: Theory and Measurement,” NBER Working Paper 10433 (April, 2004).
OECD. “Population.” Accessed March 8, 2023. https://data.oecd.org/pop/population.htm.
Pharma Intelligence. 2023. Biomedtracker. Available online at: https://www.biomedtracker.com
Philipson, Tomas and Anupam B. Jena. “Who Benefits from New Medical Technologies? Estimates of Consumer and Producer Surpluses for HIV/AIDS Drugs.” Forum for Health Economics & Policy 9, no. 3 (2006): 1-33.
Tay-Teo, Kiu, Andre Ilbawi, and Suzanne R. Hill. Comparison of Sales Income and Research and Development Costs for FDA-Approved Cancer Drugs Sold by Originator Drug Companies. JAMA Network Open. 2019;2(1):e186875. doi: 10.1001/jamanetworkopen.2018.6875
US Council of Economic Advisors. “Reforming Biopharmaceutical Pricing at Home and Abroad.” White Paper, February 2018. Accessed March 8, 2023. https://trumpwhitehouse.archives.gov/wp-content/uploads/2017/11/CEA-Rx-White-Paper-Final2.pdf.
U.S. Food and Drug Administration. “New Drugs @ FDA: CDER’s New Molecular Entities and New Therapeutic Biological Products.” Updated January 27, 2022. Accessed March 8, 2023. https://www.fda.gov/drugs/development-approval-process-drugs/new-drugs-fda-cders-new-molecular-entities-and-new-therapeutic-biological-products.
Wouters, Olivier, et al. “Association of Research and Development Investment with treatment Costs for New Drugs Approved from 2009 to 2018,” JAMA Network Open 2022;5(9):e2218623. doi:10.1001/jamanetworkopen.2022.18623.
World Bank. “GDP per capita, current US dollars.” Accessed March 8, 2023. https://data.worldbank.org/indicator/NY.GDP.PCAP.CD?locations=OE&name_desc=false.
Footnote
[1] As mentioned above, scaling by GDP for the value of health, e.g. the value of a statistically life, is roughly supported by empirical work and is often done in practice.