Tanner Dane Pulice, Stanford University, and Kevin Schulman, Division of Hospital Medicine, Stanford University School of Medicine and Graduate School of Business, Stanford University
Contact: kevin.schulman@stanford.edu
Abstract
Abstract
What is the message? CAR-T cancer therapies represent a transformative advancement in oncology, yet their pricing trajectory reveals a concerning pattern of rising costs that are disconnected from market expansion or patient access. This study argues that supply side moral hazard, where manufacturers take advantage of insurance coverage and patient price insensitivity, has led to persistently high launch prices and steady year-over-year increases in wholesale acquisition costs (WAC). These trends are setting unsustainable precedents for future advanced therapeutics.
What is the evidence? An analysis of peer reviewed research, government data sources, and industry pricing reports.
Timeline: Submitted: August 1, 2025; accepted after review: October 25, 2025.
Cite as: Tanner Dane Pulice, Kevin Schulman. 2026. CAR-T Therapy: Escalating Costs in an Expanding Market. Health Management, Policy and Innovation (www.HMPI.org). Volume 11, Issue 1.
Introduction
Chimeric antigen receptor (CAR) T-cell therapy is a novel form of cancer immunotherapy that engineers a patient’s own T cells to recognize and kill cancer cells. It is primarily used when standard treatments have failed, particularly in advanced blood cancers such as lymphomas, leukemia, and multiple myeloma.1,2 The first CAR T-cell therapy, tisagenlecleucel, was approved by the FDA in 2017 for the treatment of B-cell acute lymphoblastic leukemia (B-ALL).3 Upon its release, the therapy was priced at $475,000 (Table 1), significantly exceeding the already elevated median launch price of oncology drugs in the United States, which stood at approximately $155,000 USD.4 Although CAR-T therapies have demonstrated substantial clinical benefit,5,6 the aggressive pricing strategy for this category of products has received limited evaluation. This study investigates trends in wholesale acquisition cost (WAC) of six FDA approved CAR-T therapies over time with the goal of assessing how pricing dynamics may be evolving for this category. Our objective is to evaluate the financial burden on payers, and we posit that supply-side moral hazard plays a central role in the year-over-year escalation of CAR-T therapy prices.
Methods
Dataset
We analyzed six FDA-approved CAR T-cell therapies: Yescarta, Tecartus, Carvykti, Abecma, Breyanzi, and Kymriah. Wholesale acquisition cost (WAC) data were obtained from multiple sources. The most recent data (2025) were drawn from Micromedex Red Book, while earlier values were compiled from publicly available pharmaceutical pricing databases, manufacturer disclosures, and peer-reviewed literature.7-13 WAC reflects the list price in the United States and excludes discounts, rebates, or outcome-based payment adjustments. Pricing data were collected at launch and annually from 2022 through 2025. Global market size was sourced from a March 2025 CAR-T market report published by BCC Research.14 Market size was initially defined as total global sales revenue (in millions of U.S. dollars) for each product in 2022, 2023, and 2024. We converted these revenue values into estimated patient counts by dividing annual global revenue by the corresponding WAC for that year (i.e., market size = revenue ÷ price). To estimate market size at launch, we applied a 30% compound annual growth rate (CAGR) to back-calculate from observed 2024 patient counts, adjusting for the number of years since each therapy’s launch.15,16,17 All monetary values were reported in nominal terms without inflation adjustment.
Statistical Analysis
To examine pricing trends in the CAR-T therapy market, we conducted two regression analyses. The first assessed whether a therapy’s initial launch price predicts its future pricing trajectory by regressing each product’s 2025 wholesale acquisition cost (WAC) on its original launch WAC. The second evaluated whether a product’s launch price is associated with its estimated global market size at launch. In addition, we calculated the compound annual growth rate (CAGR) for each therapy using the launch WAC and current 2025 WAC as endpoints.
Results
WAC prices are listed in Table 1 for the six products for the year of the product release and for the period 2022-2024. From these data, we can see that the launch price ranged from $373,000 to $475,000 for these products over the period of 2017-2022. If we consider the launch price of Kymriah as an outlier, other products were priced so that the newest product had a higher launch price than the existing products in the market.
Table 1. Pricing and market trends for six FDA-approved CAR-T therapies
Launch date, wholesale acquisition cost (WAC) from launch through 2025, compound annual growth rate (CAGR), and global market size from launch through 2024 are reported for each therapy. WAC values are listed in USD and reflect pricing trends over time. Market size refers to the estimated number of treated patients globally. CAGR is calculated based on WAC from 2022 to 2025.
| Therapy | Generic Name | Market Date | WAC (Launch) | WAC (2022) | WAC (2023) | WAC (2024) | WAC (2025) | CAGR | Global Market Size (Launch) | Global Market Size 2022 | Global Market Size 2023 | Global Market Size 2024 |
| Kymriah | Tisagenlecleucel | 08/30/2017 | $475,000 | $475,000 | $543,828 | $582,000 | $593,533 | 3.08% | 135 | 1,128 | 934 | 849 |
| Yescarta | Axicabtagene ciloleucel | 10/18/2017 | $373,000 | $399,000 | $424,000 | $462,000 | $503,580 | 6.32% | 626 | 2,907 | 3,538 | 3,929 |
| Tecartus | Brexucabtagene autoleucel | 07/24/2020 | $373,000 | $399,000 | $424,000 | $462,000 | $462,000 | 4.94% | 494 | 749 | 873 | 1,410 |
| Breyanzi | Lisocabtagene maraleucel | 02/05/2021 | $410,300 | $410,300 | $447,227 | $487,477 | $531,350 | 6.85% | 476 | 444 | 814 | 1,045 |
| Abecma | Idecabtagene vicleucel | 03/26/2021 | $419,500 | $419,500 | $457,255 | $498,408 | $528,312 | 6.31% | 595 | 925 | 1,032 | 1,307 |
| Carvykti | Ciltacabtagene autoleucel | 02/28/2022 | $465,000 | $465,000 | $465,000 | $487,477 | $555,310 | 3.30% | 286 | 286 | 1,075 | 1,456 |
Furthermore, across all products, the CAGR for WAC ranged from approximately 3% to 7%. We find that WAC is a strong predictor of future pricing for CAR-T therapies. A linear regression of 2025 WAC on launch WAC yields a statistically significant relationship (p < 0.01) as shown in Figure 1.
Figure 1: Relationship between launch WAC and projected 2025 WAC for six FDA-approved CAR-T therapies
A scatterplot with linear regression line illustrates the association between launch wholesale acquisition cost (WAC) and 2025 WAC (USD) by brand. Each point represents a therapy, color-coded by brand. The trend line indicates that higher launch prices are associated with higher 2025 WAC.
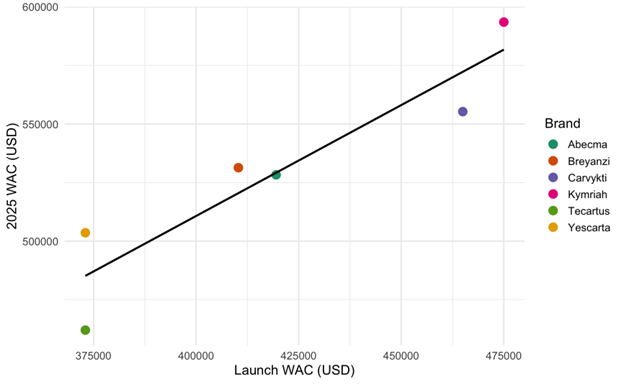
P-value < 0.01
Furthermore, market size for these therapies ranged from 286 to 3,929 patients between 2022 and 2024. Using back-calculated estimates of market size at launch, our second regression showed that launch WAC is significantly negatively associated with estimated launch market size (p = 0.03), as illustrated in Figure 2. For example, Kymriah launched with the highest WAC ($475,000) and had the smallest estimated launch market size (135 patients), while Yescarta, priced lower at $373,000, had a substantially larger estimated launch market size (626 patients).
Figure 2: Estimated launch market size vs. launch WAC for six FDA-approved CAR-T therapies
Each point represents a therapy, with launch wholesale acquisition cost (WAC) on the x-axis and estimated number of patients treated at launch on the y-axis. The line shows a negative linear relationship, suggesting that therapies with higher launch prices tended to have smaller initial market sizes. WAC values are in USD; market size is estimated in number of patients.
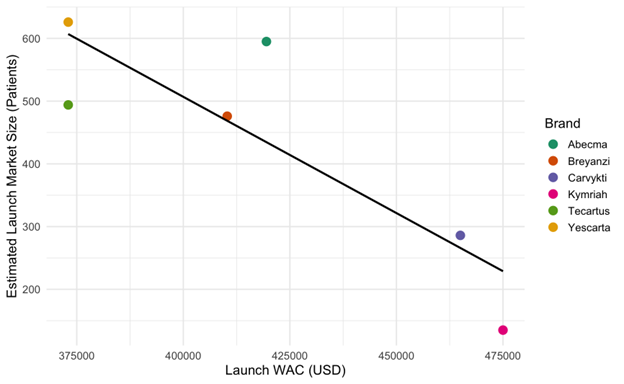
P-value = 0.03
Discussion
Our study provides interesting descriptive and temporal data on the CAR-T market in the United States. We observe that sponsors adopted aggressive pricing strategies at launch, with later entrants generally setting higher launch prices than their predecessors. Notably, we find an interesting negative relationship between launch price and market size consistent with a hypothesis that launch price is associated with revenue expectation for a product.18
This descriptive analysis offers information that is not considered in economic evaluation. While some studies suggest that CAR-T therapies may be cost-effective under specific conditions,18,19 a therapy offers better value for money at a lower price, even if it meets cost-effectiveness thresholds at a base case. Existing analyses already yield conflicting results, with estimated incremental cost-effectiveness ratios (ICERs) in adults ranging from $10,000 to over $4 million per quality-adjusted life year (QALY).20 Moreover, cost-effectiveness is not an assessment of budget impact from therapies.21
WAC prices serve as the base acquisition price for hospitals, less any discounts provided by manufacturers (for hospital outpatient setting, the price after discounts is called the average sales price or ASP). WAC prices can also serve as the basis for pricing at the provider level. In 2022, hospitals received payments from private insurers averaging 254% of Medicare prices for hospital care and 281% of ASP for hospital outpatient infusion therapies.22
Supply-side moral hazard refers to the influence of insurance coverage on a sponsor’s pricing strategy.23 When patients are insulated from treatment costs by insurance, manufacturers such as those producing CAR-T therapies can adopt more aggressive launch pricing. In the current U.S. market environment, there is limited downward pressure on manufacturers setting these unprecedented prices.24 In oncology, this dynamic is amplified. Patients facing life-threatening diagnoses are often emotionally vulnerable and price-insensitive, factors which further reduce market resistance to high treatment costs.25 Overall, manufacturers and hospitals face perverse incentives in setting prices for these products. CAR-T therapies may now serve as a pricing precedent for future advanced therapeutics, raising broader questions about affordability, value, and sustainability in innovation.
References
- Neelapu SS, Locke FL, Bartlett NL, et al. Axicabtagene Ciloleucel CAR T-Cell Therapy in Refractory Large B-Cell Lymphoma. New England Journal of Medicine. 2017;377(26):2531-2544. doi:https://doi.org/10.1056/nejmoa1707447
- Hansen DK, Sidana S, Peres LC, et al. Idecabtagene Vicleucel for Relapsed/Refractory Multiple Myeloma: Real-World Experience From the Myeloma CAR T Consortium. Journal of Clinical Oncology. 2023;41(11). doi:https://doi.org/10.1200/jco.22.01365
- Mullard A. FDA approves first CAR T therapy. Nature Reviews Drug Discovery. 2017;16(10):669. doi:https://doi.org/10.1038/nrd.2017.196
- Rome BN, Egilman AC, Kesselheim AS. Trends in Prescription Drug Launch Prices, 2008-2021. JAMA. 2022;327(21):2145. doi:https://doi.org/10.1001/jama.2022.5542
- Westin J, Sehn LH. CAR T cells as a second-line therapy for large B-cell lymphoma: a paradigm shift? Blood. 2022;139(18):2737-2746. doi:https://doi.org/10.1182/blood.2022015789
- Melenhorst JJ, Chen GM, Wang M, et al. Decade-long leukaemia remissions with persistence of CD4+ CAR T cells. Nature. 2022;602(7897):503-509. doi:https://doi.org/10.1038/s41586-021-04390-6
- Missouri Department of Social Services. SmartPA Criteria Proposal. Published June 16, 2022. https://dss.mo.gov/mhd/cs/advisory/drugpa/pdf/061622/CAR-TCell.pdf
- Scheffer ER, Kelkar AH, Russler-Germain DA, et al. High Cost of Chimeric Antigen Receptor T-Cells: Challenges and Solutions. American Society of Clinical Oncology Educational Book. 2023;43(43). doi:https://doi.org/10.1200/edbk_397912
- Drug Price Increase Reporting. Ny.gov. Published November 29, 2024. Accessed July 30, 2025. https://www.dfs.ny.gov/consumers/healthcare/drug-prices/reporting-202411
- The Medical Letter, Inc. In Brief: Obecabtagene Autoleucel (Aucatzyl) – Another CAR-T Cell Immunotherapy for ALL (online only) | The Medical Letter Inc. Medicalletter.org. Published December 23, 2024. https://secure.medicalletter.org/TML-article-1718f
- AcariaHealth. Pipeline Report: July 2024. Published July 2024. https://www.acariahealth.com/content/dam/centene/acariahealth/publications/pipeline—july-2024/AH%20Pipeline%20Q324.pdf
- Department of Consumer and Business Services. Prescription Drug Price Transparency Results and Recommendations – 2020 . Published 2020. https://dfr.oregon.gov/drugtransparency/Documents/Prescription-Drug-Price-Transparency-Annual-Report-2020.pdf
- Conduent Business Services, LLC. New Drug Fact Blast. Published 2021. https://dss.mo.gov/mhd/cs/advisory/rdac/pdf/abecma-idecabtagene-vicleucel-ndfb_mo.pdf
- BCC Research. Current Research and Development Status of Chimeric Antigen Receptor (CAR) T-Cell Therapy Market. Bccresearch.com. Published March 25, 2025. Accessed July 30, 2025. https://academic.bccresearch.com/market-research/biotechnology/chimeric-antigen-receptor-car-t-cell-therapy-market-report.html
- CAR-T Cell Therapy Market – Global Industry Analysis and Forecast (2025-2032). MAXIMIZE MARKET RESEARCH. Published April 16, 2025. Accessed July 30, 2025. https://www.maximizemarketresearch.com/market-report/global-car-t-cell-therapy-market/98045/
- Research and Markets. Global CAR-T Therapy Market Report 2020: Market is Expected to Stabilize and Reach $3,150 Million in 2025 – COVID-19 Impact and Recovery Forecast to 2030. Prnewswire.com. Published February 2021. Accessed July 30, 2025. https://www.prnewswire.com/news-releases/global-car-t-therapy-market-report-2020-market-is-expected-to-stabilize-and-reach-3-150-million-in-2025—covid-19-impact-and-recovery-forecast-to-2030–301218802.html
- Marketsandata. CAR T-cell Therapy Market Size, Share, Growth & Demand Forecast 2032. Markets and Data. Published 2018. Accessed July 30, 2025. https://www.marketsandata.com/industry-reports/car-t-cell-therapy-market
- Trusheim MR, Berndt ER, Douglas FL. Stratified medicine: strategic and economic implications of combining drugs and clinical biomarkers. Nature Reviews Drug Discovery. 2007;6(4):287-293. doi:https://doi.org/10.1038/nrd2251
- Petrou P. Is it a Chimera? A systematic review of the economic evaluations of CAR-T cell therapy. Expert Review of Pharmacoeconomics & Outcomes Research. 2019;19(5):529-536. doi:https://doi.org/10.1080/14737167.2019.1651646
- Petrou P. Is it a chimera? A systematic review of the economic evaluations of CAR-T cell therapy – an update. Expert Review of Pharmacoeconomics & Outcomes Research. 2023;23(6):625-650. doi:https://doi.org/10.1080/14737167.2023.2214731
- Thavorn K, Thompson ER, Kumar S, et al. Economic Evaluations of Chimeric Antigen Receptor T-Cell Therapies for Hematologic and Solid Malignancies: A Systematic Review. Value in Health: The Journal of the International Society for Pharmacoeconomics and Outcomes Research. Published online April 17, 2024:S1098-3015(24)023362. doi:https://doi.org/10.1016/j.jval.2024.04.004
- Whaley CM, Kerber R, Wang D, Kofner A. Briscombe B. Prices Paid to Hospitals by Private Health Plans: Findings from Round 5.1 of an Employer-Led Transparency Initiative. Rand Research Report RR-A1144-2-v2. Published Dec 10, 2024. https://www.rand.org/pubs/research_reports/RRA1144-2-v2.html
- Mark DB, Schulman KA. PCSK9 Inhibitors and the Choice Between Innovation, Efficiency, and Affordability. JAMA. 2017;318(8):711. doi:https://doi.org/10.1001/jama.2017.8907
- Schulman K. The Supply-Side Effects of Moral Hazard on Drug Prices. HMPI. Published October 14, 2018. https://hmpi.org/2018/10/14/the-supply-side-effects-of-moral-hazard-on-drug-prices/
- 25. Patel MI, Riley A, Newcomer L, Schulman K. The Price Is NOT Right: Payers’ Roles in Addressing Financial Toxicity. JCO Oncology Practice. 2025;21(1):100-102. doi:https://doi.org/10