Gabriel M. Knight, BA, Northwestern University Feinberg School of Medicine; Kevin Schulman, MD, Arnold Milstein, MD, MPH, Clinical Excellence Research Center, Stanford University School of Medicine; Sheridan Rea, BS; Giovanni Malloy, BS; Usman Khaliq, BEng; David Scheinker, PhD, Stanford University School of Engineering
Abstract
Contact: David Scheinker dscheink@stanford.edu
Cite as: Gabriel M. Knight, Kevin Schulman, Arnold Milstein, Sheridan Rea, Giovanni Malloy, Usman Khaliq, David Scheinker. 2019. A Transparent, Mathematical Model to Evaluate Proposals for Healthcare Reform. Health Management Policy and Innovation, Volume 4, Issue 3.
The U.S. Needs Transparent, Mathematical, Prospective Analyses of Policy Proposals
The United States spends nearly twice as much as other high-income countries on healthcare despite similar utilization rates and access to fewer services. [1] American health expenditures are expected to continue to increase by an average of 5.8 percent annually through at least 2024 if current laws and practices persist. [1–3] Moreover, the cost of healthcare, whether preventive services or the treatment of illness, profoundly impacts nearly every American’s life, making the issues of healthcare costs and access a deeply personal and often emotional subject of discussion. There is significant intellectual debate about efforts to reform and restructure the healthcare system in the country.
We suggest that the current healthcare policy debate would be less partisan and more effective if there were a means to separate questions of principle from technical implementation. Issues of principle in the debate include whether access to healthcare is a right or whether it is a discretionary consumer service; where the appropriate boundary between personal responsibility and social support lies; and how society should allocate healthcare resources to those with and without means. Clearly, these issues engender personal, passionate debate.
The issues of technical implementation include quality, efficiency, and cost; current and proposed incentives; the timeline of implementation; and other economic considerations. These are technical issues that engender much less passionate response on the part of the public—though experts may still have passionate disagreements about some of these factors. Developing a public, transparent model could force health policy analysts to discuss the technical aspects of policy proposals early, so that when policy proposals are released to the public, there would be less conflation of principle and technical arguments.
The nonpartisan Congressional Budget Office (CBO) produces a detailed quantitative report estimating the impact of proposed legislation. However, the models used by CBO are often not broadly available for outside interrogation or modification. Furthermore, while the CBO is a nonpartisan support arm of the United States Congress, some parameters of their models do reflect political influence, as was the case, for instance, in the debate over dynamic modeling of the 2017 tax cuts. [4]
Many proposed health policies can be readily parameterized, including reimbursement rates, the start and duration of the implementation period, and the subset of the industry to which various provisions apply. Modern data simulation and visualization technology make it possible to create relatively simple, flexible models suitable for simulating a large range of policy proposals and economic scenarios. If even a fraction of the debate around healthcare reform involved elements of shared models, the public could become more engaged in the discussion.
We propose a real-time simulation and visualization model to guide and assess basic structural questions underlying healthcare policy. We illustrate the idea of how such a tool may function by drawing on a recently published paper describing a proposed version of Medicare for All (MFA). [5-8] The attention paid to this proposal suggests it is an interesting example to explore.
This essay has three goals. We first describe three properties of a good health policy model. Second, we catalog sources of data. Third, we develop a simple proof-of-concept version of the MFA tool and explore basic questions about this proposed policy.
Parameterizing Health Policy: An Illustration Using Variants of “Medicare for All” (MFA)
Properties of a useful policy simulation tool
A useful policy simulation model has three characteristics. First, the model must illustrate policies through an easy-to-use visual interface. While no useful tool can simulate all healthcare reform policies, users could consider the high-level components of many proposals as dynamic parameters. Second, it should incorporate values and parameters for which evidence is uncontroversial, such as the number of hospitals in the U.S. and the revenue of each hospital. For the values and parameters for which no consensus exists, such as the time needed to adopt a reform or changes in efficiency that result from the reform, the model must allow dynamic manipulation. Third, the model should be transparent, so that people interested in testing other policies or assumptions can modify it. This is necessary to address criticisms such as “the model fails to account for these phenomena.”
Feasibility: Data sources
Several public and private sources provide data for the model we propose. Data on payments (private, public, out-of-pocket) and costs (e.g., labor, supply, infrastructure, subsidies) broken down by hospital are necessary to model how reforms affect hospitals and systems across different entity types (e.g., academic versus community, nonprofit versus for-profit) and locations (e.g., regions, states, urban vs rural). Below we describe which data are available and which, if made available through policy changes or research, would help create the model.
First consider cost versus payment data. Data on costs for hospitals and providers is more readily available than data on payments—particularly prices paid by private insurers, which involve high price variation and little transparency. Cost data are available from the Centers for Medicare & Medicaid Services (CMS) Hospital Cost Report, which contains total costs for hospitals for fiscal years 2014–2017. [9] Additionally, the CMS Market Basket dataset, which is a hospital input price index, reflects price inflation facing providers of medical services.
Despite the limits of existing payment data, payments by specific hospitals or groups of hospitals could be estimated using data sources such as the CMS Case Mix File Hospital Inpatient Prospective Payment System. This file contains hospitals’ case mix indices, representing the average diagnosis-related group relative weight for that hospital, as well as the number of cases at the hospital for 2014–2017. [10] This data could then be multiplied by payer mixes for individual hospitals, which exist in Definitive Healthcare’s Essential Data on Hospitals and IDNs database. [11] This, in turn, could be multiplied by approximate reimbursement rates as a percentage of the Medicare reimbursement rate for specific payer mixes or diagnosis-related groups. The Medicare reimbursement rate could be estimated using the CMS Physician Fee Schedule as well as recently published data about average disparities between Medicare and private reimbursements for different procedure types. [5,12]
To the best of our knowledge, detailed datasets reporting payments and reimbursement rates associated with individual hospitals and systems do not exist. Future efforts should create this information. A recently proposed rule from the Department of Health and Human Services would require hospitals publish the prices that they charge private insurers, which would facilitate the analyses we propose. [13]
Subsidy data has mixed availability. Estimates exist regarding total dollars associated with some subsidy programs, such as the 340B drug pricing program and Disproportionate Share Hospital payments for hospitals that serve relatively large numbers of Medicaid and uninsured individuals. [14–16] However, we lack granular data on subsidies and other savings afforded to certain centers of care. Fortunately, because subsidies represent a small fraction of healthcare spending, this has limited impact on the power of the model.
Additional data about hospital characteristics will be needed to allow users to explore how certain reforms might affect different types of hospitals. For example, to filter key demographic information, U.S. Census data could be cross-walked with zip codes, cities, or other localizing data associated with which patients visit which hospitals. The type of entity (e.g., academic versus community, nonprofit versus for-profit) could be obtained from Definitive Healthcare’s Essential Data on Hospitals and IDNs database. [11] For users interested in evaluating how reforms will affect locales associated with different health outcomes, data could be extracted from Robert Wood Johnson Foundation County Health Rankings data. [17] Similar approaches could be applied to many other factors.
Ultimately, a trustworthy simulation model should move beyond dollars to forecast impact on all six aims of healthcare that the Institute of Medicine’s famous “Crossing the Quality Chasm” report highlights. [18] To achieve this, we will need access to electronic health record data as well as key patient-reported outcomes such as patient experience. While our proposed model focuses on economic and operational effects, it could serve as the foundation for a more comprehensive effort.
A simple proof of concept: Exploring variants of “Medicare for All”
The focus of our MFA model is the impact of reimbursement changes on hospital financial and performance. We consider both sources of funds, including insurance payments and other payments and subsidies, as well as uses of funds, including property, plant and equipment, labor, and medications and supplies. Costs were further divided into variable costs and committed cost. [24] To allow the user to simulate variants of the MFA proposal by Schulman and Milstein, [5] we used modifiable parameters of: the duration of the transition period to the new payment model, the policy payment rate as a percentage of Medicare payment rates, and changes in hospital productivity in response to a policy change. We discuss these in more detail below.
Measurement Parameters
Policy parameters
- Reimbursement rate as percent of Medicare prices. In the proposed MFA policy, the reimbursement rate is set, implicitly, to 100 percent. One may readily imagine policies that set all private prices to a higher percentage of Medicare prices. For example, in her proposed MFA plan, Senator Elizabeth Warren has argued in favor of setting reimbursements to 110 percent of the current Medicare rate. [19]
- The start and duration of the implementation period. Schulman et al.’s proposal explored the hypothetical change if the policy was implemented from one year to the next. [5] In practice, a transition would likely be set to start several years in the future and phase in over several more years.
- The rate at which reimbursement changes over the years of the implementation period. This rate is partly determined by the total reimbursement change and the duration of the implementation period.
- The sizes and characteristics of hospitals to which various versions of the policy apply. While the original proposal grouped all hospitals together, different MFA proposals would likely apply differently across categories of hospitals such as critical-access hospitals.
Impact parameters
- The rate at which hospitals improve efficiency in response. The premise of the original proposal, supported by empirical evidence, is that hospitals would respond to price pressure by reducing costs. Though the original proposal did not explore this explicitly, a simulation model could incorporate this as a parameter.
- The rate at which hospitals convert revenue shortfalls into full-time equivalent (FTE) reductions. The original paper calculated the number of FTEs hospitals would have to reduce to offset the entire projected revenue shortfall associated with a transition to MFA. In practice, hospitals would likely find a variety of ways to respond to revenue shortfalls. For example, price pressure might force hospitals to increase FTEs in areas associated with productivity improvement.
Calculated outcomes
- The costs and revenues of each hospital in each year.
- Total healthcare spending at the national and local levels.
- The change in the number of FTEs and the corresponding job creation and losses across various parts of the country.
Figures
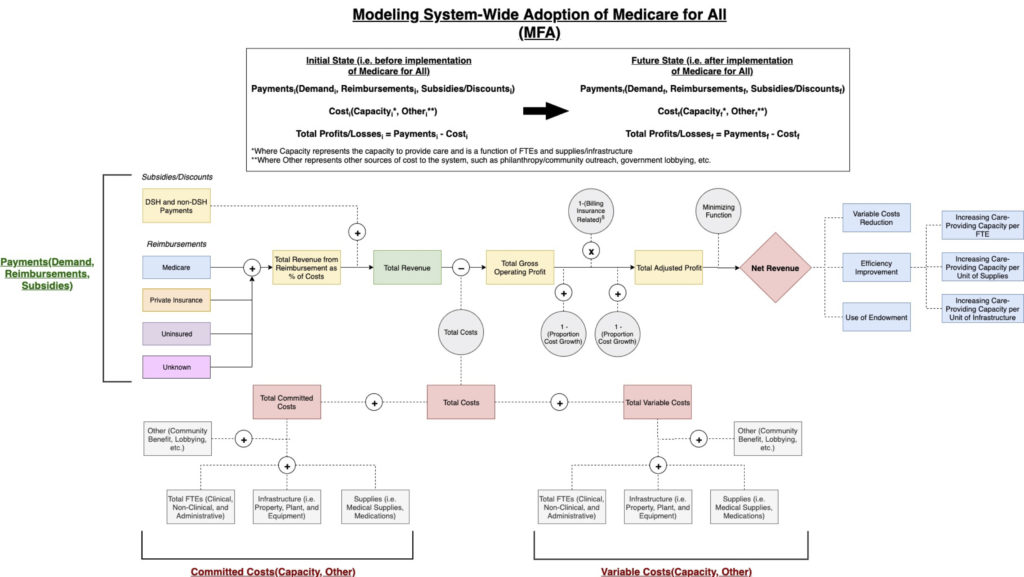
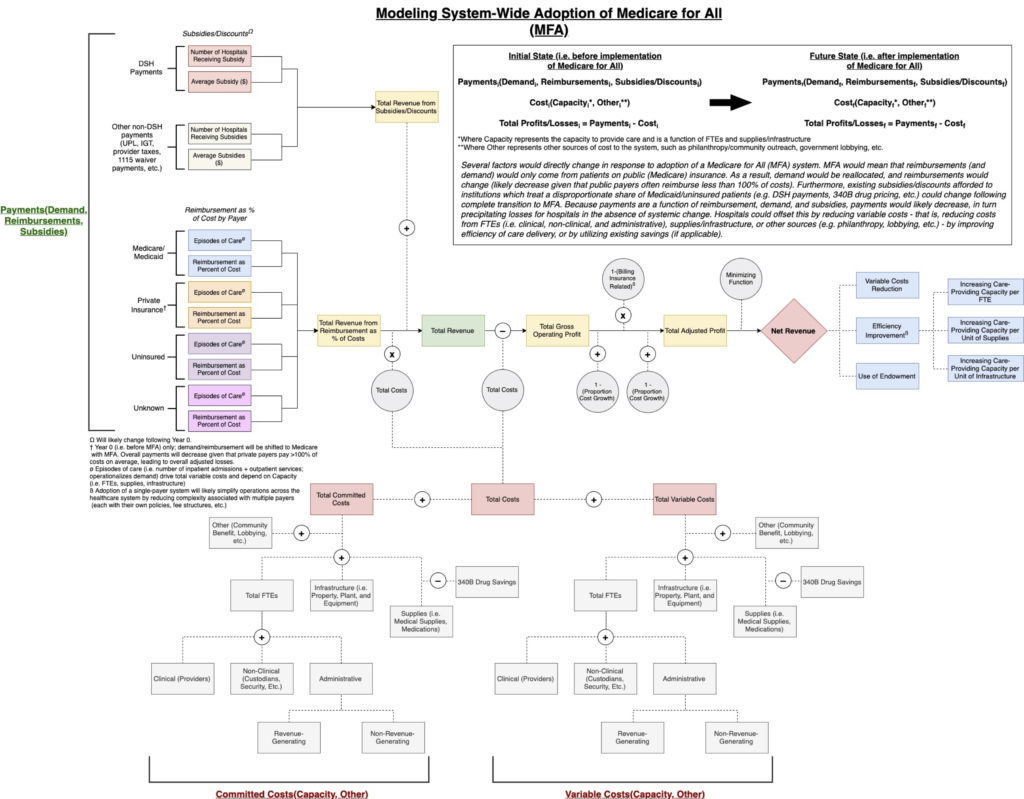
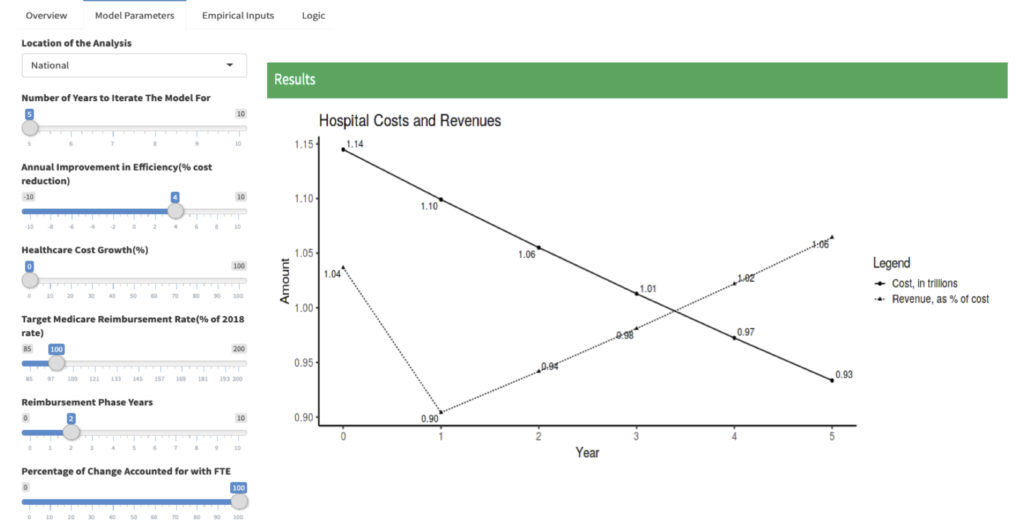
Several figures depict the core ideas. Figure 1 provides a schematic illustrating the logic underpinning a proof-of-concept framework for adoption of MFA. Figure 2 is a more detailed logic diagram. Figure 3 offers a sample data visualization of the model output. In the model, users can modulate: (1) the number of years for which to iterate the model; (2) annual efficiency improvement (i.e., % cost reduction) in response to reform; (3) annual healthcare cost growth; (4) target Medicare reimbursement rate (as a percentage of the 2018 rate); (5) years needed to fully phase in reform and accompanying reimbursement models; and (6) percentage of change in hospital revenue addressed by FTE changes. For this proof-of-concept, we have set values for these parameters to those found in Schulman and Milstein’s essay on MFA. [5] In particular, the target reimbursement rate is 100 percent of the 2018 Medicare rate and the percentage in revenue changes addressed by FTE changes to 100%. [6]
Download a PDF of the MFA Model_
Figure 1. A general schematic illustrating the logic underlying a model for adoption of Medicare for All.
Figure 2. A more detailed schematic illustrating the logic underlying a model for adoption of Medicare for All.
Figure 3. A proof of concept. This model would allow users to dynamically modulate key parameters in which they are interested or for which no consensus currently exists.
While designed for one specific, simple proposal, this sample model could readily be modified to apply to other policies recently proposed. In addition to “Medicare for all,” examples include (1) a new national health insurance program for all U.S. residents with an opt-out for qualified coverage; (2) a new public plan option that would be offered to individuals through the Affordable Care Act (ACA) marketplace; (3) a Medicaid buy-in option that states could elect to offer to individuals through the ACA marketplace; and (4) a Medicare buy-in option for older individuals not yet eligible for the current Medicare program. [20]
The plans proposed by the 2020 Democratic presidential candidates all involve extending public insurance. [20,21] These proposals would likely have a number of direct effects that can be estimated, including: (1) overall payments to hospitals and health systems; (2) impact of changes to hospital subsidies such as the 340B drug pricing program; and (3) decreasing certain labor and infrastructure costs associated with a complex, multi-payer system, where each payer has its own policies and procedures. [5,22,23] Each of these proposals would precipitate these changes and an effective model would allow the user the ability to quickly and clearly change the values for the different parameters that distinguish these different reforms in order to objectively and meaningfully compare them and evaluate their impacts.
Looking Forward: Create an Objective Model for Technical Implementation
The debate over healthcare reform would be less partisan with explicit distinctions between matters of principle and technical implementation. An objective, transparent, and versatile simulation and visualization model could simulate the results of a variety of technical policy proposals. Such a model would allow policymakers and the public to compare the potential impact of various healthcare reform proposals. We demonstrated the feasibility of such a model and the availability of much of the necessary data with a simple proof-of-concept. A commitment to making data more available and developing a more robust model are necessary steps toward a more fruitful debate on healthcare reform.
Notes and References
[1] Papanicolas I, Woskie LR, Jha AK. Health care spending in the United States and other high-income countries. Journal of the American Medical Association 2018;319(10):1024-1039.
[2] Morgan, L. U.S. healthcare annual spending estimated to rise by 5.8% on average through 2024. American Health & Drug Benefits 2015;8(5):272.
[3] McCarthy M. U.S. healthcare spending will reach 20% of GDP by 2024, says report. British Medical Journal 2015 August 3;351(3):h4204.
[4] Tax Policy Center. Briefing book. Urban Institute & Brookings Institution 2019. Available at: https://www.taxpolicycenter.org/briefing-book/what-are-dynamic-scoring-and-dynamic-analysis
[5] Schulman KA, Milstein A. The implications of “Medicare for All” for U.S. hospitals. Journal of the American Medical Association 2019;321(17):1661-1662.
[6] Rosenthal E. ‘Medicare for All’ could kill two million jobs, and that’s O.K. The New York Times 2019 May 16. Available at: https://www.nytimes.com/2019/05/16/opinion/medicare-for-all-jobs.html.
[7] Rosenthal E. That beloved hospital? It’s driving up health care costs. The New York Times 2019 September 1. Available at: https://www.nytimes.com/2019/09/01/opinion/hospital-spending.html.
[8] Abelson R. Hospitals stand to lose billions under ‘Medicare for All’. The New York Times 2019 April 21. Available at: https://www.nytimes.com/2019/04/21/health/medicare-for-all-hospitals.html?smid=nytcore-ios-share.
[9] The National Bureau of Economic Research. Healthcare Cost Report Information System (HCRIS) data. The Centers for Medicare & Medicaid Services 2019. Available at: https://www.nber.org/data/hcris.html.
[10] The National Bureau of Economic Research. CMS Casemix File Hospital Inpatient Prospective Payment System (IPPS). The Centers for Medicare & Medicaid Services 2017. Available at: https://www.nber.org/data/cms-casemix-file-hospital-inpatient-prospective-payment-system-ipps.html.
[11] Definitive Healthcare. Hospitals and IDNs database. Definitive Healthcare, LLC, 2019. Available at: https://www.definitivehc.com/product/our-databases/hospitals-and-idns.
[12] CMS.gov. Physician Fee Schedule. Centers for Medicare & Medicaid Services 2019. Available at: https://www.cms.gov/Medicare/Medicare-Fee-for-Service-Payment/PhysicianFeeSched/index.html.
[13] Uhrmacher K, Schaul K, Firozi P, Stein J. Where 2020 Democrats stand on Medicare-for-all. The Washington Post 2019 December 2. Available at: https://www.washingtonpost.com/graphics/politics/policy-2020/medicare-for-all/.
[14] Dickson S, Coukell A, Reynolds I. The size of the 340B Program and its impact on manufacturer revenues. Health Affairs 2019 August 8. Available at: https://www.healthaffairs.org/do/10.1377/hblog20180807.985552/full/.
[15] Lagasse J. Hospitals saved an average of $11.8 million due to 340B drug discount program. Healthcare Finance 2019 June 17. Available at: https://www.healthcarefinancenews.com/node/138838.
[16] Bristol N. Medicaid DSH Payment cuts could add to financial woes of safety-net hospitals. The Commonwealth Fund 2012. Available at: https://www.commonwealthfund.org/publications/newsletter-article/medicaid-dsh-payment-cuts-could-add-financial-woes-safety-net.
[17] County Health Rankings & Roadmaps. 2019 County Health Rankings. Robert Wood Johnson Foundation, 2019. Available at: https://www.countyhealthrankings.org/explore-health-rankings/rankings-data-documentation.
[18] Institute of Medicine. Crossing the quality chasm: A new health system for the 21st Century. National Academy of Sciences 2001. Available at: http://www.nationalacademies.org/hmd/~/media/Files/Report%20Files/2001/Crossing-the-Quality-Chasm/Quality%20Chasm%202001%20%20report%20brief.pdf.
[19] Sanger-Katz M, Kliff S. Elizabeth Warren’s ‘Medicare for All’ math. The New York Times 2019 November 11. Available at: https://www.nytimes.com/2019/11/01/upshot/elizabeth-warrens-medicare-for-all-math.html.
[20] KFF Health Reform. Comparing Medicare-for-all and public plan proposals. Kaiser Family Foundation 2019. Available at: https://www.kff.org/interactive/compare-medicare-for-all-public-plan-proposals/.
[21] Uhrmacher K et al. Where 2020 Democrats stand on Medicare-for-all. The Washington Post 2019 December 2. Available at: https://www.washingtonpost.com/graphics/politics/policy-2020/medicare-for-all/.
[22] Liu JL, Eibner C. National health spending estimates under Medicare for All. RAND 2019. Available at: https://www.rand.org/pubs/research_reports/RR3106.html.
[23] Jawani A. et al. Billing and insurance-related administrative costs in United States’ health care: Synthesis of micro-costing evidence. BMC Health Services Research 2014;14:556.
[24] Though certain costs are fixed for years at a time, labor costs are never truly fixed, so we use the term “committed” as suggested by Professor Robert Kaplan of Harvard Business School.


