Pinar Karaca-Mandic, PhD; Archelle Georgiou, MD; Soumya Sen, PhD; Yi Zhu; Khoa Vu; Alexander Everhart
University of Minnesota
Contact: Pinar Karaca-Mandic: pkmandic@umn.edu
What is the message? Early daily data from a new publicly-available dashboard at the University of Minnesota Carlson School of Management reports a high variance in COVID-19 hospitalizations across the United States. The data can help public health officials promote the adoption of best practices and resource sharing, including hospital capacity and ventilators.
What is the evidence? The authors have created a publicly-available real-time tracking model.
Link to dashboard: https://carlsonschool.umn.edu/mili-misrc-covid19-tracking-project
Timeline: Submitted, April 12, 2020; accepted after revisions, April 13, 2020.
Cite as: Pinar Karaca-Mandic, Archelle Georgiou, Soumya Sen, Yi Zhu, Khoa Vu, and Alexander Everhart, 2020. Early Insights from the COVID-19 Hospitalization Tracking Project of University of Minnesota Carlson School of Management. Health Management, Policy and Innovation (HMPI.org), volume 5, Issue 1, special issue on COVID-19, April 2020.
Pandemics Are Inevitable – A Weak Response Is Not
While the emergence of COVID-19 may not have been preventable, the tragic impact of the virus could have been mitigated with better preparation and response. As the pandemic unfolds, one of the greatest barriers to prospective planning has been credible and consistent data. While case rates have been reported in the U.S. since January 20 – the date of the first confirmed case of 2019-nCoV infection in the country – this does not adequately reflect the spread of the virus because testing capability has been limited. As a result, the only metric available from all 50 states is the number of deaths, at least those that are not attributed to other causes, a moderately accurate but trailing indicator that does not provide an adequate lens to the impact of the crisis on our healthcare infrastructure.
A Data Collection and Reporting Dashboard for Hospital-Based Deaths
In March, the Medical Industry Leadership Institute [1]and the Management Information Systems Research Center [2] at the University of Minnesota Carlson School of Management launched a project to collect daily data from state Departments of Health on COVID-19 hospitalizations. The project team sent serial emails to the communication/media director of each state describing the project and requesting information starting March 26. At that time, only 23 states publicly reported any hospitalization data on their publicly available websites.
Fortunately, we now have a majority of states. As of April 10, 40 states are reporting data on hospitalizations: 23 states are reporting total hospitalizations to date and 21 states report current hospitalizations. Minnesota, Montana, North Dakota, and Oregon report on both measures for COVID-19 hospitalizations.
Since April 6, this data has been shared on a publicly available dashboard. The University of Minnesota COVID-19 Hospitalization Tracking Project (https://carlsonschool.umn.edu/mili-misrc-covid19-tracking-project) displays real-time and historical (since project inception) data for current and total hospitalizations as well as ICU data. All data are adjusted for states’ population. In addition, each state’s hospital bed capacity is calculated. The projects’ early results, reflecting nine days of data, were published in Health Affairs.
Actionable Insights From the Dashboard
Ongoing data collection expand these insights and, after only 16 days of data collection and tracking, there are new actionable insights from this new comprehensive state by state view. Two key implications involve variance among states and forecasts of hospital resource needs.
- High variance in hospitalization among states. The average total hospitalizations per 100K adults is 14.9 (Table 1) among the 23 reporting states. Minnesota’s rate (7.6) is significantly lower than the average and remarkably lower than Wisconsin (20.6), a neighboring state. Public health officials can use these data comparisons to identify and potentially adopt best practices from other states. In addition, visibility to the hospitalization data of neighboring states means states can work with each other to share resources – from hospital capacity to ventilators to personal protective equipment to personnel.
| Table 1: Hospitalizations per capita among reporting states, April 10, 2020 | ||||
| State | Total hospitalizations to date per 100K adult population | State | Current hospitalizations per 100K adult population | |
| Hawaii | 3.96 | North Dakota | 2.32 | |
| Montana | 5.08 | Minnesota | 3.43 | |
| Utah | 8.58 | Montana | 3.59 | |
| South Dakota | 4.53 | Arkansas | 3.85 | |
| North Dakota | 6.43 | Oregon | 4.35 | |
| Alaska | 5.22 | New Mexico | 4.82 | |
| Minnesota | 7.61 | Iowa | 5.10 | |
| Oregon | 10.50 | North Carolina | 5.43 | |
| Virginia | 12.02 | Vermont | 6.54 | |
| Tennessee | 10.52 | Texas | 7.47 | |
| Idaho | 10.16 | California | 9.81 | |
| Massachusetts | 36.72 | Maine | 10.51 | |
| New Hampshire | 12.62 | Missouri | 11.02 | |
| Alabama | 10.03 | Washington | 11.39 | |
| Kansas | 12.90 | Pennsylvania | 21.31 | |
| Florida | 15.05 | Rhode Island | 22.25 | |
| Ohio | 19.97 | Delaware | 24.52 | |
| Wisconsin | 20.63 | Connecticut | 57.14 | |
| Oklahoma | 14.86 | Louisiana | 59.57 | |
| Mississippi | 21.82 | New Jersey | 112.32 | |
| Maryland | 31.07 | New York | 123.99 | |
| Georgia | 31.79 | |||
| Colorado | 30.64 | |||
| Average | 14.90 | 24.32 | ||
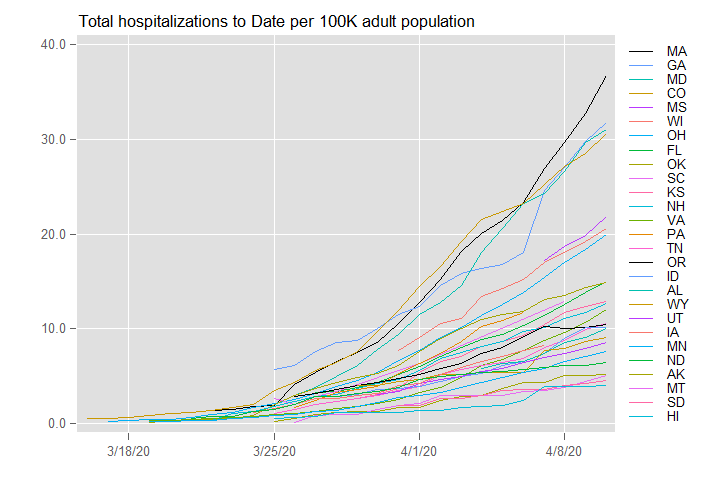
- Hospitalization trends are leading indicators of resource needs. Trending each state’s hospitalizations per 100K adults over time (Figures 1 and 2) offers a lens into the severity and activity of the virus. As the pandemic’s impact in Massachusetts, Georgia, Maryland, and Colorado trails one to two weeks behind New York and New Jersey, state health agencies can perform predictive modeling of their upcoming needs to forecast their hospital bed utilization. At a federal level, this national view can help optimally allocate the addition of hospital resources and capacity across states.
Figure 1: Total hospitalization to date per 100K adult population
Looking Forward
We will continue daily data collection for the foreseeable future. We are also collecting more within-state geography data that will refine modeling and support predictive analyses to help optimize management of hospital resources and capacity. This is particularly important as we anticipate and prepare for a potential second round surge of COVID-19 in the fall.
Pinar Karaca-Mandic, Ph.D. is Associate Professor, Department of Finance and Academic Director, Medical Industry Leadership Institute (MILI) Carlson School of Management, University of Minnesota. She is also a Research Associate at the National Bureau of Economic Research, Health Economics and Health Care programs
Archelle Georgiou, MD is Chief Health Officer, Starkey Hearing Technologies and Executive in Residence, Carlson School of Management, University of Minnesota
Soumya Sen, Ph.D. is Associate Professor, Department of Information & Decision Sciences, and Research Director of MIS Research Center, Carlson School of Management, University of Minnesota
Yi Zhu is a PhD student at the Carlson School of Management, Department of Information & Decision Sciences, University of Minnesota
Khoa Vu is a PhD student at the Applied Economics Department, University of Minnesota
Alexander Everhart is a PhD student at the Health Services Research, Policy, and Admin Program
We also acknowledge support from undergraduate research assistants Christopher Rose, Ansiya Khan, Lauryn MacLeod, Brooke Wiegert, from Kimberly Choyke, M.S.Ed, Medical Industry Leadership Institute Program Administrator as well as from the Carlson School of Management Information Technology Team.
References
[1] https://carlsonschool.umn.edu/faculty-research/medical-industry-leadership-institute
[2] http://www.misrc.umn.edu/