Aazad Abbas and Jin Tong Du, Temerty Faculty of Medicine, University of Toronto; Cari Whyne, Division of Orthopaedic Surgery, University of Toronto and Sunnybrook Research Institute; William Mitchell, Rotman School of Management, University of Toronto; Jay Toor, Division of Orthopaedic Surgery, University of Toronto
Contact: jay@primushealthcaresolutions.com
Abstract
What will you learn? Commonly used traditional procurement methodology overlooks many financial considerations that are otherwise included in a comprehensive Total Cost of Ownership analysis that takes into account hospital and medical device interdependence.
What is the evidence? Comparison of traditional procurement methodology to Total Cost of Ownership analysis using a hypothetical example of Orthopaedic Powered Instruments.
Timeline: Submitted: June 11, 2021; accepted after review: November 5, 2021.
Cite as: Aazad Abbas, Jin Tong Du, Cari Whyne, William Mitchell, Jay Toor. 2022. Value-Based Procurement Using Total Cost of Ownership: A Step-by-Step Financial Assessment of Orthopaedic Powered Instrument Procurement. Health Management, Policy and Innovation (www.hmpi.org), Volume 7, Issue 1.
Value-Based Procurement in Healthcare Needs Better Financial Analyses
Although procurement of healthcare products has traditionally emphasized low-price purchasing strategies above all else, efforts are being made to shift healthcare procurement towards value-based models that incorporate quality.1 While this term is ambiguous, quality in the literature typically refers to clinical impact based on clinician preference or need with respect to patient impact as well as safety and standard requirements from regulators and accreditors.1, 2 Despite such positive steps towards value-based procurement, the literature suggests a lack of similar modernization with respect to financial components of procurement.3, 4, 5
Cost analyses of medical devices remain relatively simplistic. Specifically, there is an overemphasis on the importance of acquisition price.3, 4 This is especially concerning as medical devices’ total lifetime costs to an organization often significantly exceed acquisition price.3
A more sophisticated method that is commonly applied in industries such as information technology, construction and manufacturing is Total Cost of Ownership (TCO). In contrast, the literature suggests that this TCO approach is rarely used in healthcare.5, 6 Moreover, a recently published review of Canadian public healthcare tenders revealed that despite total cost being highly referenced, it is inconsistently used and often incorrectly applied.4
Although there exists a body of literature encouraging healthcare procurement to apply total cost of ownership,5, 6 hospitals have complex interdependent supply chains and operations. This makes it difficult to define the components of a hospital’s operational expenses, which is an essential step in TCO.6 Furthermore, medical devices themselves vary, ranging from surgical instruments that require daily reprocessing to expensive MRI machines with considerable maintenance costs. Standardization of TCO in procurement is therefore predictably challenging. As such, each medical device procurement effort requires customized evaluation through a TCO lens with a particular emphasis on the impact on operations. However, there is a paucity in the literature on how to actually perform such an assessment of hospital operations, supply chains and their interdependence with medical device procurement.
We address this gap by describing a step-by-step case-based approach that assesses the operational and financial impacts that must be considered when procuring a common medical device: Orthopaedic Powered Instruments (OPIs). We examine product specifications and how variation between competitors can impact operational costs. This granular examination of OPIs can be used to guide similar detailed procurement analysis of other medical devices.
Background: Orthopedic Devices
Orthopaedic Powered Instrument Handpieces
Orthopaedic Powered Instruments (OPIs) are handheld power tools used in orthopaedic surgery to cut, drill, and shape bone. Although there are numerous types of OPIs handpieces, for the sake of simplicity we focus on the three most commonly used handpiece types: reciprocating saws, oscillating saws and drivers. Figure 1 depicts these handpieces.
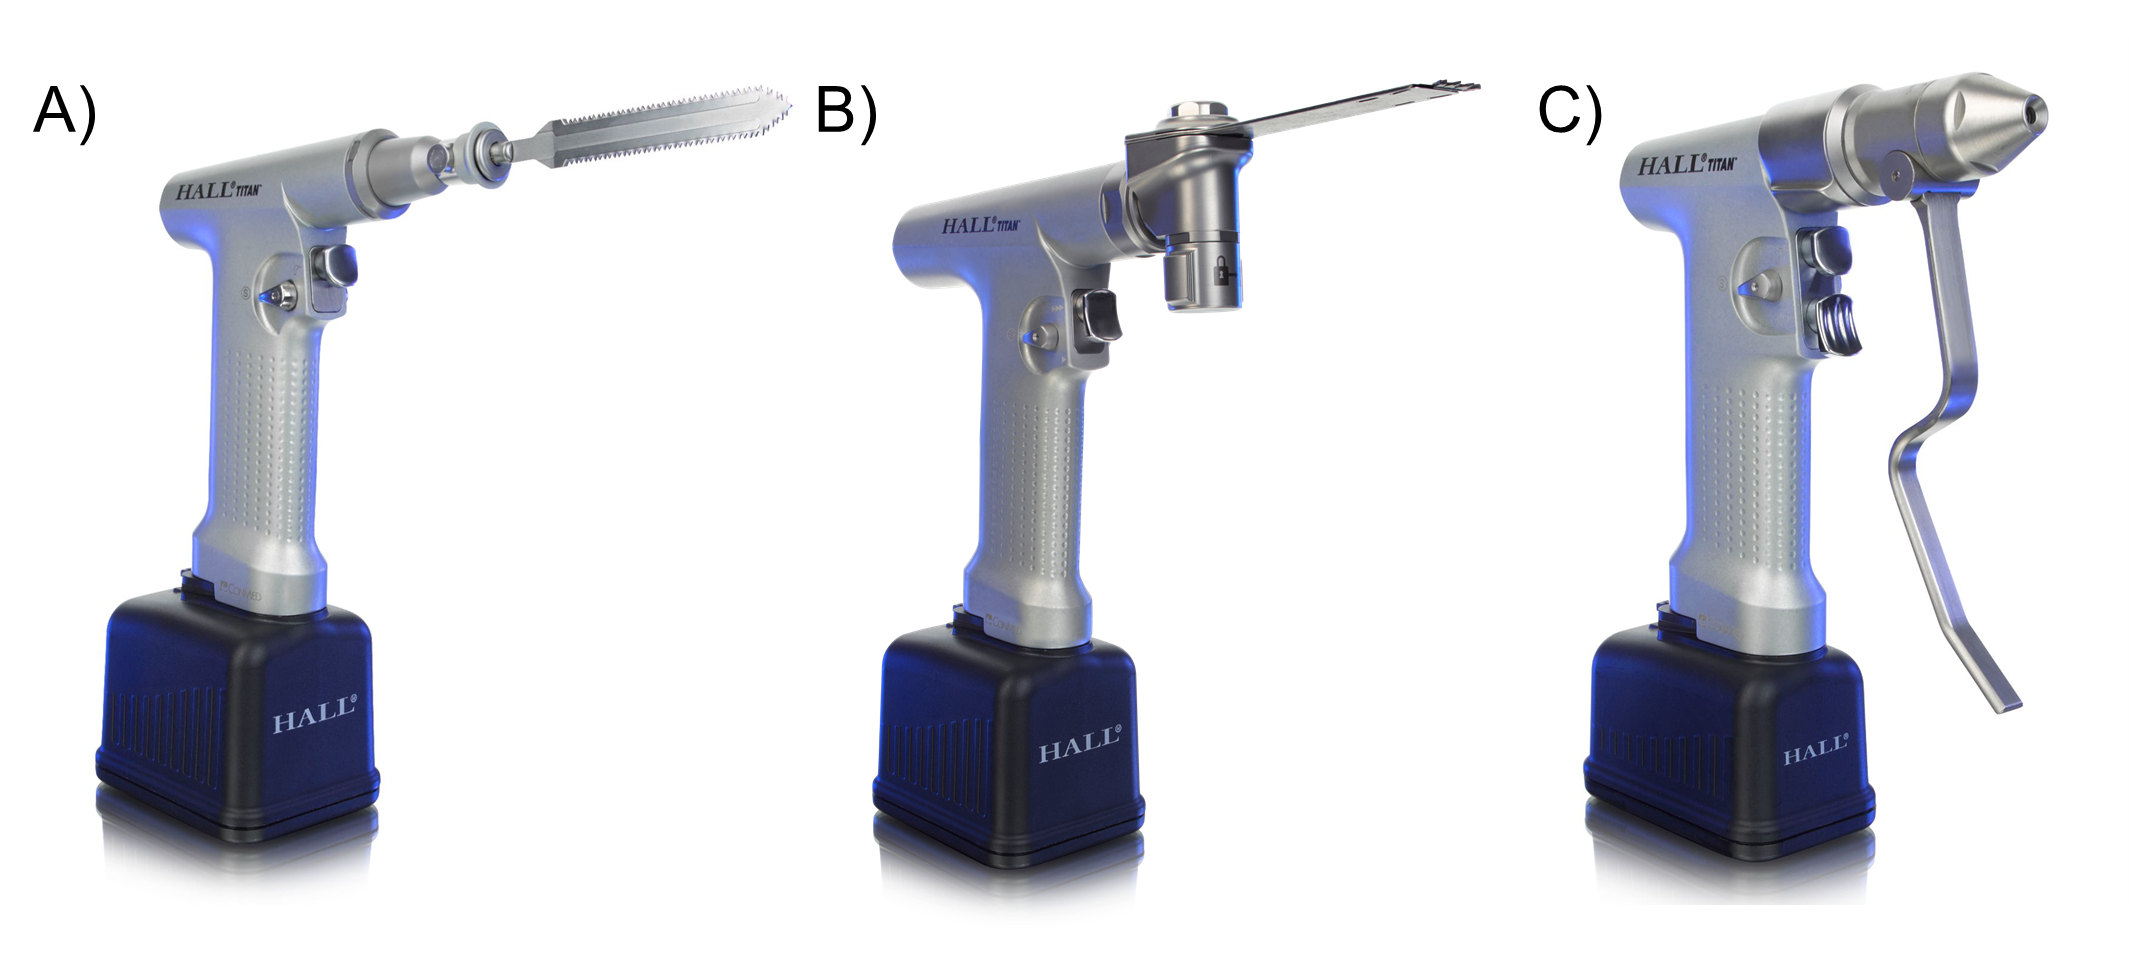
Figure 1. Examples of the three most common handpieces (A: reciprocating saw, B: oscillating saw, C: driver) from a common OPI retailer (CONMED Inc). Images taken with permission from CONMED Corporation.
Notably, some OPIs have modular handpieces that can be converted between handpiece types instead of separate dedicated handpieces. For example, Figure 2 depicts a handpiece that can be converted to a different functionality using adaptor attachments.
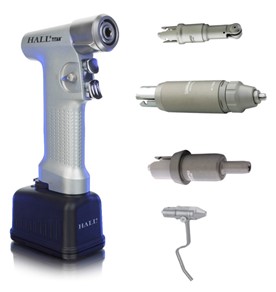
Figure 2. Example of a single handpiece with various attachments. Image taken with permission from CONMED Corporation.
The following discussion expands upon important OPI features such as battery, handpiece modularity, device reprocessing requirements, disposables, and maintenance, each of which must be considered during the procurement process.
Battery: OPIs are commonly battery powered. Batteries are usually interchangeable between handpieces, leading to separate calculations for battery cost and purchase quantity. However, for the sake of simplicity, in this analysis we combine the handpiece and battery costs.
Handpiece Modularity: Although OPIs have three main common functionalities of drilling, reciprocating sawing, and oscillating sawing, they are often converted to additional functions using specialized attachments such as surgical Kirschner wire driver chucks. In the case of modular handpieces, these attachments can be exchanged on a single handpiece. With respect to non-modular OPIs, these attachments can only be applied to certain handpiece types. For example, on some devices, the Kirschner wire driver chuck attachment can only be attached to the drill handpiece. Similarly, there are different sizes of OPI handpieces in order to accommodate various sized attachments, based on anatomic location. Some OPIs are capable of receiving all sizes of attachments and as such are modular from a size perspective. For example, large bones like femurs require larger saws while small bones like metacarpals require small saws. Some OPIs have a large handpiece for the larger saws and a small handpiece for the smaller saw, while other OPIs have “size-modular” handpieces that can accept both saws.
Historic Inventory Compatibility: Notably, some OPI brands’ attachments have historic inventory compatibility, which means that older versions of that brand’s OPI can use the same attachments and newer versions of that brand’s OPI can use older attachments. This is an important factor to consider when procuring these devices, as these attachments’ costs must be considered.
Device Reprocessing Requirements: Before OPIs are used in surgical procedures, they require decontamination and sterilization using either steam or chemical sterilization. Sterilization methods differ in cost and depend on the OPI’s battery specifications with respect to tolerance of steam reprocessing. Notably, a hospital can either perform this process itself, typically in a Medical Device Reprocessing Department (MDRD), or outsource it to an outside facility.
Disposables: For each surgical case, a handpiece requires a disposable device such as a saw blade or drill tip. These have no operational impact, but must be considered for cost comparison.
Maintenance: OPIs require servicing, maintenance and repair. OPI vendors often offer a service plan, or, instead, repairs and maintenance can be done in an ad-hoc fashion. This choice has no operational impact, but must be considered for cost comparison.
Lifespan: Lifespan is an important consideration for OPIs, and as such it is important to determine drivers of lifespan. A major driver of lifespan in OPIs is moisture-related damage from reprocessing and use, which is measured using Ingress Protection Rating (IPX Rating). As such, this must be considered when estimating product lifespan.
Hypothetical Scenario
For illustration, we examine three hypothetical OPI brands, each differing in product specifications, in order to produce a variation in operational impact and financial implications (Table 1). Accordingly, with respect to handpieces, OPI brands A and B are non-modular, while OPI brand C is modular. OPI brand A requires steam and chemical reprocessing of batteries, while OPI brands B and C can be sterilized with only steam. OPI brands A and B do not have historic inventory compatibility with respect to attachments, while OPI brand C does.
Table 1. Characteristics of the OPI brands under consideration.
| Variable | OPI brand A | OPI brand B | OPI brand C |
| Handpiece modularity | No | No | Yes |
| Sterilization type | Steam and chemical | Steam | Steam |
| Historic inventory compatibility | No | No | Yes |
Our example hospital is one performing 2,000 surgical procedures per year each requiring one, two or three of the OPI handpiece types (see Figure 1). The current inventory, consisting entirely of OPI brand C, is at end-of-lifespan and needs to be replaced in its entirety.
In the following sections, we first compare the three OPI brands using a traditional financial procurement costing approach. We then perform a more comprehensive TCO procurement approach and finally compare the two procurement strategies.
Procurement Approaches: Traditional vs TCO
Traditional Evaluation: Comparing Acquisition Price
According to traditional OPI procurement approaches, the total acquisition price (TAP) for each OPI brand is taken as a sum of the price for each OPI component offered by the particular brand. Accordingly, this may be represented by the equation below:
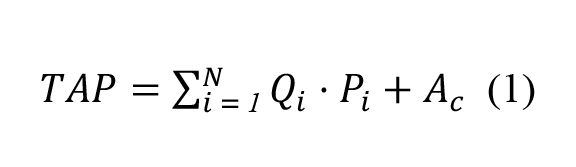
In equation 1, is each item in the OPI component, is the total number of components in the OPI, is the necessary inventory stock for each item in the OPI, is the acquisition price in dollars for each item, and is the attachment costs.
Using this procurement approach, the quantity ordered is typically based on the quantity necessary to replenish or replace existing inventory, which can be appropriately defined as required inventory quantity (RIQ). For the example below, we will assume the RIQ to be 45. With respect to acquisition price of the attachments, we assigned a lump sum value that differs between brands. The three OPI brands are compared across these parameters in Table 2.
Table 2. Total acquisition price (TAP) calculation for three hypothetical orthopaedic powered instrument (OPI) brands using the standard procurement method.
| Variable | OPI brand A | OPI brand B | OPI brand C |
| RIQ | 45 | 45 | 45 |
| Price/handpiece | $8,000.00 | $9,000.00 | $10,000.00 |
| Attachment inventory cost | $60,000.00 | $65,000.00 | $70,000.00 |
| Total acquisition price | $420,000.00 | $470,000.00 | $520,000.00 |
RIQ: required inventory quantity.
Using this simplistic approach, the financially optimal choice is OPI brand A.
Comprehensive Evaluation: Total Cost of Ownership
TCO for each OPI brand was defined to be acquisition cost amortized over lifespan plus operational expenses per year. Accordingly, this may be represented by the formula below:

In equation 2, is each item in the OPI components, is the total number of components in the OPI, is the amortized acquisition price,is the necessary inventory stock for each item in the OPI, is the acquisition price in dollars for each item, is the lifespan of the total inventory in years, is the attachment costs, and is the operational expense in dollars per annum.
Step 1: Calculating Necessary Inventory
While necessary purchase quantity is often based on replacing historic inventory quantity, a more comprehensive and responsible procurement approach entails purchasing what is necessary to meet demand for the procured item: the Necessary Inventory Quantity (NIQ). NIQ is calculated based on mean demand of the item as well as safety stock to buffer against variability. This can be represented by the equation below:

In equation 2, is the mean demand of the item, is the service level of the item (i.e. the safety stock), andis the standard deviation of the demand on the item.
To illustrate this, consider the following scenario of a small orthopaedic hospital that performs joint replacements with the instrument utilization given in Table 3. Assuming that inventory can be reprocessed within a 24 hour period, and that all three handpiece types are required for each surgery (i.e. a non-modular OPI brand), the NIQs are as described in Table 3.
Table 3. Example calculation of the total NIQ required by a small orthopaedic hospital with a non-modular OPI brand.
| Variable | Reciprocating Saw | Oscillating Saw | Driver | Total |
| 0.99 | 0.99 | 0.99 | ||
| 2 | 2.5 | 3 | ||
| 6 | 8 | 10 | ||
| 11 | 14 | 17 | 42 |
Notably, the mean demand and standard deviation can be calculated for any hospital by reviewing a sample of surgical schedule data, ideally over a sufficient time period to reliably represent the true OPI usage. In the above example a 99% service level was used: this means that with the suggested NIQ, there will be a stockout event less than 1% of the time. This can be adjusted depending on an institution’s acceptable stockout tolerance. Notably, a stockout refers to requiring an item and it not being available. In surgery, this can result in either a cancelled or rescheduled surgery, which carries significant clinical, operational and financial implications.
Modularity’s Effect on NIQ
Not all OPI brands will have the same necessary inventory quantity. As previously described, there are three main intraoperative OPIs used for surgical purposes: reciprocating saw, oscillating saw and driver. Certain OPI products have a modular system that combines two or three of these functionalities. As such, a hospital may have to purchase three, two or only one handpiece type. This is of utmost importance when calculating necessary inventory as it allows for the aggregation or pooling of demand. For example, consider the case where OPI brand A is non-modular and as such requires three different types of handpieces (reciprocating saw, oscillating saw, driver), whereas OPI brand C has a modular system that only requires one handpiece that can serve all three functions. Accordingly, the new standard deviation representing the demand of OPI brand C () can be calculated as the square root of the sum of the squares of the standard deviation for the demand of each OPI brand C function. This can be represented by the following equation:

In equation 4, is the standard deviation of the demand on the reciprocating saw function of OPI brand C, is the standard deviation of the demand on the oscillating saw function of OPI brand C, and is the standard deviation of the demand on the driver function of OPI brand C. Table 4 provides an example of the NIQ calculation for a modular system using aggregation of demand.
Table 4. Example calculation of the total NIQ required by a small orthopaedic hospital with a modular OPI brand with a 24 hour inventory turnover.
| Variable | Reciprocating Saw | Oscillating Saw | Driver | Modular OPI brand |
| 0.99 | 0.99 | 0.99 | 0.99 | |
| 2 | 2.5 | 3 | 4.39 | |
| 6 | 8 | 10 | 24 | |
| 11 | 14 | 17 | 35 |
Compared to the non-modular case that requires 42 handpieces to service the hospital, the modular OPI brand requires 35 handpieces. This suggests potential NIQ savings of 7 handpieces, which translates to $48 000 to $70 000 in TAP savings, depending on the OPI brand.
Although the above examples are specific to OPIs, this NIQ calculation can be performed on any capital purchase involving surgical or hospital inventory, while taking into consideration device specifications such as modularity. The cost implications hospital-wide have enormous potential, when considering the volume of tools used and the inclusion of more expensive items such as endoscopes.
Hospital’s Reprocessing Turnover and the Effect on NIQ
All of the above calculations assumed a 24-hour reprocessing turnover. This is typical for hospitals with in-house device reprocessing. However, if reprocessing is outsourced, the NIQ will increase significantly as the mean demand per inventory cycle and variability increase. A sample calculation under the same scenario as the one above, except with an outsourced reprocessing facility with a 48-hour reprocessing cycle duration (RCD) is found below in Table 5.
Table 5. Example calculation of the total NIQ required by a small orthopaedic hospital with a modular OPI with a 48 hour reprocessing cycle.
| Variable | Reciprocating Saw | Oscillating Saw | Driver | Modular OPI brand |
| 0.99 | 0.99 | 0.99 | 0.99 | |
| 2.8 | 3.5 | 4.2 | 6.2 | |
| 12 | 16 | 20 | 48 | |
| 19 | 25 | 30 | 63 |
The example in Table 5 demonstrates that if a facility with a 24 hour RCD (typical for an in-house MDRD) as opposed to a 48 hour cycle (typical for an out-sourced MDRD), the NIQ for the non-modular OPI is 42 compared to 74, and the NIQ for the modular OPI is 35 compared to 63. As such, the RCD is an important consideration that must be taken into account when purchasing reusable devices.
Step 2: Calculating Total Acquisition Price (TAP)
Calculating TAP involves considering both the handpiece and attachment acquisition prices.
Handpiece Acquisition Price
Once the NIQ is known for each OPI brand, the total acquisition price (TAP) for each brand’s handpieces may be determined according to Equation 1. Notably, as described in the preceding section, the NIQ depends on factors such as modularity and reprocessing cycle time. Using the three hypothetical OPI brands presented in Table 1, we present the TAP for the standard procurement approach and the TCO approach, as well as the difference between the two. For illustration purposes, we assume that OPI brand C has modularity as described in the Modularity’s Effect on NIQ section.
Table 6. Comparison of Handpiece Total Acquisition Price three hypothetical OPI brands.
| Variable | OPI brand A | OPI brand B | OPI brand C |
| Standard procurement | |||
| Number of units | 45 | 45 | 45 |
| TAP | $360,000.00 | $405,000.00 | $450,000.00 |
| TCO procurement | |||
| Number of units | 42 | 42 | 35 |
| TAP | $336,000.00 | $378,000.00 | $350,000.00 |
| Difference between procurement approaches | |||
| Δ Number of units | 3 | 3 | 10 |
| Δ TAP | $24,000.00 | $27,000.00 | $100,000.00 |
This analysis demonstrates that using the TCO approach can significantly reduce the necessary purchase quantity of instruments and dramatically lower TAP. Furthermore, taking into consideration the OPI product specifications of modularity greatly impacts the TAP results. Hypothetical OPI brand C, which was initially the most expensive option, now becomes the second choice from a TAP perspective.
The Effect of Compatibility With Existing Inventory
As aforementioned, consideration must be made regarding particular product specifications. With respect to a scenario where existing inventory is being replenished or replaced, compatibility of the new inventory should be considered. In our scenario, the current inventory consists of OPI brand C, and provided that OPI brand C has compatibility, the TAP should be reduced accordingly. This is demonstrated below in Table 7.
Table 7. Calculation of the TAP across the OPI brands, taking into consideration the effect of compatibility with existing inventory.
| Variable | OPI brand A | OPI brand B | OPI brand C |
| 42 | 42 | 35 | |
| Price/handpiece | $8,000.00 | $9,000.00 | $10,000.00 |
| Historic inventory compatibility | No | No | Yes |
| Attachment inventory price | $60,000.00 | $65,000.00 | $0.00 |
| Total acquisition price | $396,000.00 | $443,000.00 | $350,000.00 |
Notably, taking into consideration the effect of compatibility of OPI brand C with existing inventory reduces its TAP to $350,000.00, while OPI brands A and B have to incur the cost of new attachment inventory.
Step 3: Defining and Calculating Operational Expense
Reprocessing Costs
In the preceding section, a product’s specification was found to impact the TAP. Another major determinant of TCO is operational expenses (OE), which can be similarly affected by product specifications. An important step in determining TCO is to construct a process map of how a reusable device flows within a hospital, while taking into consideration relevant specifications. Figure 3 provides an example focused on a common consideration related to OPIs: battery type.
Generally, more advanced battery technology allows certain OPIs to be sterilized in a single stage through a steam cycle with no damage to the battery. In contrast, most OPIs rely on standard battery systems which require low heat chemical reprocessing and entail a two stage process necessitating disassembly into the handpiece and battery. For illustration purposes, we present a scenario in which OPI brand A uses a standard two stage battery system, while OPI brand B and OPI brand C use a single stage battery system. As such, OPI brand A follows the two-stage reprocessing (blue and black sections) in Figure 3, while OPI brand B and OPI brand C flow entirely within the single stage (black) reprocessing pathway.
Figure 3. Process map of the flow of OPIs. The single stage reprocessing cycle is illustrated in black, with the two stage reprocessing cycle in blue.
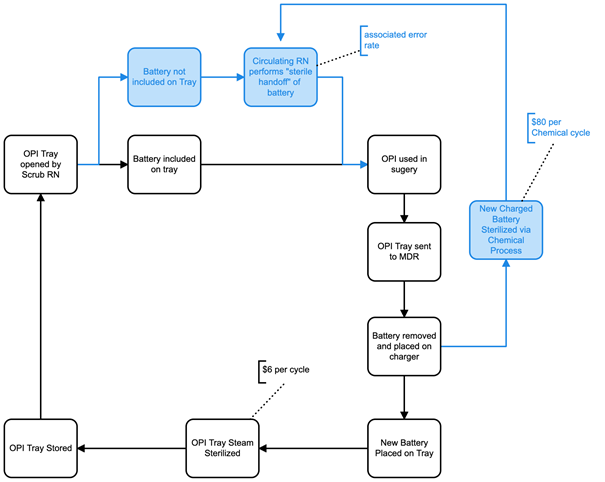
The process map reveals that the extra chemical processing step taken by OPI brand A results in a financial impact of $80 per cycle (estimated based on our institution’s MDRD costs). Based on the 20 battery capacity of a chemical reprocessor, the additional cost is $4 per cycle per battery. Furthermore, because the battery requires a sterile handoff in the OR, which occasionally results in contamination and subsequent duplicate reprocessing, with all associated costs.
In this example, using an estimate of 2000 cases per year, we assume $6/cycle for steam, $4/cycle for peroxide, and an intra-operative error rate of 4% for the two stage system. The associated annual operational expenses are presented in Table 7.
Table 7. Annual operational expenses for the various OPI brands under consideration.
| Variable | OPI brand A | OPI brand B | OPI brand C |
| Sterilization reprocessing | Steam and chemical | Steam only | Steam only |
| Annual operational expenses | $20,800.00 | $12,000.00 | $12,000.00 |
These results demonstrate that annual costs are significantly higher with OPI brand A due to the standard battery system requiring both steam and chemical reprocessing.
Maintenance and Disposable Costs
Potential differences in maintenance costs should also be considered. Two common models here are either a service plan covering all maintenance or al-a-carte maintenance fees. Similarly, the potential differences in disposable cost per case should be considered. To illustrate, we compared the three hypothetical OPI brands across these two parameters below in Table 8.
Table 8. Maintenance plan and disposable costs for each OPI brand under consideration.
| Variable | OPI brand A | OPI brand B | OPI brand C |
| Maintenance Plan Type | Service Plan | Al-a-carte | Service Plan |
| Cost/unit/year | $800.00 | $900.00 | $1100.00 |
| Total cots/year | $33,600.00 | $37,800.00 | $38,500.00 |
| Disposable costs | |||
| Cost/case | $9.00 | $10.00 | $12.00 |
| Cost/year | $18,000.00 | $20,000.00 | $24,000.00 |
| Total maintenance and disposable costs/year | $51,600.00 | $57,800.00 | $62,500.00 |
Step 4: Calculating TCO
A TCO per annum, based on OPI lifetime, is necessary to compare amortized TAP across OPI brands. To illustrate this, we differentiate the lifetimes and present various amortized TAPs below, alongside the costs calculated in Steps 1, 2 and 3. Notably, estimating lifespan can be complex. For simplicity, we use IPX rating as a proxy measure. We assume the OPI brand A has the lowest IPX rating, while OPI brands B and C have equal and higher IPX ratings than OPI brand A, and base lifespan estimates accordingly.
Table 9. Total cost of ownership (TCO) for the various OPI brands under consideration.
| Variable | OPI brand A | OPI brand B | OPI brand C |
| TAP | $396,000.00 | $443,000.00 | $350,000.00 |
| Lifetime (years) | 10 | 12 | 12 |
| Amortized TAP | $39,600.00 | $36,916.67 | $29,166.67 |
| Operational expenses/year | $20,800.00 | $12,000.00 | $12,000.00 |
| Maintenance cost/year | $33,600.00 | $37,800.00 | $38,500.00 |
| Disposable cost/year | $18,000.00 | $20,000.00 | $24,000.00 |
| TCO/year | $112,000.00 | $106,716.67 | $103,666.67 |
TAP: Total acquisition price.
Table 9 summarizes the results of a comprehensive TCO. It suggests the financially optimal purchase is OPI brand C, with OPI brand B as a second choice and OPI brand A as last choice.
Table 10 below provides a cost comparison using a traditional standard procurement technique along with the additional considerations of disposable and maintenance costs.
Table 10. Variables under consideration across the OPI brands using the standard procurement approach.
| Variable | OPI A | OPI B | OPI C |
| RIQ | 45 | 45 | 45 |
| Price/unit | $8,000.00 | $9,000.00 | $10,000.00 |
| Attachment Inventory Price | $60,000.00 | $65,000.00 | $70,000.00 |
| Total Acquisition Price | $420,000.00 | $470,000.00 | $520,000.00 |
| Disposable cost/case | $9.00 | $10.00 | $12.00 |
| Maintenance cost/year | $33,600.00 | $37,800.00 | $38,500.00 |
RIQ: required inventory quantity.
The above method does not give a single value to compare, but requires comparison across multiple financial parameters. However, simple inspection suggests that OPI brand A is financially preferable, with OPI brand B as second choice and OPI brand C as last choice.
Lessons
The two procurement approaches yielded very different results, with the traditional approach suggesting that OPI brand A was the preferred choice, while the TCO approach suggested OPI brand C was preferable. This underscores the importance of a comprehensive financial quantification when making key procurement choices between competitors.
Importantly, TCO began with a NIQ calculation based on a hospital’s daily utilization of the device being procured. NIQ calculation alone reduced the procurement quantity based on the traditional approach of 45 instruments to 42 instruments with the non-modular OPI brands, and to 35 instruments for the modular OPI brand. This reduction of three instruments at a minimum to ten instruments at a maximum represents a lowering TAP by $24,000 to $100,000. NIQ calculation is thus shown to be a critical component in value based procurement strategies in order to accurately determine the appropriate quantity of a medical device for a particular institution.
A second important feature to consider is compatibility with existing inventory. In our example, this led to a $70,000 reduction in the acquisition price of OPI Brand C, creating a significant financial advantage over the other brands.
A third essential consideration is the operational process flow of a device within an organization. In our example, process mapping of the OPIs revealed an $8,800 operational expense disparity between OPI brands, stemming from a difference in specifications required for product interactions with the MDRD. This is a crucial component which is often missed by traditional procurement strategies in healthcare, as it requires technical understanding of the specific medical device as well as hospital operations such as device reprocessing.
Lastly, it is important to understand the impact of the variation of hospitals’ operational configuration on procurement. In our example, we highlighted the effect of varying reprocessing cycle duration on NIQ. Specifically, a hospital with outsourced device reprocessing had a longer t,rn-around, which required an additional 28 to 32 handpieces over a hospital with an in-house MDRD, equating to a major variance in procurement costs. This underscores the importance of accurately understanding a hospital’s operations prior to procurement.
Lessons for Manufacturers
A major product design consideration should be modularity of medical devices, as this feature can significantly alter hospital operations and subsequently NIQ. In addition, battery reprocessing using only steam reduces operational expenses and should ideally be incorporated into future product design. In addition, manufacturers should more clearly represent the operational and financial impact of such features to procurement entities, as these can be easily overlooked.
Lessons for Hospitals
The TCO method is complex and involves careful consideration of hospital data such as operational scheduling and device utilization in the context of each medical device being procured. Although laborious, this method is critical to fiscally responsible procurement. Understandably, it can be challenging for procurement agents to ensure consideration of this level of granular detail, which suggests the need for more clinician and front-line worker (i.e. device reprocessing technician) involvement in the procurement process. As the trend towards group purchasing organizations (GPOs) continues, efforts to embed procurement agents directly within hospitals are commendable. This allows these agents to gather the front-line clinical and operational knowledge required for TCO. One final consideration for hospitals is the compatibility of medical devices with existing inventory, which can significantly reduce acquisition price. Hospitals looking to minimize procurement expenditure may prefer to select devices that are compatible with their current inventory.
Looking Forward
This paper shows the value of TCO, which takes into consideration key operational and device specific implications often overlooked by standard procurement strategies. While this paper provides relevant hypothetical scenarios, it is ultimately limited by the lack of real-world procurement data. Further research is recommended including analysis of actual RFPs using the described TCO methodologies. In addition, a qualitative study can 1) help determine if key procurement stakeholders would be receptive to our described technical approach, and 2) identify potential barriers and opportunities with respect to implementation.
References
- Deloitte: Introducing Value-based procurement in healthcare | Procurement & Supply Chain | Healthcare Global. (April 2, 2021). Accessed on May 9, 2021.
- Fraser, Neil. Advantages of Value-Based Procurement. Medtronic Insight Series. Accessed on May 9, 2021.
- Hospodková P, Vochyánová A. The Application of the Total Cost of Ownership Approach to Medical Equipment—Case Study in the Czech Republic. World Congress on Medical Physics and Biomedical Engineering 20; 18; Singapore: Springer Singapore; 2019.
- Miller FA, Lehoux P, Peacock S, Rac VE, Neukomm J, Barg C, Bytautas JP, Krahn M. How Procurement Judges The Value of Medical Technologies: A Review of Healthcare Tenders. International Journal of Technology Assessment in Health Care; 2019. 35.
- Innovation Procurement Guide No. 3 Guide to Evaluating Total Cost of Ownership. Healthcare Supply Chain Network. (June 25, 2015). Accessed on May 9, 2021.
- Accruent. 4 Considerations to Manage Your Total Cost of Medical Equipment Ownership. (Oct 7, 2019). Accessed on May 9, 2021.