Steven G. Ullmann and Joseph Johnson, Miami Herbert Business School; Shaan Khosla, New York University; Jessica R. Griff, University of Miami Miller School of Medicine and Miami Herbert Business School; Sedona R. Webb, University of Miami School of Nursing and Miami Herbert Business School.
Contact: sullmann@bus.miami.edu
Abstract
What is the message: Improving patient satisfaction is a key outcome sought by U.S. hospitals. Hospitals closely monitor and seek improvements to increase their patient satisfaction scores. However, merely monitoring and measuring standardized patient satisfaction scores does not improve patient satisfaction at a given hospital. Satisfaction can only improve if we monitor and measure the underlying drivers of satisfaction.
What is the evidence: The authors developed a method using social media data and text-mining algorithms to monitor service quality – the underlying driver of satisfaction.
Timeline: Submitted: June 9, 2022; accepted after review: September 22, 2022.
Cite as: Steven G. Ullmann, Joseph Johnson, Shaan Khosla, Jessica R. Griff, Sedona R. Webb. 2022. Improving Patient Satisfaction by Monitoring Hospital Service Quality. Health Management, Policy and Innovation (www.HMPI.org), Volume 7, Issue 3.
Introduction
U.S. hospitals seek to attract new patients as well as build patient loyalty through constant improvement of patient services. To facilitate these objectives, the Hospital Consumer Assessment of Healthcare Providers Survey (HCAHPS) has standardized the evaluation of patient satisfaction, which we term PSAT, after hospitalization through its 29-item questionnaire. These publicly reported PSAT scores are now integrated into the reimbursement framework by the Center for Medicare and Medicaid Services to encourage value-based care for patients. Private insurers also use PSAT measures to negotiate reimbursement contracts with hospitals. These reports have incentivized hospitals to closely monitor and seek improvements in their PSAT scores.1 However, merely monitoring standardized satisfaction scores provided by outside agencies does not improve satisfaction at a given local hospital. To improve satisfaction, we need to ascertain the underlying drivers of satisfaction relevant to each hospital and then measure those drivers to improve satisfaction scores for a given hospital. This is the goal of our paper.
Understanding the drivers of patient satisfaction is critical to creating solutions. Research in the consumer satisfaction literature shows that two fundamental drivers of satisfaction are: perceived quality of the product or service, and the price paid.2 Consumers weigh the quality of the offer against the price they have to pay to determine the value they receive.3 Similarly, in healthcare, perceived quality is driven by the quality of services as perceived by patients. This can include aspects such as perceived adequacy of time spent with physicians and having questions answered. The second determinant of patient satisfaction is perceived value, which becomes muddied in the healthcare setting due to a complex network of payers (government, employer, or individual) and fiscal intermediaries (insurers). As it currently stands, many patients do not know the true cost of their treatment, nor their actual financial responsibility, until after they leave the hospital.
Although the HCAHPS does measure some dimensions of service quality, several limitations of the current method make it unsuitable for measuring service quality dimensions. One issue with the current standardized satisfaction measures is that they do not identify the service quality components relevant to each individual hospital. Second, the HCAHPS measures are not specific enough to enable actionable policies and procedures. Different service dimensions may be prioritized differently for different hospitals. Third, the non-response bias inherent in the survey method used for HCAHPS can yield unreliable metrics. The non-response bias occurs when survey participants ignore survey requests. Patients, or their friends and family, are more likely to respond when they have negative feedback to share.4 Fourth, respondents are confined to the specific questions in the survey and cannot express themselves outside the confines of survey questions. Fifth, there is a considerable delay between the time of survey administration and the reporting of the findings.5 This delay makes it difficult to take timely corrective action. Relatedly, surveys are sent out on a predetermined calendar schedule. This makes it hard to detect service quality problems at the time when they occur. Further, surveys impose a huge cost on hospitals.6
One workaround to the limitations posed by surveys is to use online data. With an increased reliance on real-time online ratings for making healthcare-related decisions, recent literature has analyzed online ratings and comments, and how that data can be efficiently used to supplement traditional surveys like the HCAHPS. Also, text data from social media is a promising alternative to survey data. Social media data is spontaneous, abundant, geographically spread out, less costly than surveys, and shared in real time. Scholars have already used such data to measure patient satisfaction. However, the technique used for satisfaction metrics known as Latent Dirichlet Allocation (LDA) does not suit our goal of measuring service quality for the following reasons: first, LDA is best suited to extract topics from a given corpora, not to measure how much of a given topic is present in a corpus. Second, once topics are extracted, we need subject matter experts to manually label the topics. Finally, LDA does not provide an indication as to whether the topics are toned negatively or positively.
In contrast to LDA, we seek to accomplish the opposite, namely, determining how much of a pre-specified topic (a dimension of service quality) is contained in a corpus. Additionally, we want to ascertain if the text is positive or negative. To achieve these goals, we propose an approach based on natural language processing techniques. First, we consult with personnel from a given hospital to establish the service quality dimensions that are important to them and create lexicons that describe each quality dimension. For example, in our empirical application we consulted with a large Southeastern hospital and developed lexicons for six service dimensions. Second, we accessed social media data from the hospital’s Twitter handle and Facebook page. Third, we developed an algorithm that classifies each sentence collected from the social media data and assigned it to one of the six dimensions of quality. Fourth, we employed another algorithm to quantify the degree of positive or negative sentiment for each of the six dimensions and thereby quantify how well the healthcare provider is performing on those dimensions. We found that, using our approach, hospitals can measure how well they perform on different service quality dimensions. Further, our approach provides time series plots of service dimensions allowing the hospital to use it as control charts for service quality oversight and appropriate adjustments in their processes.
As such, we make three contributions to the healthcare measurement literature. First, we show how to derive service quality measures for individual hospitals. Second, by going beyond topic analysis, we extend the text-mining literature in healthcare. In particular, we show how to measure the amount of information contained in social media for a specific topic and the sentiment strength and positivity or negativity expressed at a given time for that topic. Hospital administrators can use our proposed approach for real-time tracking of service quality and use the information to make continuous changes that align with their goals. They can go beyond tracking service quality and track the feedback to their branding within a relevant geographic market. The remainder of the paper consists of three parts. In the next section, we discuss our method in detail. In the second section, we discuss our data and present our results. In the final section, we conclude the paper with a discussion of our findings.
Method
In this section, we explain our data, method, and results. Our data collection began with interviews of hospital administrators who were asked about the service dimensions that constituted their hospital’s service quality. They identified six service dimensions:
- General access
- Facilities and environment
- Billing and insurance
- Physicians
- Clinical staff
- Non-clinical staff
“General access” is the service dimension that refers to timeliness of care through timely scheduling, admissions, discharge, and transfer to and from other facilities. “Facilities and environment” refers to the parking facilities, location of hospital, noise level, lighting, cleanliness, comfort of ancillary facilities like waiting rooms, food services, gift shop and security. “Billing and insurance” refers to billing and pricing issues. The dimension “Physicians” refers to the services and care physicians provide. The dimension “Clinical staff” relates to the service elements provided by nurses, therapists and other clinical technicians. The dimension “Non-clinical staff” refers to the services provided by other non-direct-care-related staff.
Each dimension is also composed of multiple underlying subdimensions which we call attributes. For example, the “Facilities and environment” category had the attributes of security, parking, noise, location, lighting, gift shop, food services, brochures, comfort, and cleanliness. As in the case of the broad dimensions, we obtained descriptions for the attributes. Then, for each of the dimensions and attributes we extracted the nouns from the description provided. The set of nouns formed our lexicons, which we used to analyze the social media data. We next discuss how we sourced social media data.
Data
We gathered posts and tweets from Facebook and Twitter respectively for the 27-week period from the 23rd week of 2020 to the 49th week of 2020. We selected Facebook and Twitter as our data sources for three reasons. First, these are the most widely used social media platforms by people and companies. Of the roughly 3,200 social media accounts owned by the Fortune 100 companies, about 50% are Facebook accounts, and 30% are Twitter accounts. The second reason for selecting Facebook and Twitter is that they have different demographic users. For example, Twitter has more male users than female users, while Facebook has a balanced gender distribution of users. Lastly, the nature of text varies across platforms. Twitter imposes strict limits to the amount of text that can be written in a “tweet” compared to what can be written in a Facebook post. There are also differences in syntactic and grammatical structure across platforms. Facebook has more topics per post than Twitter has for tweets. Twitter has more concise text than others. Hence aggregating text across these social media platforms is essential. Although it is possible to retrieve posts and tweets using application program interfaces, we were provided the necessary data by the hospital via a third-party vendor named Avatar. Table 1 provides a sample of our data. The first column in Table 1 contains the post, the second contains the words in the post, the third is the cumulative sentiment score of the words, the fourth is the highest similarity score between the words of the post and the words of the different service dimensions and the fifth names the corresponding service dimension
Table 1: Example of Tweets and Calculations and Classification
| Feedback | Tokenized Words | Sentiment Strength | Similarity | Service Dimension |
| Dr. Parekh has an excellent “”bedside manner””: she listens, answers questions clearly, explains what my medical situation is and how we are going to deal with it. She is warm and caring.” | ||||
| Bad billing bad ethics bad experience no help” | [‘bad’, ‘billing’, ‘bad’, ‘ethics’, ‘bad’, ‘experience’, ‘help’] | -1 | 0.519 | Billing And Insurance |
| Excellent institution. Best doctors and nurses. Great attention to the patient’s well-being.” | [‘excellent’, ‘institution’, ‘best’, ‘doctors’, ‘nurses’, ‘great’, ‘attention’, ‘patient’, ‘well’] | 2 | 0.483 | General Feedback For Clinical Staff |
Table 2 shows, for each of the six service dimensions, the mean score, the standard deviation and the count of sentences used to derive the mean and standard deviation. We find that the service dimension “Clinical Staff” has the highest mean, signifying this is where the institution is doing well. The lowest score is for “Billing and Insurance,” reflecting that this is where the institution is perceived to be doing poorly. Importantly, the variance around the mean is large for all dimensions signifying that consistency of said service has not been achieved.
Table 2: Descriptive Statistics
| Service Dimension | Mean Score | Std_Dev | Count |
| General Access | -0.033 | 0.491 | 388 |
| Facilities and Environment | 0.093 | 0.376 | 604 |
| Billing and Insurance | -0.087 | 0.401 | 512 |
| Physicians | 0.026 | 0.431 | 840 |
| Clinical Staff | 0.130 | 0.472 | 1549 |
| Non-Clinical Staff | -0.058 | 0.481 | 331 |
The results in Table 2 give a time-aggregated picture of the service that the hospital provides and does not indicate whether the services were trending upward, downward or level during the analysis period. To do so, we need to analyze how the services changed over time. We do not find any systematic upward or downward trend in the time series plots for most of the service dimensions. This signifies that the service dimensions remained stable through our sample period. In some cases, like the services of the non-clinical staff, we observe changes in the variance over time. One exception to the stable service time trend is the services provided by nurses over time. We see a marginal downward trend in nurse services over the sample period. Importantly, the variance for nurse services increases over time. Further, the increasing variance coincides with declining services. We conjecture that the COVID crisis may have contributed to the decline in nurses’ services.
Conclusion
Patient satisfaction is a crucial outcome of healthcare service. Insurance reimbursements to providers are partially dictated by PSAT scores. However, merely measuring PSAT does not help hospitals improve the services they provide. To improve PSAT, we must monitor aspects of service quality that are the operational drivers of PSAT. Further, unlike current PSAT measurements which are done at specific time periods, we need real-time or at least near-real-time measurements of service quality dimensions for it to benefit hospitals. Such near-real-time measurements will be sensitive to changes in quality levels. Also, we cannot rely on the conventional survey technique to monitor services because running services continually is impractical and cost prohibitive. Finally, standardized surveys do not account for differences in service quality dimensions that could arise across geographic locations.
In this paper, we provided a method that overcomes several of the limitations described previously by using managerial input to develop the relevant service quality metrics for a given hospital. We then developed a natural language-based algorithm and used it on social media data to measure and monitor the service dimensions for the hospital. We contributed to both the theory of PSAT measurement as well as the methodology in practice. Regarding theory, our approach shows how to extract service quality as a distinct construct separate from PSAT. For practitioners, we develop a tool that they can use to monitor the service quality their institutions deliver.
Discussion
A notable feature of our research is the collection and analysis of the abundant social media text data to track the quality of hospital service. Taken together, the positive means in Table 2 for facilities, clinical staff and physicians show that the hospital we analyzed does a better job in these service dimensions compared to general access, billing and non-clinical staff service. The hospital can take these findings and initiate process improvements. At a minimum, the findings can serve as inputs into Plan-Do-Study-Act (PDSA) cycles to gain insight into problem areas. For example, physicians can improve service quality by increasing the time spent with patients or through better communication protocols. As for nurses, their area of improvement was pain management, which may not be fully under the control of nurses. Pain management is now one of the more difficult aspects of medical care to treat and monitor given the significant sensitivity to opiate addiction. The non-clinical staff at the hospital need to improve their listening skills.
We found that patients thought that the noise levels at the hospital were too high. The adverse health effects of noise on patients who are receiving treatments and undergoing recovery are well documented.15 Exposure to high levels of noise disrupts sleep and therefore has negative healing effects for patients. Also, patients using earplugs (to reduce noise effects) in the intensive care unit (ICU) had lowered incidence of confusion — a key symptom of delirium.16 Also, a nocturnal sound-reduction protocol in the ICU found that the incidence of delirium was significantly reduced after the implementation of the protocol.17 The U.S. Environmental Protection Agency recommends sound levels should not exceed 45 dB in hospitals. However, many reports have shown hospital noise levels to be well above this recommendation.
Another service aspect the hospital is weak in is related to insurance coverage and financial implications. This could be a function of the type of patients that the hospital attends to. The complex third-party payer system that we have adopted in the United States may exacerbate the frustration that patients have with billing and insurance. The attributes that scored lowest include price transparency, payment options, and insurance coverage. The dissatisfaction with these attributes is not surprising, considering healthcare costs are usually retroactive, received after discharge, sometimes months later, leading to confusion, surprise costs, and perhaps even catastrophic costs if a patient accidentally sees a provider outside of their insurance network. It also reflects the significant focus on the need for price transparency in healthcare.
In a secondary analysis we wanted to assess the overall patient care the hospital was delivering. As in our previous analyses, we began with descriptive phrases of what the hospital administrators considered overall patient care as determined by interviews with patients. Using the same data source as for our main analysis, we found 1,914 sentences pertaining to the patient care delivered by the hospital. This dimension has 10 underlying attributes. The hospital scores positive on six of the 10. The most positive score is for the attribute “loyalty” and the most negative is for the “length of stay” attribute.
Figure 1 shows the time trend of overall patient care. We find that the overall patient care is stable over the portion of the graph spanning weeks 23 to 32, after which we find a marginal decline. The latter part of this decline coincides with the declining nurse services of the hospital. The variance of the patient care score is stable over time (Figure 1). The figure also reflects that health care organizations are designed to produce the results they achieve. The lack of statistical variation in scores is important; managers shouldn’t chase changes in mean scores, when there is no difference between periods, as changes in the means are noise.
Figure 1: Time Trend for Overall Patient Care
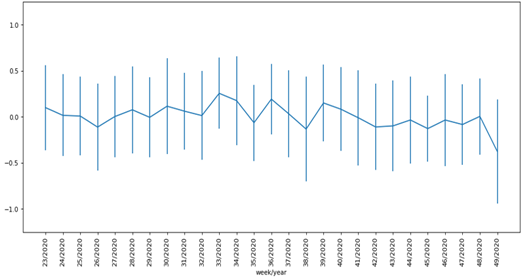
The overall level of patient care shows, that while patients find value in the services that they receive from the hospital, they find problems with the length of stay, pain management, side effects of medications, and follow-up care. Of these, length of stay may be partially under the control of the hospital. The positive loyalty score shows that patients are loyal to the hospital despite the negative scores.
In summary, we find that there are a significant number of service-quality dimensions that are under the hospital’s operational control while there are some, such as side effects of medications, where managed control is more limited. The high variance we see in both the aggregate and temporal analysis is customary in service industries. This is because services, unlike product quality, are delivered by people at the point of consumption.
Implications. The main implication of our study is that the data and analysis we show can form the input of a PDSA cycle. Using time-series graphs as shown in Figure 1, hospitals can identify problems in specific areas when they occur. Then, health system administrators can determine underlying causes of the problems and devise interventions. One example is to test interventions, such as changing staffing ratios, to see the effects on service quality.
Such an approach can provide the data needed for gap analysis where the hospital can ascertain the gap between what they plan to deliver and what they deliver. Further, by examining the attributes that patients really care about, hospital administrators can find out if there are service dimensions that they need to monitor but are not currently doing so.
Future research. Our study provides several avenues for extensions and further research. First, individual hospitals need to set acceptable and achievable levels for each of the service dimensions. Second, researchers can use our approach to initiate a PDSA cycle for different service dimensions and develop a scoring system that helps them track service quality. 18 Third, researchers can study how the improving levels of service increase repeat patient visits and patient retention, which in turn will increase the customer lifetime value of patients. Finally, the variance around the means in Figure 1 implies that much of the feedback is noise and organizations must act only after statistically validating the inputs from our system with external measures of satisfaction, such as PSAT.
References
- Glickman SW, Boulding W, Manary M, et al. Patient satisfaction and its relationship with clinical quality and inpatient mortality in acute myocardial infarction. Circ Cardiovasc Qual Outcomes. 2010;3(2):188-195.
- Fornell C, Johnson MD, Anderson EW, Cha J, Bryant BE. The American customer satisfaction index: nature, purpose, and findings. Journal of marketing. 1996;60(4):7-18.
- Mittal V, Kamakura WA, Govind R. Geographic patterns in customer service and satisfaction: An empirical investigation. Journal of Marketing. 2004;68(3):48-62.
- Tyser A, Abtahi A, McFadden M, Presson A. Evidence of non-response bias in the Press-Ganey patient satisfaction survey. BMC health services research. 2016;16(1):1-6.
- Ranard BL, Werner RM, Antanavicius T, Schwartz HA, Smith RJ, Meisel ZF, et al. Yelp reviews of hospital care can supplement and inform traditional surveys of the patient experience of care. Health Affairs. 2016;35(4):697-705.
- Jordan H, White A, Joseph C, Carr D. Costs and benefits of HCAHPS: final report. Cambridge, MA: Abt Associates Inc. 2005.
- Chakraborty S, Church EM. Social media hospital ratings and HCAHPS survey scores. Journal of health organization and management. 2020;34(2):162-72.
- Campbell L, Li Y. Are Facebook user ratings associated with hospital cost, quality and patient satisfaction? A cross-sectional analysis of hospitals in New York State. BMJ Quality & Safety. 2018;27(2):119-29.
- Timian A, Rupcic S, Kachnowski S, Luisi P. Do patients “like” good care? Measuring hospital quality via Facebook. American journal of medical quality. 2013;28(5):374-82.
- Bardach NS, Asteria-Peñaloza R, Boscardin WJ, Dudley RA. The relationship between commercial website ratings and traditional hospital performance measures in the USA. BMJ quality & safety. 2013;22(3):194-202.
- Greaves F, Laverty AA, Cano DR, Moilanen K, Pulman S, Darzi A, et al. Tweets about hospital quality: a mixed-methods study. BMJ quality & safety. 2014;23(10):838-46.
- Greaves F, Pape UJ, King D, Darzi A, Majeed A, Wachter RM, et al. Associations between Internet-based patient ratings and conventional surveys of patient experience in the English NHS: an observational study. BMJ quality & safety. 2012;21(7):600-5.
- Glover M, Khalilzadeh O, Choy G, Prabhakar AM, Pandharipande PV, Gazelle GS. Hospital evaluations by social media: a comparative analysis of Facebook ratings among performance outliers. Journal of general internal medicine. 2015;30(10):1440-6.
- Brown SW, Swartz TA. A gap analysis of professional service quality. Journal of marketing. 1989;53(2):92-8.
- Cristensen M. The physiological effects of noise: considerations for intensive care. Nursing in Critical Care. 2002;7(6):300-5.
- Rompaey BV, Elseviers MM, Drom WV, Fromont V, Jorens PG. The effect of earplugs during the night on the onset of delirium and sleep perception: a randomized controlled trial in intensive care patients. Critical Care. 2012.16:R3.
- Pol VI, Iterson MV, Maaskant J. Effect of nocturnal sound reduction on the incidence of delirium in intensive care unit patients: An interrupted time series analysis. The effect of earplugs during the night on the onset of delirium and sleep perception: a randomized controlled triel in intensive care patients. Intensive and Critical Care Nursing. 2017.18-25.
- Glickman SW, Boulding W, Roos JM, Staelin R, Peterson ED, Schulman KA. Alternative pay-for-performance scoring methods: implications for quality improvement and patient outcomes. Med Care. 2009;47(10):1062-1068.