Tags: New Research
Lucy W Ma, Stanford University School of Medicine and Graduate School of Business; Shreya A Shah, Stanford University School of Medicine and Graduate School of Business; and Kevin A Schulman, Stanford University School of Medicine and Graduate School of Business, and Clinical Excellence Research Unit, Stanford University School of Medicine
Contact: lucywma@stanford.edu
Abstract
What is the message?This paper investigates the landscape of private equity (PE) investments in healthcare services over the last decade through a quantitative analysis, exploring how PE investment trends have shifted deal types and sub-sectors. We evaluate the correlation and potential impact of external factors, such as the No Surprises Act and the COVID-19 pandemic, on changing investment strategy. Finally, we explore ways to productively align and synergize PE and healthcare incentives and efforts, as well as highlight the research still needed to continue assessing the true impact of evolving PE activity on patient outcomes and cost burden for individuals and the system.
What is the evidence? The study draws on a comprehensive review of academic literature, industry reports, and investment data from Preqin database to offer insights into the changing patterns of healthcare investments, the strategic focus of PE firms before and after 2020, and the future outlook for key stakeholders within the healthcare sector.
Timeline: Submitted: May 17, 2024; accepted after review May 23, 2024.
Cite as: Lucy W Ma, Shreya A Shah, Kevin A Schulman. 2024. Private Equity Investment Trends in Healthcare: A Decade-Long Review and Quantitative Analysis, 2014 to 2023. Health Management, Policy and Innovation (www.HMPI.org), Volume 9, Issue 2.
Introduction
Private equity (PE) has held a longstanding interest in the healthcare sector, driven by the economic resilience of the sector and its continuous need for capital and innovation. Since the 1980s, PE has gained substantial momentum investing in healthcare services and pharmaceutical companies. For example, an early significant deal in 1989 was a $5.1 billion leveraged buyout (LBO) of Hospital Corporation of America (HCA) by Kohlberg Kravis Roberts (KKR), along with Bain Capital and Merrill Lynch. Over the decade following the 2008 economic crisis, sustained low interest rates significantly boosted PE investment activity not only in healthcare but across various industries.1 However, the healthcare sector saw a disproportionate increase in attention from PE firms due to its stable growth prospects and critical role in society.2
Since the early 2000s, there has been a noticeable shift in the allocation of PE funds within the healthcare services sector, specifically among different types of providers, specialists, and care delivery practices. However, by 2020 there was significant concern about some PE investment strategies in healthcare. One business model that received negative public attention was PE-backed clinical practices that remained out-of-network for health plans, allowing the providers to send exorbitant balance bills charging patients for charges for their services. This practice of “surprise medical bills” led to the enactment of the No Surprises Act (NSA) of 2020, which sought to relieve patients of the financial burden when receiving care without prior informed consent about provider fees.3 Concurrently, 2020 saw the outbreak of the COVID pandemic, causing significant economic distress in the United States, followed by a dramatic rise in interest rates in 2022. As a result, the traditional model of leveraged buyouts (LBOs), which was highly reliant on low rates to refinance debt and often necessitated producing “outsized” earnings to repay immense debt, became less viable. Their notable decline also corresponded with an increase in add-on and roll-up deals, reflecting a strategic pivot towards consolidation and operational improvements in existing companies.
These strategic adjustments highlight the adaptability of PE firms to a changing economic and regulatory environment. The purpose of this paper is to analyze the investment patterns of PE in the healthcare sector, particularly focusing on how deal strategies and target sub-industries have shifted before and after 2020, using comprehensive data from Preqin, the leading database on private investment activity and PE financial data. Through this analysis, we aim to understand the impact of economic and regulatory changes on PE investment behaviors and strategies within the U.S. healthcare landscape.
Methods
Dataset
Using data from Prequin, we identified 2,712 PE healthcare deals that had been recorded between January 1, 2014 to December 31, 2023. We first focused on all buyout strategy deals in the timeframe listed above, and included investment deal types including growth, acquisition/buyout, add-on & merger, and other. The “other” category comprised the following deal types: corporate carve out, company formation, joint venture, LP direct, GP stakes, PIPE, private debt, recapitalization, restructuring, and spin-off. Descriptions of the PE’s two primary deal strategies—buyouts and add-ons—and their significance are covered in-depth in the Discussion section. Additional definitions of the other deal strategies included in our dataset can be found in the Appendix (section A.iv). We also included deals with the sectors of Healthcare and Healthcare Specialists listed as the primary industry of the target companies. Finally, we included all deals with the investor and deal locations listed as the United States. We excluded deals that were listed as venture capital strategy, early-stage and late-stage deal types, non-U.S.-based investors or target companies, and had primary industry sectors which were not Healthcare or Healthcare Specialists or were in non-services sectors within the Healthcare category: biopolymers, biotechnology, healthcare IT, medical devices & equipment, and pharmaceuticals.
We also categorized each deal by their sub-industry and specialist service labels in Prequin.
Sub-industries included aesthetic medicine; alternative medicine; clinics/outpatient services; diagnostic, medical & imaging laboratories; emergency services; epidemiology; home healthcare, nursing homes & assisted living; and hospitals.
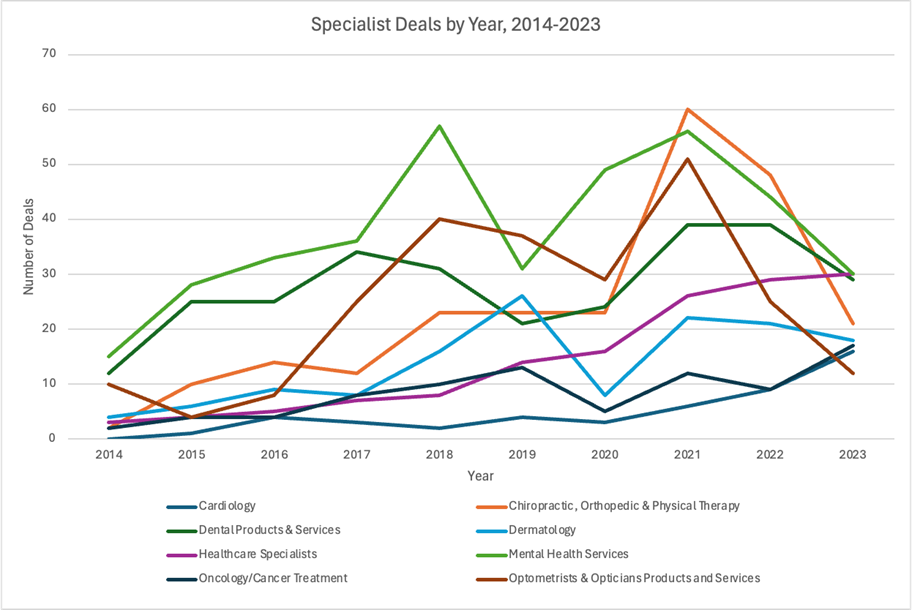
Specialist services were divided into cardiology; chiropractic; orthopedic & physical therapy; dental products & services; dermatology; healthcare specialists; mental health services; oncology/cancer treatment; and optometrists & opticians products and services.
Analysis
After cleaning the data, we first assessed the descriptive statistics of our data to understand the deal types, sub-industries, and specialists that comprised our included deals. Next, we assessed the number of each deal type that occurred per year. Then we segmented the deal types based on whether it was completed before December 31, 2020 or after January 1, 2020 (pre- vs. post-2020).
Given that we are comparing a seven-year period (pre-2020) and a three-year period (post-2020), we compared the proportions of deals, instead of the raw number, in order to normalize our evaluation of the change in deal types between the two periods. We compared the proportions of each sub-industry and specialist service, among all the deals, on a yearly basis and in the pre- vs. post-2020 periods.
We used Pearson’s chi-squared test to evaluate whether the change in the proportion of deal type, sub-industry, and specialist services was statistically significant between the pre- vs. post-2020 periods. All statistical analyses were performed using R version 2023.12 “Ocean Storm.”
Results
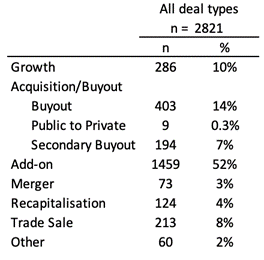
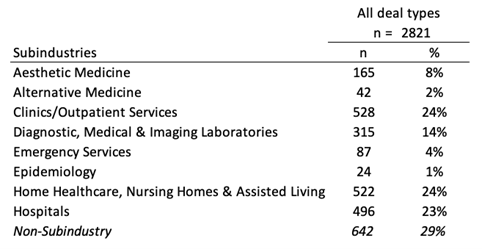
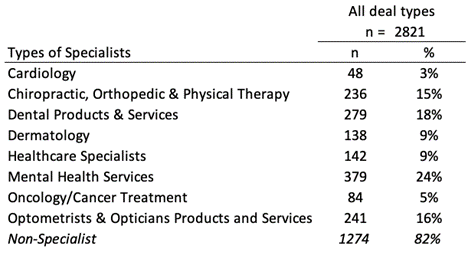
In total, 2,712 unique deals, reflecting 2,821 total deal types, met inclusion criteria for our study (Figure 1). In our cohort, add-on deals were the majority deal type (52%), followed by buyouts (14%) and growth deals (10%) (Table 1a). The median deal size was USD $200 million (interquartile range, IQR $50-700M), and the median enterprise value was $475 million (IQR $120M-1.1B). Deals involving specific sub-industries and specialist services were 71% and 18% of the data, respectively (Table 1b, 1c). Out of the sub-industry deals, nursing homes, clinics/outpatient services, and hospitals were the highest represented categories and had nearly equal proportions (23-24%). Among the deals involving specialist services, mental health services (24%) and dental products and services (24%) comprised the greatest proportion, followed by dental (18%), optometry (16%), and chiropractic and physical therapy practices (15%).
Figure 1 – Flow diagram of deals in study
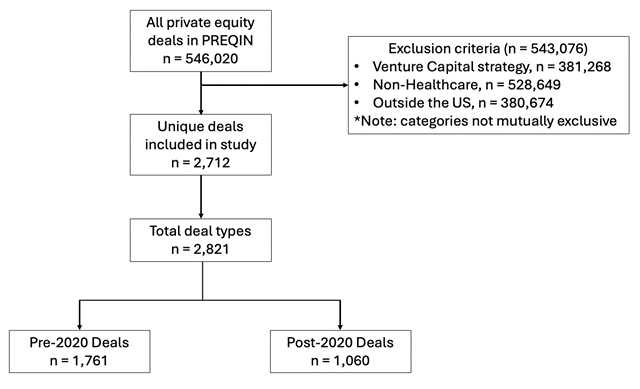
Table 1 – Descriptive statistics of all deals included in study, sorted by: a) deal type, b) sub-industry, c) specialist services
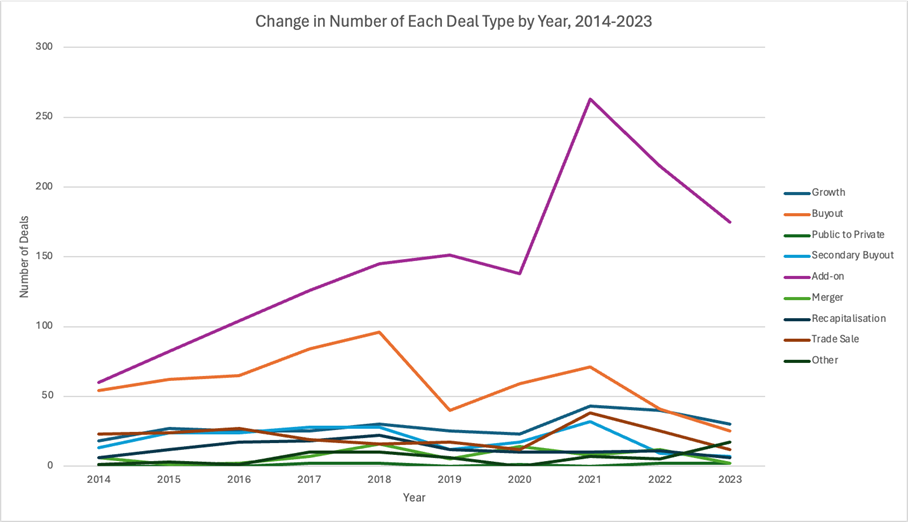
Diving deeper into the deal types, a preliminary analysis of the yearly number of deals by deal type from 2014 to 2023 shows add-ons and buyouts dominating the majority of deals from 2014 to 2020 (Figure 2). Growth drivers of healthcare investments since 2014 included a robust stock market, which increased access to capital and enabled higher company valuations attracting PE investment activity; low interest rates, which reduced cost of debt and decreased financing risk, also enabling investments; the passage of the Affordable Care Act in 2010 driving healthcare reform and consolidation as it promoted pay-for-value over pay-for-volume reimbursement models; Trump’s election and his administration’s business-friendly policies which boosted M&A activity; and the COVID-19 pandemic which accelerated digital health solutions, telemedicine, and overall healthcare delivery expansion and opportunity to break into new geographic sectors and markets..4,5 Around this point, we see a massive rise in add-ons from 2020 to 2021 and then a gradual leveling out back to its previous baseline seen during 2018 to 2020 (Figure 2, purple curve). In contrast, buyouts demonstrate a steady drop-off in 2018 and then again in 2021 through 2023 (Figure 2, orange curve).
Figure 2 – Change in number of each deal type by year from 2014-2023
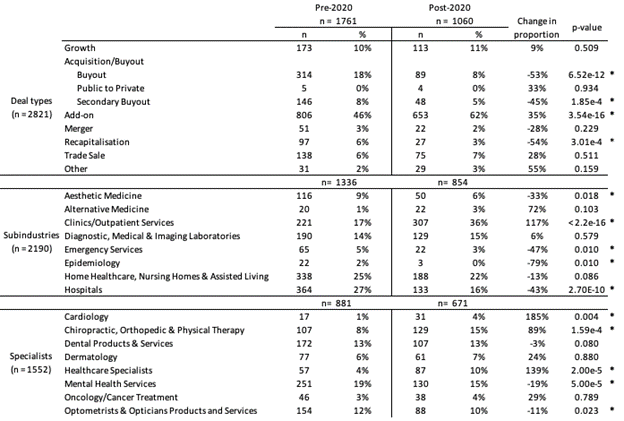
Segmenting the deal types into pre- and post-2020 periods, we initially observe that add-ons consistently represented a significant portion of all deal types in both periods, with buyouts and growth deals following behind (Table 2). While growth, privatization, merger, and other deals account for relatively similar proportions of pre- and post-2020 deal types, there were notable changes in buyout, secondary buyout, add-on, and recapitalization deals, particularly in their proportions between the two periods (-53%, -45%, +35%, and -54% change in proportions, respectively; p < 0.001 for all comparisons).
Furthermore, within sub-industry deals between pre- and post-2020, we found statistically significant decreases in PE investment in aesthetic medicine (-33%), emergency medicine (-47%;), epidemiology (-79%), and hospitals (-43%), as well as a significant increase in clinics/outpatient services (+117%) (p < 0.05 for all). Finally, among the deals involving specialist services, we determined there was a statistically significant increase in PE investment into cardiology (+185%), chiropractic and physical therapy (+89%), and other specialist practices (+139%) and a statistically significant decrease in mental health service (-19%) and optometry practice investments (-11%) (p < 0.05 for all). The yearly number of deals by sub-industry and specialist service can be found in the Appendix (Table A.i-iii, Figure A.i-ii)
Table 2 – Deal types, sub-industries, and specialists by pre- and post-2020 period
Discussion
Healthcare has historically represented an attractive investment opportunity for PE due to its recession-resilient economic growth, legislative efforts to encourage innovation, and growing need for capital. In particular, since the 2008 economic crisis, a consistent slough of years with low interest rates under 3% have drastically increased PE’s investment activity across the board (Figure 3).6,7 Total capital invested by PE has increased as interest rates have dropped, reflecting an inverse correlation of capital invested and Fed rate.6 Of note, over this period, PE firms shifted a greater proportion of their investment funds toward healthcare and away from other sectors. For instance, the proportion of PE capital invested in healthcare leveraged buyouts (LBO) shifted from less than 5% of all LBO funds in 2000 to 14% in 2018.7
In this study, we sought to examine the types of deals that characterized healthcare PE investment over the past decade. Given the lack of transparency and data around PE activity in the healthcare sector, we aimed to better characterize their investment choices.8
Since the 1980s, the most common financing model used by PE in healthcare has been an LBO, in which a PE firm uses a significant amount of borrowed money to buy a majority stake in a healthcare company. The buyout targets of these transactions tend to be healthcare companies with strong stable cash flows and opportunity for potential operational improvements to generate high enough earnings to repay the debt used to acquire the company. Debt can represent a significant portion of payment for the target, sometimes as high as 70%7. The ultimate goal of many LBOs is to sell the acquired company at a higher value than its purchase price, such as to another PE firm, a public offering, or another company.5,7,9
Another investment model is the “platform and add-on” or “add-on and merger” approach, which aims to build value through consolidation of smaller companies into a platform, or a larger, core company.10 Also called “buy and build”, this strategy seeks to create value through synergy, economies of scale, and in some cases, care coordination to address patients’ diverse needs.2 The platform company typically has substantial market share, financial stability, and a scalable business model to integrate “add-on” acquisitions effectively. These add-ons are smaller companies that are integrated into the platform to drive growth, achieve cost efficiencies, diversify services offerings (such as different clinical specialties), or expand market share (which often also increases the PE ownership and platform company’s pricing power or negotiating power with payers).11
In our data analysis, we found a stark drop in buyout deal types after 2020, including secondary buyouts.7 Add-on deals increased in proportion by 35%, accounting for a majority of PE deals in the post-2020 period. Furthermore, the total deal value in healthcare dropped significantly from $151 billion in 2021 to $90 billion in 2022.4,5
Our finding of the decrease in healthcare investments, in particular LBOs, likely converges with two macroeconomic factors. First, as U.S. economic activity recovered after the pandemic, interest rates have increased to multi-decade highs, which means PE funds operating highly leveraged buyouts can no longer depend on a low cost of debt and higher valuations to turn a profit.6 Healthcare deals were very heavily funded by debt, which could include debt multiples of 11x despite Federal Accounting Standards Board recommendations that banks do not loan more than 6x EBITDA.5,12 As a result, investors needed to focus more on actual revenue growth strategy and operational improvements to meet their expected returns. Second, the passage of the No Surprises Act (NSA) in 2020 restricted PE firms from investing in LBOs providing out-of-network healthcare services and then implementing a business model of surprise (balance) billing.3,13,14
In addition to these two major considerations, we recognize other significant concurrent factors that contributed to decreased investments, including negative sentiment and growing criticism, tightening of labor markets necessitating higher wages, instability among banks which restricted financing deals over $1 billion, as well as a growing number of PE firms seeking to directly partner with hospitals, all of which changed PE’s investment foci and activity across the healthcare industry.4
Given the increase in the cost of debt and the limits in revenue resulting from the NSA, PE firms found that they could no longer continue LBOs. Conducting such highly leveraged deals placed excess pressure on PE firms to extract outsized earnings from their deals, a goal that drove incentive misalignment in healthcare, negatively impacting physicians and patients.5,7
Further insight into the influence of the NSA on PE investment activity comes from analyzing the sub-industry and specialist trends. Aesthetic medicine, emergency medicine, and hospitals were all high targets of PE investment because elective medicine tended to be out-of-network, emergency medicine could also be out-of-network (a big focus in roll-ups and surprise billing15–17), and hospitals could be obtained in LBOs and their assets used as collateral for loans. As a result, the correlation of the decline in these three sub-industries with the passage of the NSA in 2020 appears consistent with the logic that the NSA disrupted these sectors’ reliable profitability for PE in the setting of LBOs and investors have shifted their primary focus away from this strategy, at least for now.
Since 2020, we observe a dramatic rise in clinics and outpatient services from 17% to 36%, a statistically significant 117% increase that may be part of PE’s growing shift toward add-on deals. Add-ons are an effective way for PE firms to gain market share and pricing power through consolidation of local and regional players, and PE has traditionally implemented this deal type in anesthesiology and emergency medicine.18 However, with the rise in value-based care (VBC) reimbursement models, PE seems to be following the tides of regulatory shifts, away from LBOs of out-of-network practices and surprise billing, and toward consolidation of specialist outpatient clinics. In fact, PE investment activity in companies focused on VBC over patient volume (traditionally seen in surprise billing models) has increased more than 400% between 2019 and 2021 according to a 2022 McKinsey report.19
Surprisingly, we had expected to observe a much more significant increase in PE investment toward imaging laboratories and decrease in investment toward nursing homes pre- and post-2020 because of the profitability of radiology services (due to increasing technology and imaging usage in medical standard of care, as well as reliably high patient throughput) and the negative outcomes seen in PE-owned nursing homes, respectively.20,21 However, our analysis showed that investment in both of these sub-industries stayed relatively constant before and after 2020, with only a 1% increase in the proportion of laboratory service investments and a slight decrease in the proportion of nursing homes out of all PE healthcare investments. We hypothesize that PE’s stagnant interest in radiology services, compared to rising activity involving clinics and outpatient services, likely derives from shifting reimbursement trends in the market.
Another possible hypothesis is that PE’s motivation to acquire clinics followed the boom in large retailers’ consolidation of physician practices. As big-box retailers and pharmacy chains like Walmart, CVS Health, and Walgreens sought to create integrated care networks and leverage market power, PE likely identified a key opportunity in improving or consolidating previously fragmented primary care physicians and other specialist practices in key geographies or markets and selling them as strategic add-ons. The most prominent examples include the acquisition of practices by firms like One Medical, Iora Health, and Oak Street Health, with peak investment years around 2017 and 2018, and the eventual acquisition of these companies by the aforementioned big-box retailers and pharmacy chains: Amazon and One Medical, CVS and Oak Street Health.4,22–24 Further research and analysis is needed to fully examine the nature of these relationships and the impacts of these retailer acquisitions on patient outcomes and healthcare costs.
The critical question that has been raised in the healthcare PE setting is whether the incentives of funds driven by short-horizon, high-percent ROI can truly be aligned with the needs for improved longitudinal patient outcomes and sustainability of a high-quality care delivery system. We believe that public policies like the No Surprises Act are critical guardrails to prevent adverse strategies by powerful financial entities that can destabilize, even lead to the collapse of, existing healthcare systems.25 However, punitive or restrictive measures alone are not enough; policy that positively reinforces improving sustainability, enhancing quality of care, and decreasing costs is just as important. Finally, continuing research needs to examine how PE ownership might affect outcomes of patients cared for by their portfolio companies.
Limitations
As with any retrospective study, our work has limitations to address. First, our data on PE investments was limited to Preqin, public news articles, and press releases. As a result, there may be a few deals missing from our time period if they were not publicly released or recorded in Preqin. However, given that Preqin is the leading source for private investing activity, we chose to utilize Preqin data over Pitchbook because of the high quality of the database and the ability to conduct much more in-depth and rigorous data analysis external to the platform.
Second, our study’s outcome of interest—change in investment deals pre- and post-2020—is a transition point that marks several significant events, from the NSA to the COVID-19 pandemic to significant macroeconomic factors. As a result, we are not able to fully disentangle the impact that each factor might have had on our analysis. Given the complex landscape of the healthcare industry, we readily acknowledge that all these aspects contributed to the changes we observe in PE investment trends.
Finally, underreporting of PE investments, in particular smaller deal sizes and enterprise values, is a well-known occurrence and limitation of all private finance databases.8 There may be a higher number of PE deals over the last ten years than those included, likely with lower valuations since only acquisitions over $111.4 million must be reported. Nevertheless, Preqin is the most comprehensive database on the private investments that we can readily download and process with more sophisticated data analysis tools, which provides quantitative rigor and critical insight into the factors that we evaluated for association with our outcomes of interest.
References
- MacArthur H, Burack R, Rose G, De Vusser C, Yang K, Lamy S. Private Equity Outlook 2024: The Liquidity Imperative. Bain & Company; 2024.
- Gondi S, Song Z. Potential Implications of Private Equity Investments in Health Care Delivery. J Am Med Assoc. 2019;321(11):1047-1048. doi:10.1001/jama.2019.1077
- Appelbaum E, Batt R. Private Equity Buyouts in Healthcare: Who Wins, Who Loses? Inst New Econ Think. 2020;(Working Paper no. 118). doi:10.36687/inetwp118
- Pauly MV, Burns RL. Equity Investment in Physician Practices: What’s All This Brouhaha? J Health Polit Policy Law. Published online February 7, 2024:11186103. doi:10.1215/03616878-11186103
- Appelbaum E, Batt R. Financialization in Health Care: The Transformation of US Hospital Systems. Center for Economic and Policy Research; 2021.
- Craig W, Watson M. Impact of higher interest rates on private equity. Wellington Management. Published January 22, 2024. Accessed May 2, 2024. https://www.wellington.com/en-us/institutional/insights/impact-of-higher-interest-rates-on-private-equity
- Schulte F. Sick Profit: Investigating Private Equity’s Stealthy Takeover of Health Care Across Cities and Specialties. KFF Health News. https://kffhealthnews.org/news/article/private-equity-takeover-health-care-cities-specialties/. Published November 14, 2022. Accessed March 12, 2024.
- Himmelstein DU, Woolhandler S. The U.S. Health Care System on the Eve of the Covid-19 Epidemic: A Summary of Recent Evidence on Its Impaired Performance. Int J Health Serv. 2020;50(4):408-414. doi:10.1177/0020731420937631
- Zhu JM, Hua LM, Polsky D. Private Equity Acquisitions of Physician Medical Groups Across Specialties, 2013-2016. J Am Med Assoc. 2020;323(7):663-665. doi:10.1001/jama.2019.21844
- Buy-and-Build: A Powerful PE Strategy, but Hard to Pull Off. Bain & Company; 2019. Accessed April 8, 2024. https://www.bain.com/insights/buy-and-build-global-private-equity-report-2019/
- Cooper Z, Scott Morton F, Shekita N. Surprise! Out-of-Network Billing for Emergency Care in the United States. J Polit Econ. 2020;128(9):3626-3677. doi:10.1086/708819
- Adler L, Hannick K, Lee S. High Air Ambulance Charges Concentrated in Private Equity-Owned Carriers. USC-Brookings Schaeffer Initiative for Health Policy. https://healthpolicy.usc.edu/brookings-schaeffer/high-air-ambulance-charges-concentrated-in-private-equity-owned-carriers/. Published October 13, 2020. Accessed April 8, 2024.
- Richman Barak, Hall Mark, Schulman Kevin. The No Surprises Act and Informed Financial Consent. N Engl J Med. 2021;385(15):1348-1351. doi:10.1056/NEJMp2109971
- Appelbaum E. Envision Bites the Dust. Center for Economic and Policy Research. https://www.cepr.net/envision-bites-the-dust/. Published July 10, 2023. Accessed April 11, 2024.
- Anderson GF. From “soak the rich” to “soak the poor”: recent trends in hospital pricing. Health Aff Proj Hope. 2007;26(3):780-789. doi:10.1377/hlthaff.26.3.780
- Richman Barak D., Hall Mark A., Schulman Kevin A. Overbilling and Informed Financial Consent — A Contractual Solution. N Engl J Med. 2012;367(5):396-397. doi:10.1056/NEJMp1205225
- Kincaid E. Envision Healthcare Infiltrated America’s ERs. Now It’s Facing A Backlash. Forbes. https://www.forbes.com/sites/elliekincaid/2018/05/15/envision-healthcare-infiltrated-americas-ers-now-its-facing-a-backlash/. Published May 15, 2018. Accessed April 11, 2024.
- Adler L, Milhaupt C, Valdez S. Measuring private equity penetration and consolidation in emergency medicine and anesthesiology. Health Aff Sch. 2023;1(1):qxad008. doi:10.1093/haschl/qxad008
- Abou-Atme Z, Alterman R, Khanna G, Levine E. Investing in the New Era of Value-Based Care. McKinsey & Company; 2022. Accessed April 12, 2024. https://www.mckinsey.com/industries/healthcare/our-insights/investing-in-the-new-era-of-value-based-care
- Lopez J. Private Equity Backed Radiology Considerations for the Radiology Trainee. Curr Probl Diagn Radiol. 2021;50(4):469-471. doi:10.1067/j.cpradiol.2020.11.012
- Gupta A, Howell ST, Yannelis C, Gupta A. Does Private Equity Investment in Healthcare Benefit Patients? Evidence from Nursing Homes. SSRN Electron J. Published online November 12, 2020. doi:10.2139/ssrn.3537612
- Fottler MD, Malvey DM. The Retail Revolution in Health Care. Bloomsbury Publishing USA; 2010.
- Pifer R. Amazon closes $3.9B buy of One Medical. Healthcare Dive. Published February 22, 2023. Accessed May 17, 2024. https://www.healthcaredive.com/news/amazon-closes-39b-buy-of-one-medical/643245/
- Crawford TJ. CVS Health completes acquisition of Oak Street Health. Published May 2, 2023. Accessed May 17, 2024. https://www.cvshealth.com/news/company-news/cvs-health-completes-acquisition-of-oak-street-health.html
- Khushi A. KKR-backed Envision Healthcare files for bankruptcy. Reuters: Deals. Published May 15, 2023. Accessed April 11, 2024. https://www.reuters.com/markets/deals/kkr-backed-envision-healthcare-files-bankruptcy-2023-05-15/
Appendix
Table A.i – Change in number of each deal type, year on year, 2014-2023 (correlates with Fig 2)
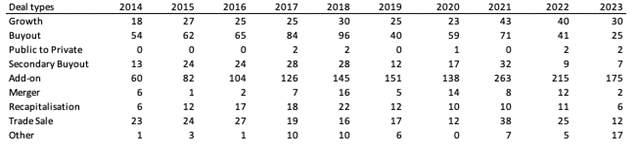
Table A.ii – Change in number of sub-industry deals, year on year, 2014-2023
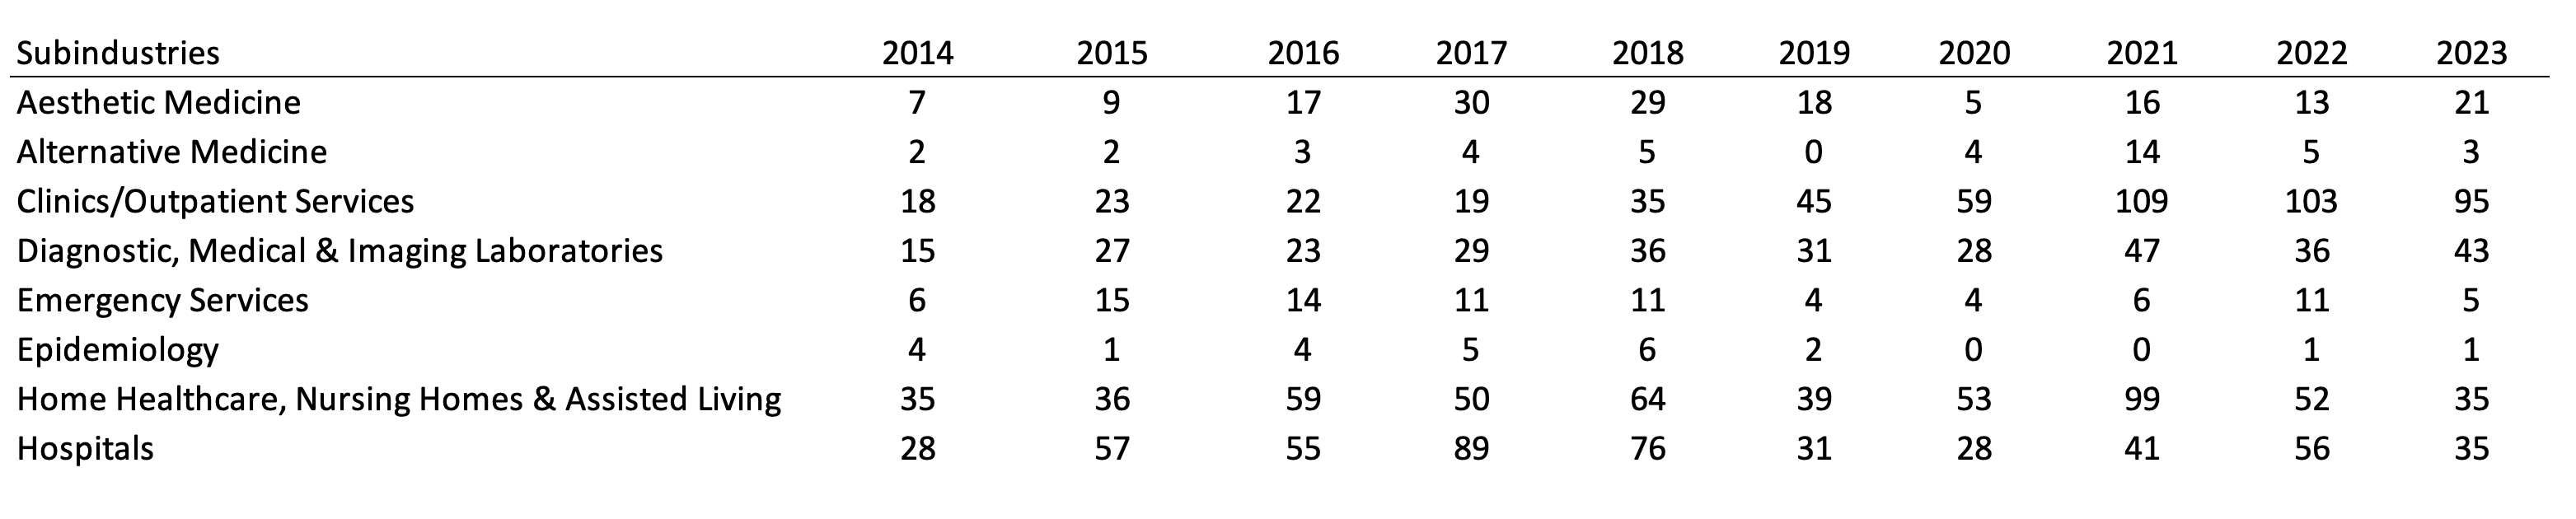
Figure A.i – Change in number of sub-industry deals, year on year, 2014-2023
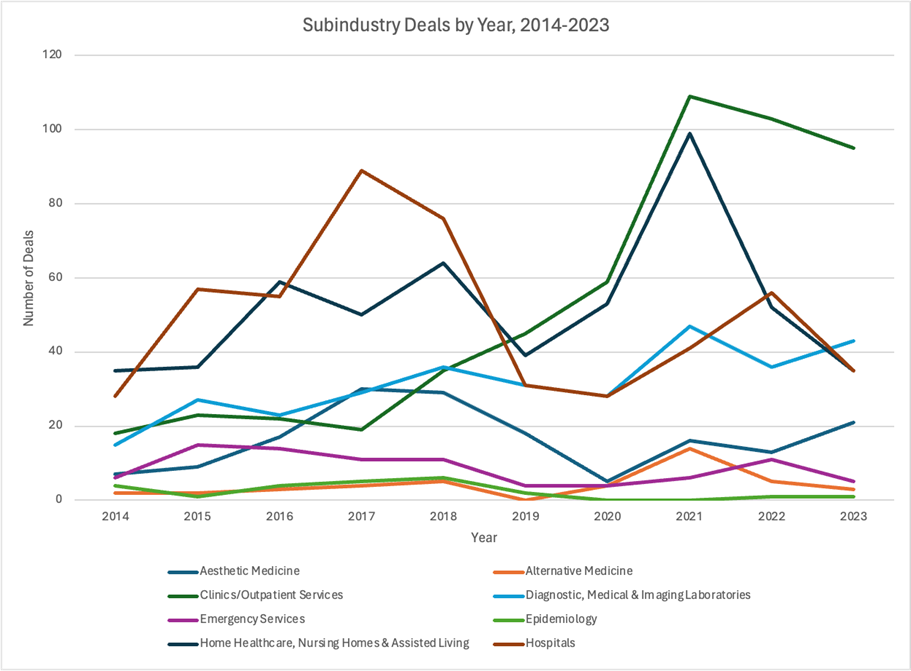
Table A.iii – Change in number of specialist deals, year on year, 2014-2023
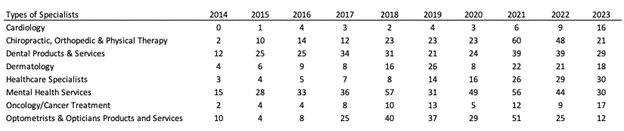
Figure A.ii – Change in number of specialist deals, year on year, 2014-2023
A.iv Definitions of “Other” Deal Types
- Public to private or privatization involves purchasing all outstanding shares of a publicly traded company to take it private, thereby removing it from the stock exchange.
- A secondary buyout is when one PE firm sells a portfolio company to another PE firm. This allows the selling firm to realize returns on its investment while providing the acquiring firm with an opportunity to further grow and optimize the business before pursuing its own exit strategy.
- Corporate carve outs involve PE firms acquiring a target company and dividing it up to sell for parts.
- Company formation strategy is when PE firms create new companies from scratch.
- Joint venture is when two or more PE firms partner to combine resources and also share risk, leverage strengths, and achieve mutual growth objectives.
- In LP direct strategy, limited partners (LPs) make direct investments into companies, bypassing traditional PE fund structures and retaining greater control over their own investments.
- GP stakes involve investing in the general partners (GPs) of private equity firms, acquiring minority stakes in the management companies themselves.
- Private investment in public equity (PIPE) is investing directly in publicly traded companies through the purchase of shares at a discounted price, often combined with warrants or convertible securities, which enables public companies to raise capital efficiently while PE firms can acquire equity stakes with potential upside.
- Private debt is when PE firms provide loans or credit to companies that are not typically served by traditional banks, often in the form of senior debt, mezzanine financing, or distressed debt, and PE firms profit off interest payments.
- Recapitalisation involves restructuring a company’s debt and equity mixture to optimize its capital structure, often replacing old debt with new debt and terms.
- Restructuring strategy is when PE firms reorganize a company’s operations, finances, or structure to improve its performance, enhancing its value and returning it to profitability.
- Lastly, spin-offs are the separation of a subsidiary from its parent company to create an independent entity and in turn aim to enhance its operational efficiency, growth potential, and profitability.