
Tags: Case Study
Amanda Wong, Tanzina Khan, Melissa Florus, Milagros Ramos, Miguel Rodriguez, Yi Zhuang, and Tolga Aydinliyim, Zicklin School of Business, Baruch College, CUNY
Contact: Tolga.Aydinliyim@baruch.cuny.edu
Abstract
What is the message? Unplanned readmissions remain a persistent challenge for U.S. healthcare systems, generating substantial financial and operational problems in post-discharge care coordination. Traditional follow-up reminder programs typically apply uniform outreach across patients despite substantial heterogeneity in readmission risk, leading to inefficient allocation of limited care management resources. By studying the effectiveness of AI-assisted targeted intervention systems in reducing 30-day hospital readmissions among patients with diabetes, we demonstrate that the operational value of AI in healthcare lies not in perfect prediction but in data-driven prioritization and efficient allocation of scarce post-discharge resources.
What is the evidence? Using a large publicly available multi-hospital diabetes dataset, we integrate descriptive, predictive, and prescriptive analytics within a unified operational decision framework. We first estimate patient-level readmission risk through interpretable predictive models, then embed these risk scores into simulation-based decision models to assess alternative outreach policies. Our results show that follow-up outreach to the highest-risk 10–20% of patients in our sample captures approximately 25% to 40% of the total achievable reduction in readmissions. Beyond this range, marginal benefits decline sharply, indicating diminishing returns to uniform outreach to all patients.
Keywords: Artificial Intelligence, Hospital Operations
Timeline: Submitted June 1, 2026; accepted after review July 1, 2026.
Cite as: Amanda Wong, Tanzina Khan, Melissa Florus, Milagros Ramos, Miguel Rodriguez, Yi Zhuang, Tolga Aydinliyim. 2026. Operational Effectiveness of AI-Assisted Targeted Intervention System Design in Healthcare: Reducing 30-Day Readmission Rates For Diabetes Patients. Health Management, Policy and Innovation (www.HMPI.org). Volume 11, Issue 2.
Introduction, Background, Motivation
Healthcare systems in the United States continue to face mounting pressure to improve patient outcomes while operating under increasingly constrained financial and operational conditions. One persistent challenge is unplanned hospital readmissions, particularly among patients with chronic conditions such as diabetes. Readmissions within 30 days of discharge are associated with poorer outcomes, fragmented care, and substantial costs, and they trigger financial penalties under value-based reimbursement programs. Despite standardized discharge planning and follow-up procedures, readmission rates remain high, suggesting that existing approaches are not sufficiently tailored to patient-level risk and operational realities. In 2020, approximately 3.85 million 30-day all-cause readmissions occurred in the United States, with an average cost of $16,300 per readmission, representing the aggregate cost exceeding $62 billion annually [1]. Among Medicare beneficiaries alone, the readmission rate reached 17.0 per 100 index admissions [1].
Post-discharge interventions such as follow-up calls and patient reminders are resource-intensive. Staff time, coordination effort, and financial cost limit the feasibility of applying these interventions uniformly. As a result, healthcare organizations must decide whom to target, when to intervene, and how intensively to deploy limited outreach resources. Traditional reminder systems often adopt a one-size-fits-all approach, providing the same level of follow-up regardless of risk. This can lead to inefficiencies, with resources directed toward low-risk patients while higher-risk individuals may not receive sufficient or timely support.
Advances in data analytics and artificial intelligence (AI) provide an opportunity to redesign reminder systems in a more targeted and operationally efficient manner. AI-driven predictive models can estimate patients’ relative risk of readmission at discharge, enabling health systems to prioritize outreach efforts toward those most likely to benefit. Importantly, the value of such models does not depend on near-perfect prediction. In readmission settings, outcomes are influenced by unobserved factors such as social determinants of health and post-discharge environments that are not captured in standard datasets. Even so, modestly informative risk rankings can guide decisions under capacity constraints.
In this essay, we examine the effectiveness of a targeted intervention approach compared to a more resource-intensive uniform approach, using an AI-assisted reminder system to reduce 30-day hospital readmissions among patients with diabetes. We integrate descriptive, predictive, and prescriptive analytics within a single operational framework: first characterizing patterns of readmission, then generating individualized risk scores, and finally embedding these scores into a prescriptive simulation-based model to evaluate alternative follow-up policies. Applying this framework to a large publicly available multi-hospital dataset, we find that targeting the top 10–20% of risk-ranked patients captures 25–40% of the total achievable reduction in 30-day readmissions while requiring substantially fewer interventions than universal outreach. Beyond this threshold, additional coverage yields diminishing marginal returns.
These findings suggest that the operational value of AI in healthcare lies not in perfect prediction, but in enabling disciplined prioritization and more efficient allocation of limited resources. The managerial implication is clear: hospitals can improve outcomes and protect financial performance by embedding interpretable risk ranking into post-discharge workflows rather than expanding blanket outreach programs. Importantly, existing risk assessment tools often focus on identifying high-risk patients, similar to sepsis alerts or traditional readmission prediction models. The novelty of this paper is not simply predicting readmission risk, but translating risk scores into an operational decision rule that helps leaders determine how much outreach to provide, which patients to prioritize, and where marginal returns begin to decline. This shifts AI from a prediction tool into a practical resource allocation framework for healthcare operations.
This paper proceeds in four parts. First, in Section 2, we review practical evidence and extant literature on readmissions, reminder systems, and AI-enabled risk stratification. Then, in Section 3, we present a case study, which uses sample diabetes readmission data to generate patient-level readmission risk scores and assesses the effectiveness of targeted follow-up intervention to reduce readmissions. In Section 4, we present a replication study using a large publicly available data set to derive a Pareto curve of readmission reduction versus intervention coverage under various model assumptions to confirm robustness of our main policy finding. Section 5 concludes with a discussion of managerial and policy trade-offs.
Literature Review
Readmissions as a Policy and Operational Challenge
Hospital readmissions represent a major financial and operational challenge for healthcare systems. Section 3025 of the Affordable Care Act of 2010 established the Hospital Readmissions Reduction Program (HRRP), with payment reductions for hospitals with excess 30-day readmissions taking effect on October 1, 2012 [2]. Under HRRP, Centers for Medicare and Medicaid Services reduces base operating diagnosis-related group payments for hospitals with higher than expected 30-day readmissions, which target six conditions: acute myocardial infarction, heart failure, pneumonia, chronic obstructive pulmonary disease, coronary artery bypass graft surgery, and elective knee or hip arthroplasty. Payment reductions are capped at 3% of base Medicare inpatient payments. Although diabetes is not a directly targeted HRRP condition, diabetic patients are disproportionately represented in HRRP-covered admission due to high rates of comorbid heart failure, AMI, and pneumonia. Since HRRP’s implementation, the Medicare Payment Advisory Commission (MedPAC) has documented sustained reductions in readmission rates for targeted conditions [3]. Unplanned 30-day readmissions impose substantial costs on hospitals and payers, with the average cost of readmission ($16,300) exceeding the average costs of the index admission ($14,500) by about 12.4%. [1] These costs contribute billions of dollars to the national healthcare spending each year and represent a significant component of preventable hospital expenditure under value-based reimbursement models. Beyond their financial burden, readmissions indicate care fragmentation, poor discharge planning, medication mismanagement, or inadequate follow-up during the post-discharge period [4, 5]. The literature on hospital readmissions emphasizes that reducing avoidable readmissions requires more than standardized discharge procedures or uniform post discharge outreach. As healthcare organizations operate under value based payment models, there is growing emphasis on using data to identify where risk is concentrated and where limited resources can be deployed most effectively to improve outcomes.
Reminder Systems as a Common Intervention
The post-discharge period is a particularly vulnerable phase of care, during which patients face an elevated risk of medication errors, care discontinuation, and unmet clinical needs [4]. In a foundational study of nearly 12 millions Medicare beneficiaries, [6] found that one in five patients was readmitted within 30 days of discharge, and that half of nonsurgical patients were hospitalized without having seen an outpatient physician for follow up. Inadequate medication reconciliation, fragmented communication between outpatient providers and patients, and gaps in discharge education all contribute to preventable admissions [4, 5]. Post-discharge reminder systems, particularly follow-up telephone calls, have been widely studied as mechanisms to reduce preventable hospital readmissions and improve care transitions. In a comprehensive systematic review and meta-analysis of randomized controlled trials, [7] examined a broad range of interventions to reduce readmission, including telephone follow-up and transitional care programs. Evidence from randomized trials suggests that post-discharge interventions can reduce 30-day readmission rates, though the magnitude and consistency of these effects vary substantially. Similarly, [8] evaluated a large-scale post-discharge telephonic outreach program involving over 30,000 patients enrolled in chronic disease management programs. Their findings showed that patients who received a follow-up call within 14 days of discharge were significantly less likely to be readmitted within 30 days than those who did not receive a call. The study also revealed important patterns to note: the median time to readmission was 11 days, with nearly one-third of readmissions occurring within the first 7 days and over half occurring within the first 14 days, underscoring the operational importance of timely post-discharge outreach.
Heterogeneity in Readmission Risk and Intervention Effectiveness
Despite promising evidence that post-discharge interventions can reduce readmissions, the magnitude and consistency of these effects vary substantially across studies. [7] reported marked heterogeneity in outcomes, with more intensive and tailored interventions generally producing stronger effects than simpler, uniform approaches. This variability suggests meaningful differences in baseline patient risk and responsiveness to follow-up support. When reminder systems are applied uniformly across heterogeneous patient populations, their impact may be diluted: low-risk patients may receive unnecessary outreach, while higher-risk individuals may require more sustained or time-sensitive intervention.
The broader literature on readmission risk factors reinforces this conclusion. Patients who experience readmission consistently exhibit greater clinical complexity, including longer hospital stays, higher numbers of diagnosed conditions, and greater prior healthcare utilization than those who are not readmitted [9, 10]. Several validated risk prediction tools exist for hospitalized diabetic patients, specifically the Diabetes Early Readmission Risk Indicator, which used 13 clinical and sociodemographic variables to estimate 30 day readmission risk and has been externally validated across multiple academic medical centers [11, 12]. However, these tools focus on identifying high risk patients rather than translating risk into structured decision rules under capacity constraints, leaving an open operational question of how outreach intensity and timing should be calibrated to predicted risk. These findings indicate substantial heterogeneity in post-discharge risk across patient populations. In addition to variation in patient characteristics, studies document uneven implementation of follow-up outreach across groups. Not all discharged patients can be reached in a timely manner due to incorrect contact information, delayed discharge notifications, and competing organizational priorities [8]. Operational constraints and incomplete clinical information at discharge further complicate efforts to identify and support high-risk individuals [9]. Together, these patterns suggest that one-size-fits-all follow-up strategies may dilute impact when applied across heterogeneous populations. Taken together, the literature indicates that the effectiveness of reminder systems depends not only on whether outreach occurs, but on how well intervention intensity aligns with patient-level risk. These findings motivate the development of risk-stratified approaches that allocate follow-up resources in a targeted and operationally efficient manner.
Operational Constraints and the Case for Targeted Decision Making Using AI
Despite evidence supporting the effectiveness of follow-up calls, both the literature and current practice reveal persistent operational challenges. [8] demonstrated that not all discharged patients could be reached in a timely manner due to incorrect contact information, delayed discharge notifications, or competing organizational priorities. Staffing limitations further constrain the number of calls that can be delivered, forcing healthcare organizations to implicitly prioritize which patients receive outreach and when. In many settings, these prioritization decisions rely on coarse heuristics or clinical judgment rather than systematic, data-driven approaches. At its core, the challenge is not whether follow-up calls are beneficial, but how limited outreach capacity should be allocated across heterogeneous patient populations. Hospitals operate under fixed staffing, budget, and time constraints, requiring trade-offs between breadth and intensity of intervention. In this setting, the central managerial question becomes how to deploy scarce post-discharge resources in a way that maximizes clinical impact and financial performance.
Recent advances in AI and predictive analytics offer a pathway to address these limitations. A growing body of research demonstrates that AI-enabled predictive analytics can improve risk stratification, support earlier intervention, and enhance patient outcomes by informing more precise clinical and operational decisions [13]. Rather than replacing existing reminder modalities, such systems augment them by estimating patients’ relative likelihood of readmission at discharge, enabling targeted allocation of follow-up resources toward those most likely to benefit. Importantly, their operational value lies not in perfect prediction but in ranking patients by relative risk. While follow-up calls can reduce readmissions on average, their impact is diluted when applied uniformly without regard to heterogeneity in risk or capacity constraints [7, 8]. This perspective reframes reminder systems as adaptive decision-making tools that translate AI-generated insights into targeted, scalable post-discharge interventions.
Building on its role in clinical decision support, AI is increasingly influencing diagnostics assessment and border health system management practices. Nonetheless, ethical and organizational issues cannot be overlooked making responsible AI deployment challenging. For example, [14] evaluated the performance of AI chatbots in preliminary diagnosis of maxillofacial pathologies, and found at times it could be accurate, but a provider is very much needed to confirm all of the results. It underscored the promise yet the existing limitations AI currently has. Although chatbots may be able to assist with initial screening or patient education, this reinforces the need for clinical oversight. At the organizational level, [15] identified operational opportunities and ethical challenges that exist with AI implementation in nursing management, noting better workload allocations and staffing optimization, yet having big concerns with bias and accountability.
Case Study: Reducing 30-Day Readmission Rates for Diabetes Patients
This essay builds directly upon a team project completed by a team of Executive MBA students in Healthcare Administration as part of the Healthcare Analytics and Quality course. The project focused on designing a data-driven framework to design a follow-up reminder system to reduce 30-day hospital readmissions among patients with diabetes by targeting those identified as high-risk for readmissions.
The Details And The Findings Of The Underlying Project
The original case study explored how predictive modeling and simulation could inform operational decision-making under realistic capacity constraints. Rather than pursuing highly complex machine learning approaches, the project intentionally emphasized interpretability and practical implementation, reflecting real-world hospital discharge workflows. The central question was not simply whether readmissions could be predicted, but whether even modest predictive signals could meaningfully improve the allocation of limited post-discharge resources.
Using a subset of a publicly available dataset of 30,529 hospitalized diabetic patients, the team developed a forward stepwise logistic regression model to estimate individual readmission risk at discharge. The model identified five clinically plausible predictors of readmission risk, which we summarize and operationalize in Table 1. These factors are extended length of stay, greater comorbidity burden as measured by number of diagnoses, more complex diabetes medication regimens, prior inpatient utilization, and missing A1C documentation. Although predictive discrimination was modest (AUC = 0.554), the resulting risk scores provided meaningful relative ranking of patients. This reinforced an important operational insight: in readmission settings characterized by substantial unobserved heterogeneity, the value of prediction lies in risk stratification rather than precise individual-level accuracy.
Table 1. Operational Risk Screening Signals at Discharge
| Risk Signal | Why It Matters Operationally | Availability at Discharge | Example Trigger Rule |
| Extended Length of Stay | Prolonged hospitalization often reflects greater illness severity and care complexity | Known at time of discharge | Top quartile of length of stay |
| High Number of Diagnoses | Greater comorbidity burden increases risk of post-discharge complications | Recorded in encounter summary | Above median number of diagnoses |
| Multiple Diabetes Medications | Complex medication regimens increase risk of non-adherence or dosing errors | Medication reconciliation complete at discharge | 2 or more diabetes-related medications |
| Prior Inpatient Utilization | Recent hospital use indicates unstable health trajectory | Historical utilization data available in EHR | 1 or more inpatient admission(s) in prior year |
| Missing A1C Documentation | May signal fragmented care or incomplete chronic disease monitoring | Lab data available at discharge | A1C not recorded during encounter |
From an implementation perspective, the model results translate into a small set of operationally observable discharge signals that can support rapid risk screening. Patients with longer length of stay, higher comorbidity burden, more complex diabetes medication regimens, recent inpatient utilization, and missing A1C documentation consistently ranked higher on predicted readmission risk. Importantly, each of these signals is available at or before discharge, allowing risk-based outreach decisions to be embedded directly into existing discharge workflows. Rather than requiring complex algorithmic interpretation at the bedside, these variables can serve as practical triggers for targeted follow-up when outreach capacity is constrained.
The simulation component of the course project demonstrated how these risk scores could be embedded within prescriptive decision frameworks to evaluate alternative follow-up strategies. By modeling time-based readmission dynamics and capacity-constrained outreach policies, we found that interventions targeting the patients with the highest (i.e., top 20%) risk scores could reduce 30-day readmissions from 11.77 percent to 9.15 percent while lowering total combined costs under reasonable assumptions. These results directly inform the present submission by providing empirical evidence that AI-assisted reminder systems do not require high predictive accuracy to generate operational value. Instead, their impact emerges from integrating modest risk stratification with structured, time-sensitive intervention design.
The Replication Study
To generalize the findings of the class project, we replicate the same analysis on the entire data set of 30,529 hospitalized diabetic patients using more advanced predictive models. We also challenge several simplifying assumptions that underlie the simulation phase of the original project and demonstrate the robustness of the main findings regarding the effectiveness of targeted intervention.
Data Set And Descriptive Statistics
The dataset used in this analysis is derived from the UCI “Diabetes 130-US Hospitals” database [1], which contains administrative and clinical information from inpatient encounters across 130 U.S. hospitals between 1999 and 2008. The unit of analysis is the individual inpatient encounter rather than a unique patient, meaning that patients with multiple admissions during the study period may appear more than once in the dataset. This structure reflects real-world hospital operations, where discharge decisions are made at the encounter level.
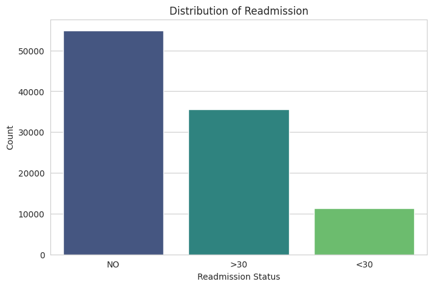
Figure 1. Outcome variable of interest in the data set
[1] The data set is publicly available at which is publicly available at https://archive.ics.uci.edu/dataset/296/diabetes+130-us+hospitals+for+years+1999-2008# .
The dataset includes demographic variables (age category, gender, race), utilization measures (length of stay, number of diagnoses, number of procedures, prior inpatient visits), and indicators of diabetes management (medication status, insulin use, and A1C testing). The primary outcome of interest is 30-day hospital readmission. In the original dataset, readmission status is categorized as “readmitted within 30 days,” “readmitted after 30 days,” or “no readmission.” As illustrated in Figure 1, approximately 11.3% of patients were readmitted within 30 days of discharge, which indicates that while readmissions are not the majority outcome, they represent a meaningful operational concern.
Predictive Models
In the next phase of the analysis, we built predictive models to estimate each patient’s likelihood of being readmitted within 30 days of discharge. We compared several modeling approaches, including logistic regression, a balanced version of logistic regression, random forests, and gradient boosted models. Because readmissions are relatively rare, we paid particular attention to whether the models could meaningfully distinguish higher risk patients from lower risk patients, rather than focusing only on overall accuracy.
Figure 2 presents the receiver operating characteristic (ROC) curves comparing logistic regression, class-balanced logistic regression, random forest, and gradient boosted (XGBoost) models. The standard logistic regression and class-balanced logistic regression models achieved the highest performance, with an area under the curve (AUC) of approximately 0.66. Random forest and XGBoost models yielded slightly lower AUC values (0.63 and 0.64, respectively).
Figure 2. ROC Curves and the AUC values for all four considered prediction models
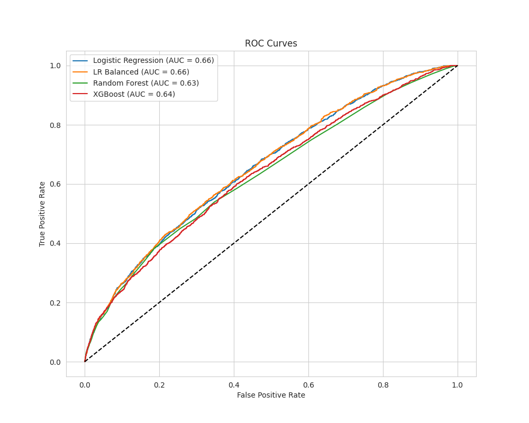
We ultimately selected the balanced logistic regression model as our primary predictive model. While its predictive discrimination was similar to more complex models, it offers two advantages that matter in practice: it performs well at identifying higher risk patients in an imbalanced setting, and it produces outputs that are easy to interpret as we summarize in Table 2.
Table 2. Statistically significant features of the balanced logistic regression model we use to compute risk scores
| FACTORS INCREASING READMISSION RISK | ||
| Feature | Coefficient | Interpretation |
| # prior inpatient visits | 0.246 | Frequent hospitalizations increase readmission risk |
| # prior ER visits | 0.054 | Frequent emergency visits increase readmission risk |
| # diagnoses at encounter | 0.058 | Many diagnoses indicate higher clinical complexity |
| Heart failure (ICD-9: 428) | 0.270 | Cardiac comorbidity increases readmission risk |
| Diabetes medication prescribed | 0.148 | Proxy for how chronic and severe the disease is |
| No medication change made | 0.194 | Adjustment may have been warranted but not acted on |
| Caucasian race | 0.125 | Likely proxy for care access disparities |
|
FACTORS REDUCING READMISSION RISK |
||
| Feature | Coefficient | Interpretation |
| No insulin prescribed | -0.399 | Stable glycemic management at discharge |
| Insulin dose unchanged | -0.336 | No adjustment needed; controlled at discharge |
| No glipizide prescribed | -0.381 | Stable medication regimen |
| Glipizide dose unchanged | -0.257 | No adjustment needed |
| Pneumonia (ICD-9: 486) | -0.310 | Different readmission trajectory |
| Respiratory symptoms (ICD-9: 786) | -0.289 | Different readmission trajectory |
Although our predictive model does not achieve high individual-level predictive precision, it demonstrates meaningful capacity to rank patients by relative readmission risk. In operational settings where the goal is to prioritize limited outreach resources rather than generate perfect predictions, this level of discrimination is sufficient to support targeted intervention policies. Importantly, the comparable performance of simpler models reinforces the managerial value of interpretability, as discharge teams can more easily understand and implement risk-based decision rules derived from logistic regression.
Simulation Models To Prescribe Decisions
In this stage of the analysis, we used the predicted readmission probabilities from the balanced logistic regression model as patient level “risk scores.” These scores allow us to rank patients by relative risk at discharge, which is the key input needed to decide who should be prioritized for follow-up outreach. Using these risk scores, we build simulation models to assess the percentage reduction in 30-day readmission rates at various intervention coverage levels.
The specific mechanics of the simulation model of the follow-up calls involve re-calibrating each patient type’s 30-day predicted readmission probability, i.e., risk score, if they are included among those to receive a follow-up call on day 15 of the 30-day window. In such cases, that patient’s 30-day readmission probability is revised as their (remaining) 15-day readmission probability, an idea we refer to as “resetting the clock.” We simulated intervention policies on a sample of 10,000 discharged patients whose features are drawn from the data set we described in subsection 3.2.1, as one simulation run, and reported statistics averaged over 1,000 simulations in Figure 3. The vertical axis denotes the reduction in readmission rates (in percentage points) relative to zero coverage, i.e., when no patients receive follow-up calls. The horizontal axis indicates intervention coverage, i.e., percentage of patients with the highest predicted risk scores whose readmission clocks are reset on day 15 after discharge.
Figure 3. The trade-off between intervention coverage and expected reduction in 30-day readmissions
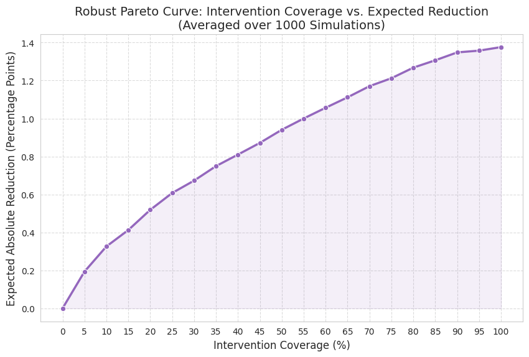
Figure 3 shows that if reminders are provided to 100% of discharged patients, i.e., uniform reminders, the model estimates a maximum absolute reduction of approximately 1.4 percentage points. However, the majority of this improvement can be achieved with substantially lower coverage. Targeting only the top 10% highest-risk patients captures roughly 25% of the total achievable reduction, yielding an estimated 0.35 percentage-point improvement. Expanding coverage to the top 20% of high-risk patients captures approximately 40% of the total potential reduction, corresponding to a 0.56 percentage-point improvement. Beyond this threshold, additional coverage yields progressively smaller marginal gains, indicating clear diminishing returns.
This pattern demonstrates that carefully targeted reminder strategies can approximate the benefits of uniform reminders at a fraction of the intervention volume, reinforcing the operational value of risk-based prioritization under capacity constraints. This is because the largest gains come from focusing on a relatively small group of high risk patients. Expanding the intervention to include lower-risk patients still improves outcomes, but with diminishing returns. This finding reinforces the practical value of using risk scores to guide limited resources. In other words, a targeted reminder strategy can capture much of the benefit of universal outreach at a fraction of the cost and effort.
Robustness Checks
In this subsection, we relax some of the underlying assumptions in the original replication study to demonstrate that our main finding, i.e., targeted data-driven intervention generates disproportional benefits in reducing 30-day readmissions, is robust. First, we note that we obtain the Pareto curve in Figure 3 by assuming that a follow-up intervention on day 15 after discharge would be successful with 25% probability. This implies a linear hazard function according to which failures, i.e., readmissions take place. The robustness checks adopt a more structurally flexible model, wherein each patient’s readmission risk is characterized by a Weibull survival function calibrated to their individual predicted readmission probability. This model still captures the original replication study, i.e., a linear hazard function (Weibull k=2) with a full clock reset to day 0 when the follow-up intervention takes place. In what follows, we assess sensitivity in two robustness studies, which we label RC1 (Partial Clock Reset) and RC2 (Nonlinear Hazard).
RC1: Sensitivity to Intervention Effectiveness (Partial Clock Reset)
The original replication study assumes the intervention fully resets the readmission hazard clock to day 0, the most optimistic scenario. To assess the sensitivity to this assumption, we vary how far back the intervention on day 15 resets the clock, sweeping from day 0, 5, 10 and 15, representing a full reset, two partial resets, and no reset (i,e., the intervention has no effect on the hazard trajectory).
Figure 4. Robustness of the main finding with limited effectiveness of follow-up interventions on day 15
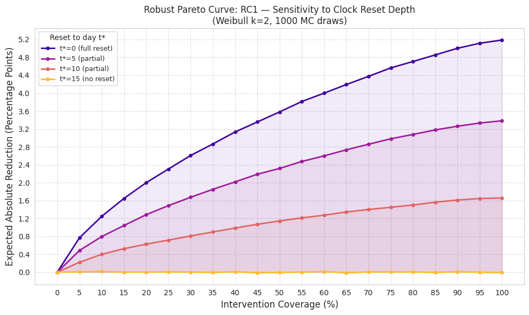
Figure 4 shows that across all reset depths, the Pareto curves exhibit consistent decreasing marginal returns to intervention coverage levels, confirming that the qualitative policy finding is robust. The absolute magnitude of reduction scales with reset depth: a full reset (to day 0) yields up to 5.2pp (percentage points) reduction at 100% coverage, while no reset (to day 15) yields zero. The partial reset cases (to day 5 and day 10) bracket a plausible range of realistic interventions. Importantly, across all three non-trivial cases (reset to day 0, 5 and 10), targeting the top 10-20% of highest-risk patients consistently captures approximately 25-50% of the maximum achievable reduction, confirming that the key policy recommendation is robust to the assumed depth of intervention effectiveness.
RC2: Sensitivity to Hazard Shape (Nonlinear Hazard)
The original replication study assumes a linearly increasing hazard function (Weibull shape k=2). To test whether this assumption drives the results, we vary the shape parameter k from 1.5 to 3.0, where k<2 implies a sub-linear hazard (risk decelerates over time, concentrating in day 1-15) and k>2 implies a super-linear hazard (risk accelerates, concentrating in days 16-30). We report comparative results in Figure 5.
Figure 5. Robustness of the main finding with non-linear hazard functions
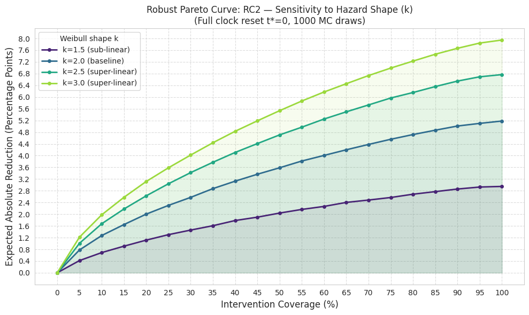
Across all values of k, the Pareto curves retain the same concave shape, confirming the robustness of the qualitative finding. The magnitude of reduction varies meaningfully with k: super-linear hazards (k=2.5, 3.0) yield larger reductions to up to 8pp at 100% coverage for k=3.0, while the sub-linear case (k=1.5) yields the smallest benefit. This pattern is intuitive: when the hazard is super-linear, readmission risk concentrates in the later days of the 30-day window, a clock reset at day 15 intercepts the highest-risk period, making the intervention more effective. Conversely, when the hazard is sub-linear, most risk has already materialized before day 15, leaving less for the intervention to prevent. Critically, across all four curves, targeting the top 10–20% of highest-risk patients consistently captures approximately 25% to 40% of the maximum achievable reduction, confirming that the key policy recommendation is robust to the assumed shape of the readmission hazard.
Conclusion
This study integrates descriptive, predictive, and prescriptive analytics to evaluate the operational effectiveness of AI-assisted reminder systems in reducing 30-day hospital readmissions among patients with diabetes. Rather than treating prediction as an end in itself, we embed risk stratification within a structured decision framework that explicitly accounts for limited outreach capacity and real-world discharge workflows.
Across simulations, targeted intervention policies consistently outperform uniform reminder strategies when evaluated relative to resource intensity. Specifically, directing follow-up outreach to the top 10% to 20% highest-risk patients captures approximately 25% to 40% of the total achievable reduction in 30-day readmissions, while requiring substantially fewer interventions than universal outreach. Beyond this range, marginal gains diminish rapidly, indicating that expanding outreach to lower-risk patients yields progressively smaller returns per unit of effort.
These findings suggest that the operational value of AI in healthcare lies not in perfect prediction, but in enabling disciplined prioritization under constraints. For healthcare leaders, the actionable implication is clear: embed interpretable risk ranking into discharge workflows, define tiered outreach protocols based on risk thresholds, and continuously monitor performance, fairness, and model drift over time. By translating modest predictive signals into structured allocation rules, hospitals can improve patient outcomes and protect financial performance under value-based reimbursement without expanding blanket outreach programs.
References
- Jiang, H. J., & Hensche, M. K. (2023). Characteristics of 30-day all-cause hospital readmissions, 2016-2020 (HCUP Statistical Brief #304). Agency for Healthcare Research and Quality. https://hcup-us.ahrq.gov/reports/statbriefs/sb304-readmissions-2016-2020.jsp
- Centers for Medicare & Medicaid Services. (2024). Hospital Readmissions Reduction Program (HRRP). U.S. Department of Health and Human Services. https://www.cms.gov/medicare/payment/prospective-payment-systems/acute-inpatient-pps/hospital-readmissions-reduction-program-hrrp
- Medicare Payment Advisory Commission. (2018). Mandated report: The effects of the Hospital Readmissions Reduction Program. In Report to the Congress: Medicare and the health care delivery system (Chapter 1). https://www.medpac.gov/wp-content/uploads/import_data/scrape_files/docs/default-source/reports/jun18_ch1_medpacreport_rev_nov2019_v2_note_sec.pdf
- Forster, A. J., Murff, H. J., Peterson, J. F., Gandhi, T. K., & Bates, D. W. (2003). The incidence and severity of adverse events affecting patients after discharge from the hospital. Annals of Internal Medicine, 138(3), 161–167. https://doi.org/10.7326/0003-4819-138-3-200302040-00007
- Kripalani, S., LeFevre, F., Phillips, C. O., Williams, M. V., Basaviah, P., & Baker, D. W. (2007). Deficits in communication and information transfer between hospital-based and primary care physicians: Implications for patient safety and continuity of care. JAMA, 297(8), 831–841. https://doi.org/10.1001/jama.297.8.831
- Jencks, S. F., Williams, M. V., & Coleman, E. A. (2009). Rehospitalizations among patients in the Medicare fee-for-service program. New England Journal of Medicine, 360(14), 1418–1428. https://doi.org/10.1056/NEJMsa0803563
- Leppin, A. L., Gionfriddo, M. R., Kessler, M., Brito, J. P., Mair, F. S., Gallacher, K., Wang, Z., Erwin, P. J., Sylvester, T., Boehmer, K., Ting, H. H., & Montori, V. M. (2014). Preventing 30-day hospital readmissions: A systematic review and meta-analysis of randomized trials. JAMA Internal Medicine, 174(7), 1095–1107. https://pmc.ncbi.nlm.nih.gov/articles/PMC4249925/
- Harrison, P. L., Hara, P. A., Pope, J. E., Young, M. C., & Rula, E. Y. (2011). The impact of postdischarge telephonic follow-up on hospital readmissions. Population Health Management, 14(1), 27–32. https://pmc.ncbi.nlm.nih.gov/articles/PMC3128446/
- Kansagara, D., Englander, H., Salanitro, A., Kagen, D., Theobald, C., Freeman, M., & Kripalani, S. (2011). Risk prediction models for hospital readmission: A systematic review. JAMA, 306(15), 1688–1698. https://pubmed.ncbi.nlm.nih.gov/22009101/
- Zhang, S., Cardona, K., Liu, M., Davis, M., Hayward, R., Heisler, M., & Singh, K. (2020). Assessing the impact of social determinants of health on predictive models for potentially avoidable 30-day readmission or death. PLOS ONE, 15(6), e0235064. – https://doi.org/10.1371/journal.pone.0235064
- Rubin, D. J., Handorf, E. A., Golden, S. H., Nelson, D. B., McDonnell, M. E., & Zhao, H. (2016). Development and validation of a novel tool to predict hospital readmission risk among patients with diabetes. Endocrine Practice, 22(10), 1204–1215. https://doi.org/10.4158/E161391.OR
- Rubin, D. J., Recco, D., Turchin, A., Zhao, H., & Golden, S. H. (2018). External validation of the Diabetes Early Re-admission Risk Indicator (DERRI™). Endocrine Practice, 24(6), 527–541. https://doi.org/10.4158/EP-2018-0035
- Sattar, H., Dixon, D., Moros, N., Kesireddy, S. R., Ahsan, H., Lakkimsetti, M., Doshi, D., Fatima, M., Sadhu, K., & Hassan, M. J. (2024). Unveiling the influence of AI predictive analytics on patient outcomes: A comprehensive narrative review. Cureus, 16(5), e59954. https://doi.org/10.7759/cureus.59954
- Guler, R., & Yalcin, E. (2025). Performance of AI chatbots in preliminary diagnosis of maxillofacial pathologies. Medical Science Monitor, 31, e949076. – https://pmc.ncbi.nlm.nih.gov/articles/PMC12257980/
- Katebi, A., et al. (2025). Artificial intelligence and nursing management: Opportunities, challenges, and ethical considerations—A scoping review. Journal of Nursing Management. Advance online publication. https://pubmed.ncbi.nlm.nih.gov/40771284/
[1] The data set is publicly available at which is publicly available at https://archive.ics.uci.edu/dataset/296/diabetes+130-us+hospitals+for+years+1999-2008# .