Arzi Adbi, Department of Strategy & Policy, National University of Singapore Business School; Chirantan Chatterjee, Science Policy Research Unit, University of Sussex Business School, Hoover Institution (Stanford University); Economics, IIM Ahmedabad; Indian Health Outcomes, Public Health and Economics Research Centre; Pranjali Sharma, IIM Ahmedabad
Contact: c.chatterjee@sussex.ac.uk
Abstract
What will you learn? How can framing impact the preferences for Covid-19 vaccines? We find a relative importance of individual-benefit framing. Participants under individual-benefit frame were 6.7% more likely to consume vaccine and expressed 6.8% greater willingness to consume relative to those under societal-benefit frame, with this effect being greater for those who had never consumed adult vaccine in the past. While we did not find a significant difference between the deep and moderate discount frame on average, the effect of deep discount was prominent on the strata of individuals that had never consumed any adult vaccine in the past. Herein, individuals who received the deep-discount framing were 10.0% more likely to state their preference to consume vaccine and expressed 10.8% greater willingness to consume vaccine relative to those under the moderate-discount framing. These findings have practical implications for policymakers engaged in designing strategies to reduce vaccine hesitancy and save lives as the world continues to struggle to recover from Covid-19 with increasing vaccine mandates around the world.
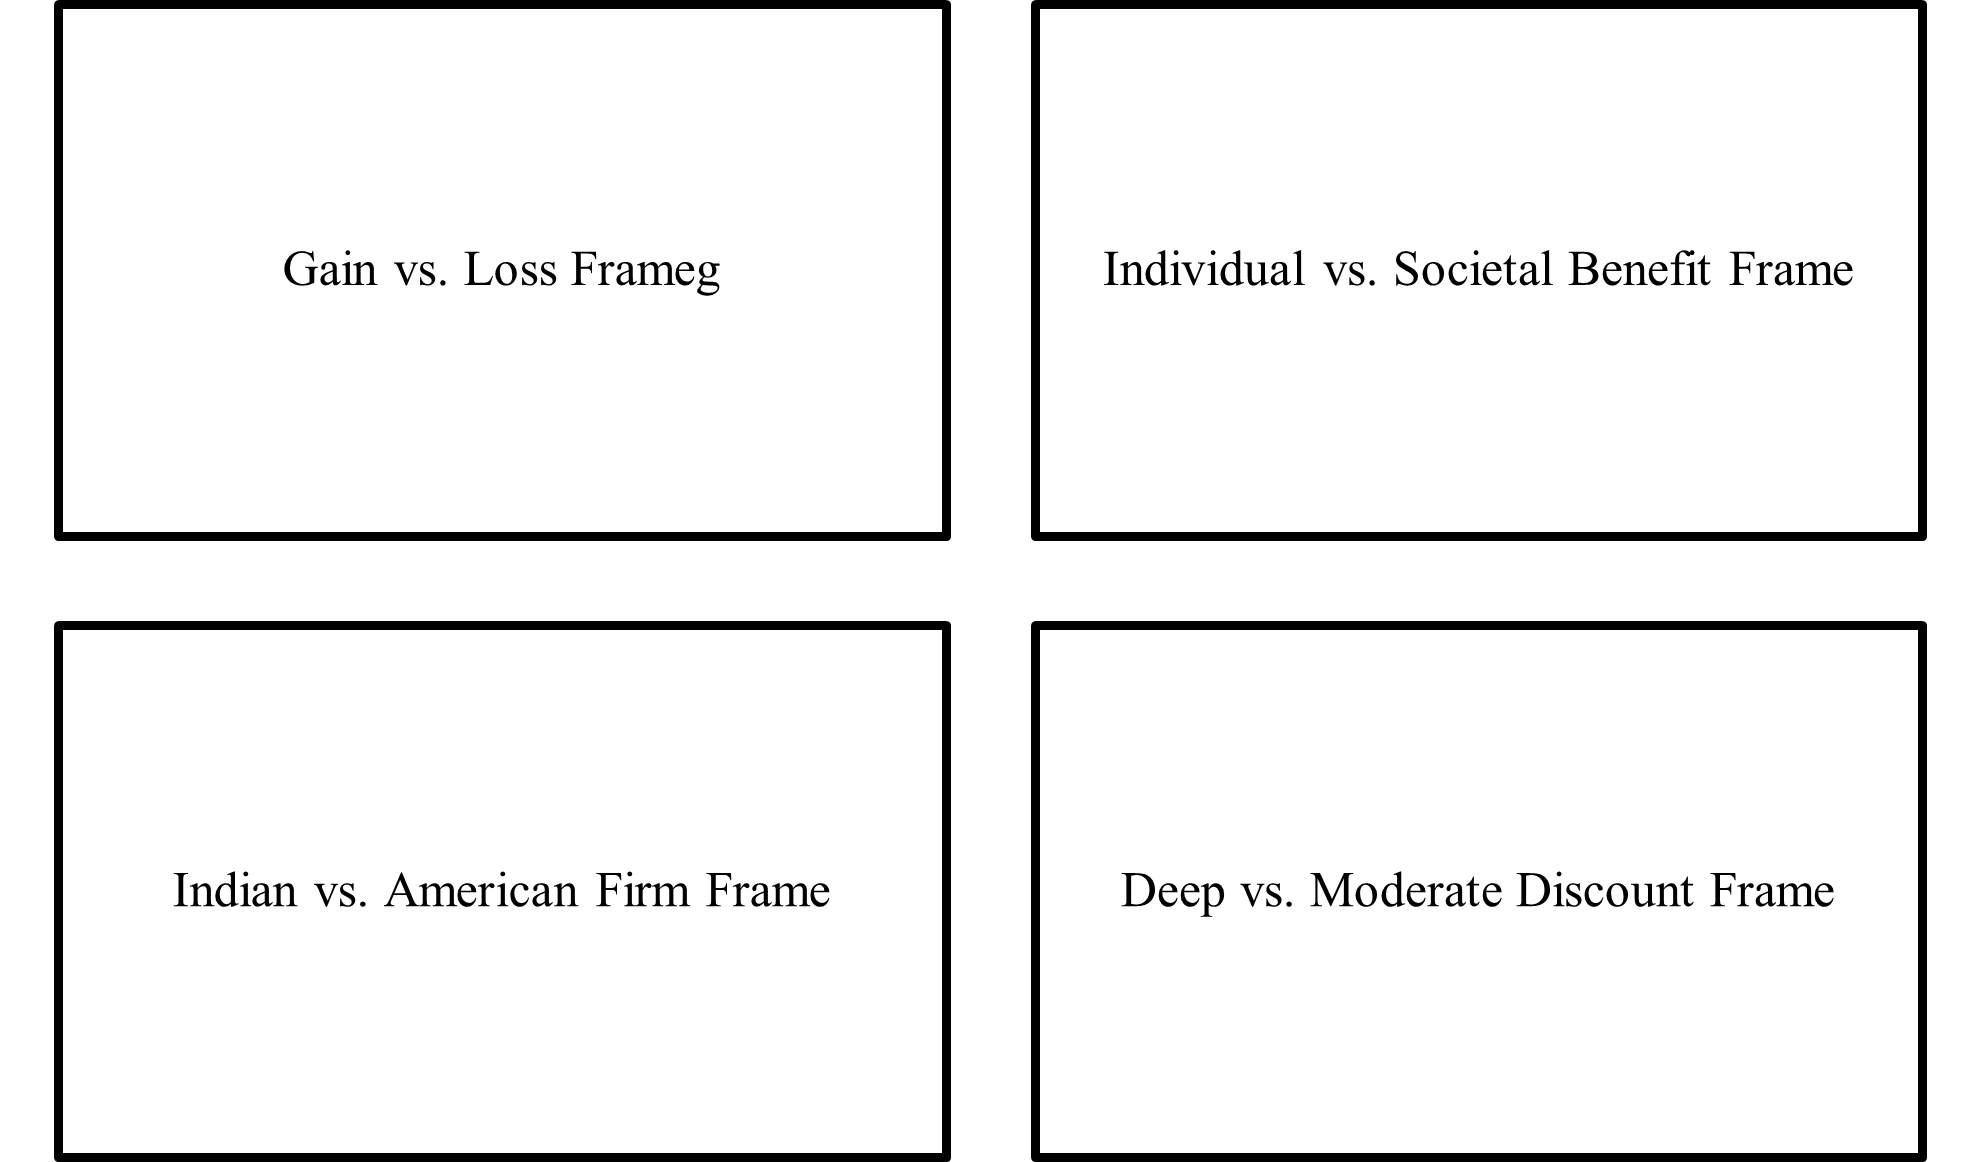
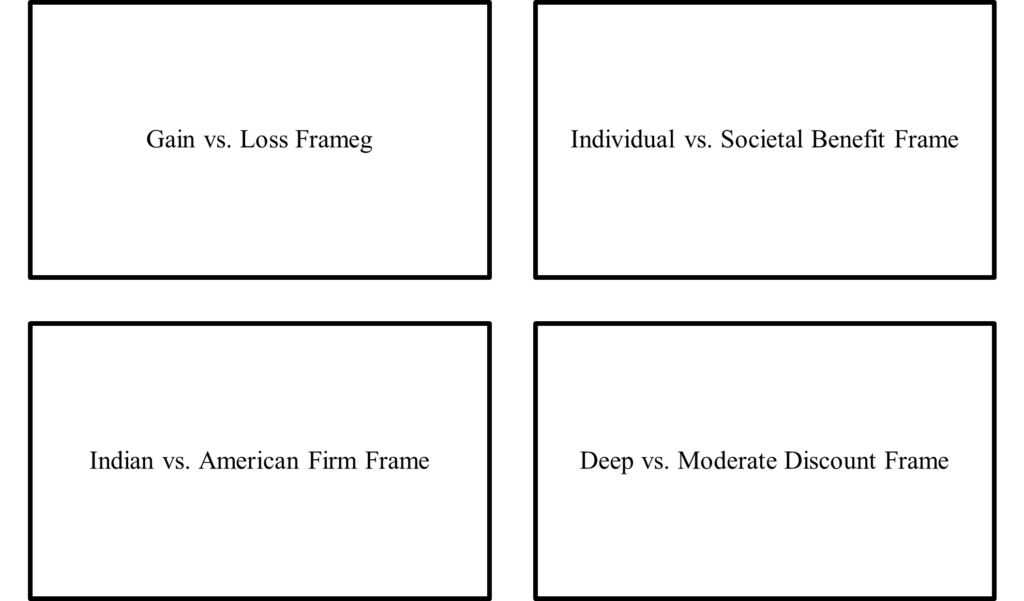
What is the evidence? We partnered with India’s leading healthcare platform (Tata 1mg) to conduct a preregistered experiment (in a pre-vaccine available world in December 2020) with 2,000 Indians to investigate this question. Specifically, we investigate the effect of randomly assigned gain-vs.-loss frame, individual-vs.-societal benefit frame, Indian-vs.-American vaccine manufacturing firm, and deep-vs.-moderate pricing discount frame and examine their impact on stated preferences for vaccine consumption.
Links: Supplementary Evidence
Timeline: Submitted: October 2, 2021; accepted after review: November 5, 2021,
Cite as: Arzi Adbi, Chirantan Chatterjee, Pranjali Sharma. 2022. Framing & Covid-19 Vaccine Hesitancy: Experimental Evidence from India, Health Management, Policy and Innovation (www.hmpi.org), Volume 7, Issue 1.
Acknowledgements: We are grateful for financial support from ICICI Bank Chair in Strategic Management Grant (10000406) at IIM Ahmedabad, Visiting Fellowship at Hoover Institution, Stanford University Grant (226294), and National University of Singapore Start-Up Research Grant (R-313-000-143-133). We do not have any conflicts of interest. We acknowledge helpful comments from Robin Banerjee, Constantin Blome, Jeremy Hall, Mario Macis, Anup Malani, Don Metz, Aparna Mittal, Manoj Mohanan, Tarun Rambha, Malcolm Reed, Emilia Simeonova, Yogesh Simmhan, Abhay Singhal, Dinesh Thakur. Support from Dr. Anuj Saini, Dr. Varun Gupta and their team at Tata 1mg is gratefully acknowledged. This study was approved by Institutional Review Board at IIM Ahmedabad (approval number IIMA IRB 2020-40).
Introduction
As of October 1, 2021, more than 4.5 million people have died during the ongoing coronavirus pandemic (Worldometers 2021). Deaths continue, particularly in India (officially with 0.448 million deaths), a developing country with over 1.3 billion people. The pandemic particularly wreaked havoc in its second wave in April-May 2021, as the country battled a severe shortage of potential solutions (Bhuyan 2021, Cohen 2021, Vaidyanathan 2021). Although several factors, including both supply-side and demand-side constraints (Dupas 2011, Niewoehner and Staats 2021, Norton et al. 2021, Taylor and Xiao 2014), are at play, research suggests that a critical challenge in the area of public health stems from vaccine hesitancy among the population, a complex problem to solve worldwide, but especially in developing countries, despite the deleterious consequences of not consuming the vaccine (Yamin and Gavious 2013, Bloom et al. 2014, Kobayashi et al. 2021, Aziz et al. 2021, Lazarus et al. 2021, Milkman et al. 2021). This is particularly so in the second half of 2021 as vaccine mandates spread worldwide.
Prior research has documented that improving the reliability of services on the supply side increases vaccination rates to some extent, but even small incentives on the demand side have been found to create a large positive impact on reducing vaccine hesitancy in resource-constrained areas (Banerjee et al. 2011). A related strand of growing research suggests the possibility for healthcare practitioners, public health professionals including managers and policymakers, to reduce vaccine hesitancy with simple yet scientifically informed framing nudges (e.g., see Benartzi et al. 2017 for a recent review). For instance, studies have found that simply reminding high-risk people to get vaccinated (Regan et al. 2017), getting them to form implementation intentions by committing to a specific time (Milkman et al. 2011), and framing messages designed to specifically leverage insights from behavioral sciences, can increase vaccination rates among the population (Yokum et al. 2018, Luyten et al. 2019, Ward et al. 2020, Hornsey et al. 2020, Đorđević et al. 2021).
Our goal in this study is to extend this growing body of research by examining whether certain frames with subtle yet important variation in information provision (Haaland et al. 2021, Nyhan et al. 2014, List et al. 2021) may lead to greater willingness to consume the COVID-19 vaccine. To do so, we partnered with a leading online pharmacy and healthcare platform in India (Tata 1mg.com). We conducted a large-sample, preregistered experiment designed to investigate how individuals under distinct frames may differ in their stated preference to consume the COVID-19 vaccine (Vasquez et al. 2021). In particular our experiment was conducted in December 2020 to make sure that we have an uncontaminated view on vaccines before they were actually available in any part of the world. A large body of work based on framing theory suggests that how information is framed may lead to a nontrivial impact on how people perceive and react to the information (Tversky and Kahneman 1981, 2000, Chong and Druckman 2007, Levin et al. 1998). Thus, framing can influence individual preferences. While it is known that messages with distinct frames may influence intentions, it remains unclear whether some frames may be more effective than others in the context of the individual decision-making process regarding vaccination. This is precisely the research question we undertake by conducting a preregistered experiment in India.
A core dilemma in individual decision-making to vaccinate or not emanates from the interplay between the potential risks of adverse side-effects (Diestre et al. 2020, Larson et al. 2014, Masic and Gerc 2020), the affordability and ease of accessibility of vaccines (Arifoglu et al. 2012, Dupas and Miguel 2011, Inamdar and Alluri 2021, Kremer and Glennerster 2011), and the perceived advantages from free-riding, a phenomenon where the choice to free ride and exploit the vaccination behavior of others may increase vaccine hesitancy of an individual (Yamin and Gavious 2013). Prospect theory (Kahneman and Tversky 1979) suggests that presenting the same information but with variation in gain versus loss framing of the message may alter people’s preferences (Tannenbaum et al. 2015). Therefore, we examine whether loss-framed messages may lead to greater willingness to consume vaccine than gain-framed messages. In theory, as Yamin and Gavious (2013) propose, two core motivations may underlie an individual’s decision-making process regarding vaccination: self-interest and the interest of society (Fine and Clarkson 1986). Therefore, we examine whether the individual-benefit and societal-benefit emphasis frames may lead to differential willingness to consume vaccine. To further examine the crucial role of self-interest and the contemporary challenge of vaccine affordability, we also investigate the extent to which a deep-discount pricing frame may lead to greater willingness to consume vaccine than a moderate-discount pricing frame.
In our preregistered experimental investigation, any individual who on December 6 and 7, 2020 visited the website of Tata 1mg.com, India’s largest online pharmacy and healthcare platform, was offered the opportunity to participate in a healthcare-related survey. After obtaining their consent to participate in the survey, the participants were randomly assigned to distinct framing conditions: gain versus loss frame, individual versus societal benefit frame, Indian versus American firm as the country of origin (of the vaccine manufacturing firm) frame, and deep versus moderate discount pricing frame. In our preregistered experiment, we included the Indian versus American firm frame to abductively explore the possibility of whether an individual’s decision-making regarding vaccination may be driven by certain aspects of the liabilities of foreignness faced by foreign firms—i.e., the social and cultural barriers that may limit the embeddedness of foreign firms in the local environment of the host country (Zaheer 1995).
The findings of our preregistered experimental investigation reveal that certain frames are much more effective than others in leading to a greater preference and willingness to consume the vaccine. The results imply that the individual-benefit frame may encourage vaccine adoption more than the societal-benefit frame, and this effect is especially prominent among the individuals that have never consumed any adult vaccine in the past. Within the strata of individuals who have never consumed any adult vaccine, deep discount pricing may encourage vaccine adoption much more than moderate discount pricing. Although several factors influence the adoption of vaccines, the evidence-based insights of this study may help healthcare policymakers and firms to design strategies to increase vaccine adoption in developing countries.
Acknowledging that these results may not fully generalize beyond India, the specific setting investigated in our experiment, the findings of this study offer important implications for public health professionals, managers and policymakers designing demand-side strategies and policies to reduce vaccine hesitancy in a country of over 1.3 billion people and make progress toward herd immunity (Fefferman and Naumova 2015), a goal that seems elusive in the currently grim scenario. These results may also have implications for other developing economies and their public health strategies as the world struggles with eradicating vaccine hesitancy to come out with the global Covid-19 pandemic.
Experiment Design and Implementation
The Institutional Review Board at one of the author’s institutions approved the study protocols. The participants in the experiment gave informed consent in accordance with the guidelines set forth by the Institutional Review Board.
Sample Construction and Random Assignment of Framing Conditions
We conducted statistical power calculation to detect a traditionally considered small-to-medium effect size of d=0.35 (e.g., Dietze and Craig 2021: p. 357). A priori power analysis revealed that a sample size with 130 participants per randomized condition was required to achieve 80% statistical power with α=0.05. Because we have eight randomized conditions across the four distinct frames (gain-vs.-loss frame, individual-vs.-societal benefit frame, Indian-vs.-American frame, deep-vs.-moderate pricing discount frame), the total sample size required was 1,040 participants. Anticipating potential exclusions due to the lack of informed consent from some participants and due to the failure of some participants to successfully pass the attention checks, we documented in our preregistered plan to stop our data collection at N=2,000. We preregistered (https://aspredicted.org/blind.php?x=VCJ_JKK) the study’s design and data analysis plan on October 20. 2020. The data were collected December 6 and 7, 2020. The participants in the experiment were visitors to the website of Tata, www.1mg.com, India’s leading online pharmacy and healthcare platform.
In line with the preregistration plan, we stopped data collection at N=2,000. The participants were first requested for their informed consent to participate in the survey. Out of 2,000 participants, 1,952 participants gave their consent to participate (see Table 1). To ensure high data quality, in line with the preregistered analysis plan, the sample for analysis included only those participants who passed both attention-check questions. Thus, the sample size for our analysis is N=1,365 as 70% of the consenting participants (N=1,952) passed both attention checks (see Table 1). The first attention check question instructed, “For this question, please select number two to demonstrate your attention.” The second attention check question instructed, “For this question, please select number six to demonstrate your attention.” In both questions, respondents were given seven numbers to choose from 1 to 7.
Table 1. Sample Size and Research Design
|
N |
| Number of participants |
2,000 |
| Gave consent to participate |
1,952 |
| Passed both attention check 1 and 2 |
1,365 |
Notes: Following the preregistered analysis plan, we stopped our data collection at raw N = 2,000 and have N = 1,365 responses for analysis.
The participants were randomly assigned to the framing conditions: (i) gain versus loss frame, (ii) individual versus societal benefit frame, (iii) Indian versus American firm as the country of origin (of the vaccine manufacturing firm) frame, and (iv) deep versus moderate discount pricing frame (see Table 1). The message each participant saw was in line with our preregistered plan, which followed the technique of random assignment of distinct messages in information provision experiments (Haaland et al. 2021, Nyhan et al. 2014, List et al. 2021). For example, a randomly assigned participant under the gain framing condition received the following message: “Some public health experts suggest that not consuming a COVID-19 vaccine may decrease the chances of infection by 4X. As per scientific evidence, vaccine provides many benefits to the society leading to increased life expectancy. But, COVID-19 vaccine developed in such a short span may not have proven efficacy. Many firms believe a vaccine will be meaningless if the public cannot afford it. Therefore, an Indian firm has announced a discount of 80%.”
Participants randomly assigned to the loss framing condition saw “increase the chances of infection by 4X” instead of “decrease the chances of infection by 4X” seen by participants randomly assigned to the gain framing condition, while all else remained the same. Participants randomly assigned to individual benefit emphasis condition saw “vaccine provides many benefits to the individual” instead of “vaccine provides many benefits to the society” seen by participants randomly assigned to societal benefit emphasis condition. Participants randomly assigned to Indian firm as country of origin of vaccine manufacturing firm condition saw “an Indian firm has announced” instead of “an American firm has announced” seen by participants randomly assigned to American firm as country of origin of vaccine manufacturing firm condition. Participants randomly assigned to deep discount condition saw “a discount of 80%” instead of “a discount of 20%” seen by participants randomly assigned to moderate discount condition.
The key predictors in our analysis were four variables: Loss Framing, Individual Benefit, Indian Firm, and Deep Discount. Loss Framing is set to 1 if the participant received loss framing message, and 0 if the participant received gain framing message. Individual Benefit is set to 1 if the participant received individual benefit emphasis message, and 0 if the participant received societal benefit emphasis message. Indian Firm is set to 1 if the participant received a message stating an Indian firm, and 0 otherwise. Deep Discount is set to 1 if the participant received a message with 80% discount, and 0 if the participant received a message with 20% discount.
After randomly receiving the above messages with subtle variation in the framing of the information, the participants were asked if they would be willing to consume the COVID-19 vaccine. We constructed a binary variable Consume equal to 1 if the participant answered “Yes” and to 0 if the participant answered “No” to this question. To allay the concern of order bias, the order in which “Yes” and “No” appeared as two options for the participant was made random. The participants were also asked about their willingness to consume a COVID-19 vaccine on a continuous scale from 0 to100, where 100 referred to a hundred percent willingness to consume the vaccine. We constructed a continuous measure “Willingness to Consume” to measure this stated preference. Consume and Willingness to Consume thus serve as the two main outcome variables of interest in our analysis. The participants also answered questions about their demographic characteristics including age, gender, education, and also answered important context-specific questions about whether they had consumed any adult vaccine in the past, their current exposure to COVID-19, ability to work from home, etc. Participants also answered the ten-item personality inventory questions, which we use to measure the five-factor model of personality: extraversion, agreeableness, conscientiousness, emotional stability, and openness to experiences (Digman 1990, Espinoza et al. 2020, McCrae and Costa 1999). All variables are described in Table S1 (in the supplementary material).
Methodology & Econometric Model
To formally estimate the average treatment effects of the framing messages, we estimate the following ordinary least squares (OLS) regression:
Yi = α + βc Rci + εi (1)
The outcome of interest Y in Equation (1) is the stated preference of participant i to consume COVID-19 vaccine. As explained above, we measured the outcome of interest in two distinct ways: Consume (a binary variable) and Willingness to Consume (a continuous measure). Rc is a vector of four key predictor variables representing loss framing condition (gain framing condition serves as the reference category), individual benefit condition (societal benefit condition serves as the reference category), Indian firm condition (American firm condition serves as the reference category), and deep discount condition (moderate discount condition serves as the reference category). We first report OLS estimates with heteroskedasticity-robust standard errors. Then, we also test the robustness of the results obtained from the OLS regression model by using logistic regression model for the binary dependent variable Consume and by using Tobit regression model for the limited dependent variable Willingness to Consume.
Building upon Equation (1), we also estimated the following regression equation to increase the efficiency of estimation and to explore the association of stated preference with other characteristics of the individuals (Vasquez et al. 2021, Athey and Imbens 2017, Glennerster and Takavarasha 2013):
Yi = α + βc Rci + γ Zi + εi (2)
Equation (2) is similar to Equation (1) with the only difference being the addition of control variables represented by a vector Z (Table 2 shows the control variables). For ease of interpretation, we report and discuss OLS estimates as the main results. We also test the robustness of the results obtained from OLS regression model by using logistic (i.e., logit) regression model for the binary dependent variable Consume and by using Tobit regression model for the limited dependent variable Willingness to Consume.
Findings
The final sample of 1,365 participants had an average age of 40.3 years (SD = 15.2), 13.8% were female, and 51.3% had never consumed any adult vaccine in the past. As shown in Table 2, randomized treatment conditions were well balanced on age, gender, time duration (in minutes) spent on the survey, and several other dimensions including their current exposure to COVID-19 at the time of the experiment.
Table 2. Balance Checks

Notes: The table reports the means across randomized conditions and the P-value of the null hypothesis that the difference of means between the randomized conditions equals zero. The balance checks are based on t-test comparison of means.
Descriptive Analysis
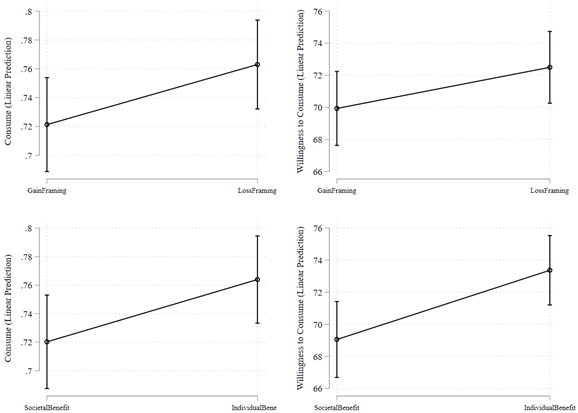
Figure 1 shows the descriptive patterns by comparing the mean values of dependent variables by randomized conditions. Figure 1a shows that under the loss framing condition, 76.1% of individuals stated they were willing to consume the vaccine, which is directionally higher than but not statistically distinguishable from the 72.3% of individuals under the gain framing condition (B=0.038; t(1363)=1.593; P=0.111; 95% confidence interval (CI) [-0.008, 0.084]). Figure 1a also shows that under the loss framing condition, average willingness to consume the vaccine was 72.3%, which is again directionally higher than but not statistically distinguishable from the 70.1% of average willingness to consume the vaccine under the gain framing condition (B=2.192; t(1363)=1.250; P=0.211; 95% CI [-1.247, 5.632]).
Figure 1. Stated Preference for Consuming COVID-19 Vaccine
Figure 1a
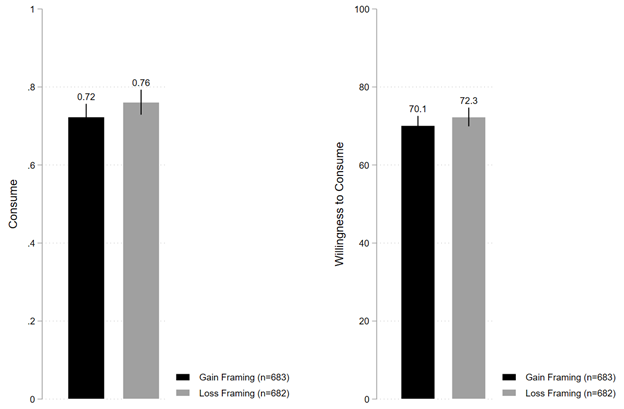
Figure 1b
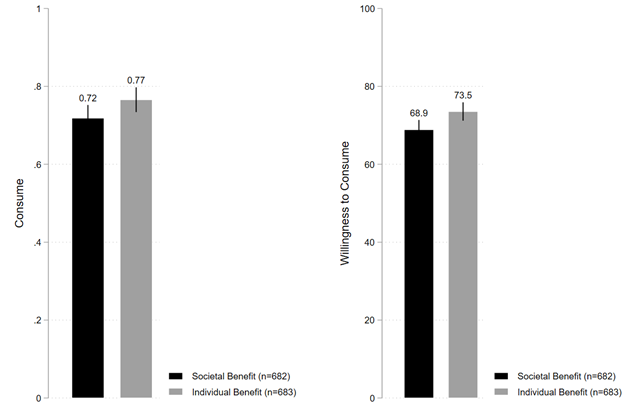
Figure 1c
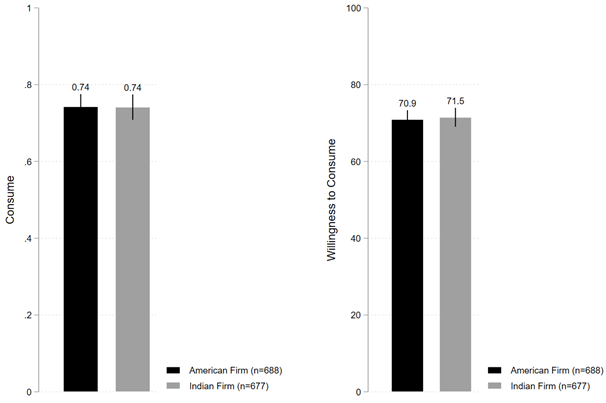
Figure 1d
Notes: “Consume” is measured as a binary variable set to one if yes, zero is no. “Willingness to Consume” is measured as a continuous variable from 0 to 100, where 100 denotes 100% willingness to consume the COVID-19 vaccine.
Figure 1b shows that under individual benefit emphasis frame, 76.6% of individuals stated they were willing to consume the vaccine, which is directionally higher and also statistically distinguishable from the 71.8% of individuals under societal benefit emphasis frame (B=0.047; t(1363)=1.997; P=0.046; 95% CI [0.001, 0.094]). Similarly, Figure 1b also shows that under individual benefit emphasis frame, average willingness to consume the vaccine was 73.5%, which is again directionally higher and statistically distinguishable from the 68.9% of average willingness to consume the vaccine under societal benefit emphasis frame (B=4.662; t(1363)=2.664; P=0.008; 95% CI [1.229, 8.094]).
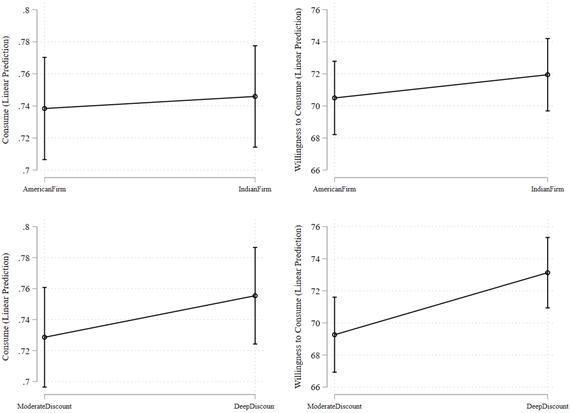
Figure 1c shows that under Indian firm condition, 74.1% of individuals stated they are willing to consume the vaccine, which is neither directionally very different nor statistically distinguishable from the 74.2% of individuals under American firm condition (B=-0.001; t(1363)=-0.051; P=0.958; 95% CI [-0.047, 0.045]). Figure 1c also shows that under Indian firm condition, average willingness to consume the vaccine was 71.5%, which is again neither directionally very different nor statistically distinguishable from the 70.9% of average willingness to consume the vaccine under American firm condition (B=0.557; t(1363)=0.318; P=0.751; 95% CI [-2.884, 3.998]).
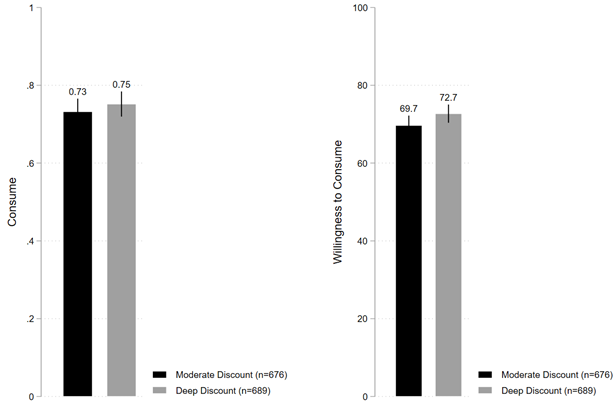
Finally, Figure 1d shows that under deep discount condition, 75.1% of individuals stated they were willing to consume the vaccine, which is directionally slightly higher but not statistically distinguishable from the 73.2% of individuals under moderate discount condition (B=0.019; t(1363)=0.825; P=0.409; 95% CI [-0.027, 0.066]). In contrast, however, average willingness to consume the vaccine was 72.7% under deep discount condition, which is directionally higher and moderately statistically distinguishable from the 69.7% under moderate discount condition (B=3.020; t(1363)=1.723; P=0.085; 95% CI [-0.417, 6.458]).
Figure 2 shows the full empirical distribution of the continuous variable Willingness to Consume. We conducted Kolmogorov-Smirnov (KS) tests for equality of distributions across the randomized conditions. The KS test suggests that the distributions of willingness to consume are different under the individual-benefit frame compared with that under the societal-benefit frame (D=0.0786, P=0.029). In contrast, the KS tests fail to reject the equality of distributions under gain frame compared with loss frame (D=0.0489, P=0.389), Indian firm compared American firm (D=0.0344, P=0.815), and deep discount compared to moderate discount (D=0.0562, P=0.232).
Figure 2. Full Empirical Distribution of Willingness to Consume COVID-19 Vaccine
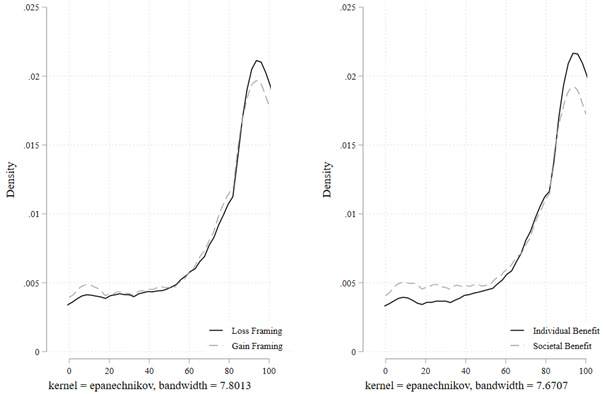
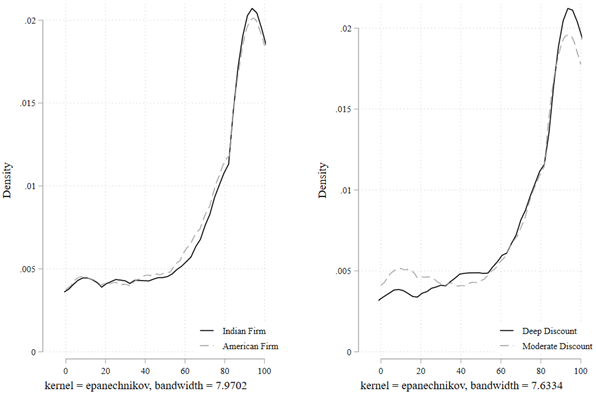
Notes. “Willingness to Consume” is measured as a continuous variable from 0 to 100, where 100 denotes 100% willingness to consume the COVID-19 vaccine.
Average Treatment Effects
We estimated ordinary least squares (OLS) regression as per Equation (1) to formally estimate the average treatment effects of the framing messages. Table S2 (in the supplementary material) shows that the results of the OLS regression analyses remain qualitatively similar to the patterns observed in Figure 1. We discuss the results of the models (Model 5 and 10 of Table S2) that simultaneously included all four key predictor variables in the same regression equation. Model 5 shows that compared to societal benefit framing, individual benefit framing increased the fraction of individuals who stated their preference to consume the vaccine (B=0.048; P=0.043; 95% CI [0.001, 0.094]). Given that under societal benefit framing condition, 71.8% of individuals stated their preference to consume the vaccine, the coefficient of 0.048 implies an increase of 6.7% under the individual benefit framing condition relative to societal benefit framing condition. Similarly, Model 10 shows that compared to societal benefit framing, individual benefit framing increased the average willingness to consume the vaccine (B=4.676; P=0.008; 95% CI [1.245, 8.107]). Given that under societal benefit framing condition, the average willingness to consume was 68.9%, the coefficient of 4.676 implies an increase of 6.8% under the individual benefit framing condition relative to societal benefit framing condition.
In addition, Model 5 of Table S2 shows that compared to gain framing condition, loss framing condition increased the fraction of individuals who stated that they will be willing to consume the vaccine (B= 0.039, P=0.099; 95% CI [-0.007, 0.085]) and Model 10 shows that compared to moderate discount, deep discount framing increased the average willingness to consume the vaccine (B=3.07; P=0.080; 95% CI [-0.362, 6.501]). These results obtained from OLS regression models remain robust to using logit regression models for the binary dependent variable Consume and to using tobit regression models for the limited dependent variable Willingness to Consume (see Table S3 in the supplementary material).
Thus, the regression analysis results suggest that individual benefit emphasis framing increased the stated preference to consume the vaccine relative to societal benefit emphasis framing. In contrast, Indian versus American firm framing had no differential impact. Deep discount framing showed an increase in average willingness to consume relative to moderate discount framing, and loss framing increased the fraction of individuals who stated that they will be willing to consume the vaccine relative to gain framing.
In an additional analysis, we also estimated average treatment effects of framing conditions by excluding those participants that were outliers in terms of survey completion duration. Following the preregistered analysis plan, we excluded responses from the participants who took less time than 5th percentile or more time than 95th percentile. Table S4 shows the results of this additional analysis: We continue to find evidence suggesting that individual benefit emphasis framing increased the stated preference to consume the vaccine relative to societal benefit emphasis framing.
In line with the preregistered plan, we also conducted regression analyses including the control variables to increase the efficiency of estimation and to explore the association of stated preference with other characteristics of the individuals. For ease of interpretation, we discuss the inference obtained from OLS regression models as the main results (Table 3, Models 1 and 3; also see Figure 3). We also show the results obtained from logit regression model for the binary dependent variable Consume and from tobit regression model for the limited dependent variable Willingness to Consume (Table 3, Models 2 and 4).
Figure 3. Estimated Stated Preference for Consuming COVID-19 Vaccine
Notes: Predictive margins are based on OLS regression estimates shown in Model 1 and 3 of Table 3.
Table 3. Estimates of Treatment Effects while Controlling for Individual Characteristics

Notes: Heteroskedasticity-robust standard errors; exact p-values are reported in parentheses; two-tailed tests have been used. *** p<0.01, ** p<0.05, * p<0.1.
The results of Table 3 provide a similar inference as Figure 1 and Table S2 about the treatment effects of respective framing messages. Figure 3 shows that we continue to find that individual benefit framing increased the stated preference to consume the vaccine relative to societal benefit framing. Indian versus American firm framing had no differential impact. Deep discount framing showed an increase in willingness to consume relative to moderate discount framing, and loss framing increased the fraction of individuals who stated their preference to consume the vaccine relative to gain framing.
In addition to examining the framing effects, Table 3 sheds light on associations between other characteristics and stated preference for consuming the vaccine. Model 1 of Table 3 shows that a lower fraction of individuals who had never consumed any adult vaccines (compared to those who had consumed any adult vaccine in the past) stated their preference to consume the vaccine (B=-0.072; P=0.002; 95% CI [-0.118, -0.026]). Given that 79.6% of individuals who have consumed any adult vaccine in the past stated their preference to consume the COVID-19 vaccine, the coefficient of -0.072 implies a relative decrease of 9.0% in the stated preference to consume the vaccine by those who had never consumed any adult vaccine. Similarly, Model 3 of Table 3 also shows that compared to individuals who had consumed any adult vaccine in the past, those who had never consumed any adult vaccine have lower average willingness to consume the vaccine (B=-5.631; P=0.001; 95% CI [-8.915, -2.348]). Given that individuals who had consumed any adult vaccine in the past showed an average willingness to consume of 75.8%, the coefficient of -5.631 implies a relative decrease of 7.7% in the average willingness to consume among those who had never consumed any adult vaccine. Furthermore, Model 1 of Table 3 also shows that a higher fraction of individuals who already trust vaccine (compared to individuals who do not already trust vaccine) stated their preference to consume the vaccine (B=0.209; P=0.000; 95 % CI [0.167, 0.251]). Similarly, Model 3 of Table 3 also shows that compared to individuals who do not already trust vaccine, those who already trust vaccine expressed much greater average willingness to consume the vaccine (B=22.452; P=0.000; 95% CI [19.406, 25.498]). We also observe a positive association between the current exposure to COVID-19 and the stated preference to consume the vaccine (B=0.002; P=0.000; 95 % CI [0.001, 0.003]).
Heterogeneous Treatment Effects
Is there an evidence of any heterogeneous treatment effects? In post-hoc analyses, we find that the positive effect of individual benefit framing (relative to societal benefit framing) on the stated preference to consume vaccine is especially prominent in the strata of individuals who have never consumed any adult vaccine in the past. This pattern is evident from Figure 4 and the coefficient of Individual Benefit in Model 1 of Table 4 (B=0.076; P=0.029; 95% CI [0.007, 0.144]) and Model 3 of Table 4 (B=0.372; P=0.032; 95% CI [0.032, 0.712) from the OLS and logit regression models respectively for the outcome variable Consume, and in Model 5 of Table 4 (B=5.612; P=0.024; 95% CI [0.754, 10.469]) and Model 7 of Table 4 (B=7.975; P=0.029; 95% CI [0.819, 15.131) from the OLS and tobit regression models respectively for the outcome variable Willingness to Consume. These results imply that within the strata of individuals who had never consumed any adult vaccine, given that under societal benefit framing condition, 64.9% of individuals stated their preference to consume the vaccine, the coefficient of 0.076 in Model 1 (interpreting OLS estimate) of Table 4 implies an increase of 11.2% under the individual benefit framing condition relative to societal benefit framing condition. Similarly, within the strata of individuals that had never consumed adult vaccine, given that under societal benefit framing condition, the average willingness to consume was 63.6%, the coefficient of 5.612 in Model 5 (again interpreting OLS estimate) of Table 4 implies an increase of 8.8% under the individual benefit framing condition relative to societal benefit framing condition.
Figure 4. Estimated Stated Preference by Adult Vaccine Consumption in the Past
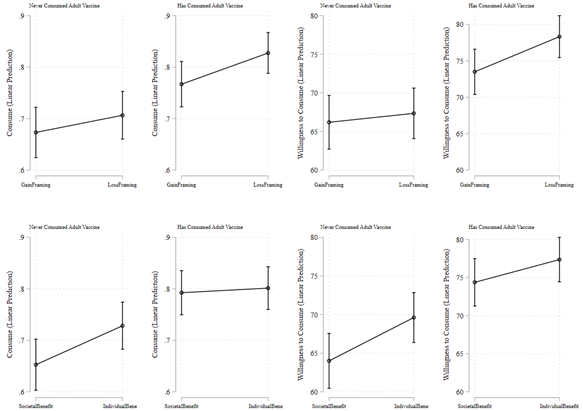
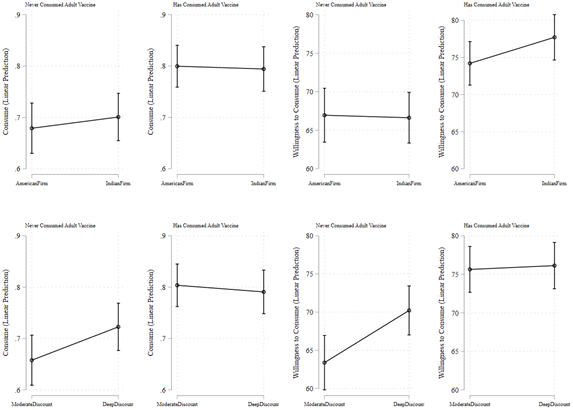
Notes. Predictive margins in the figure are based on OLS regression estimates shown in Models 1-2 and 5-6 of Table 4.
Table 4. Estimates of Heterogeneous Treatment Effects

Notes: Heteroskedasticity-robust standard errors; exact p-values are reported in parentheses; two-tailed tests have been used.
*** p<0.01, ** p<0.05, * p<0.1.
In addition, Figure 4 and Table 4 also suggest a positive effect of deep discount pricing frame relative to moderate discount pricing frame on the strata of individuals who had never consumed adult vaccine. This pattern is evident from Figure 4 and the coefficient of Deep Discount in Model 1 of Table 4 (B=0.065; P=0.058; 95% CI [-0.002, 0.132]) and Model 3 of Table 4 (B=0.328; P=0.055; 95% CI [-0.006, 0.662) from the OLS and logit regression models respectively for the outcome variable Consume, and in Model 5 of Table 4 (B=6.842; P=0.006; 95% CI [2.015, 11.669]) and Model 7 of Table 4 (B=10.279; P=0.005; 95% CI [3.067, 17.490) from OLS and tobit regression models respectively for the outcome variable Willingness to Consume. These results imply that within the strata of individuals that had never consumed any adult vaccine, given that under societal benefit framing condition, 64.9% of individuals stated their preference to consume the vaccine, the coefficient of 0.065 in Model 1 (interpreting OLS estimate) of Table 4 implies an increase of 10.0% under the deep discount condition relative to moderate discount condition. Similarly, within the strata of individuals that had never consumed adult vaccine, given that under societal benefit framing condition, the average willingness to consume was 63.6%, the coefficient of 6.842 in Model 5 (again interpreting OLS estimate) of Table 4 implies an increase of 10.8% under the deep discount condition relative to moderate discount condition. Figure S1 shows the estimates of additional analysis exploring the heterogeneity in treatment effects by all other individual characteristics.
Looking Forward
Given the catastrophic Covid-19 pandemic, reducing vaccine hesitancy among vast populations has never taken on greater import for healthcare practitioners, such as public health professionals, the senior managers at vaccine-manufacturing firms and policymakers, engaged in enhancing vaccine uptake. With a staggering number of deaths and a record-high number of cases in settings with weak health systems like India, the continuing pandemic has placed even greater demands on the crucial role of reducing vaccine hesitancy as vaccine mandates spread globally to recover from the pandemic while misinformation continues to be a problem (Carrieri et al. 2019). Reducing vaccine hesitancy is an especially critical challenge in developing countries given that a nontrivial proportion of their populations typically do not consume adult vaccines (Vasquez et al. 2021).
Prior research studying individual decision-making processes regarding vaccination distinguish between two core motivations for becoming vaccinated: self-interests and the interests of society (Yamin and Gavious 2013, Fine and Clarkson 1986, Velan et al. 2011). Incentives, such as placing vaccination centers in more accessible locations, providing financial and nonfinancial remuneration to an individual for getting vaccinated, and reimbursing vaccination costs have been documented as a few drivers to reduce vaccine hesitancy (Banerjee et al. 2010, Dupas 2011, Kremer and Glennerster 2011, Mamani et al. 2013).
A growing body of literature, mostly investigating the context of developed countries such as the U. S. and the U. K., has set forth to explore the role of nudges in individual decision-making by examining how distinct ways of information provision can reduce vaccine hesitancy (Benartzi et al. 2017, Frew et al. 2014, Milkman et al. 2011, 2021). Examining the context of the U. S., Milkman et al. (2011) found that a nudge prompting individuals to plan the date and time of vaccination, succeeded in increasing the vaccination outcomes by reducing forgetfulness among individuals. Again, examining the context of the U. S., a recent study by Hendrix et al. (2014) found an increase in parents’ measles-mumps-rubella (MMR) vaccination intentions for their infants when framing messages that emphasized direct benefits to the child rather than benefits to the society. As Benartzi et al. (2017: p. 1045) highlight in a recent review, several low-cost nudges, such as a time-commitment nudge (Milkman et al. 2011), default-appointment nudge (Chapman et al. 2010), and information-enhancing campaigns (Kimura et al. 2007), have proven effective in enhancing the vaccination rates in developed country settings. Globally, many developed countries such as the U. S. and the U. K. are making significant investments in setting up “nudge units” both inside and outside of governments to benefit from behavioral insights. The irony is that the developing countries—which may arguably benefit most from the effects of low-cost nudging interventions on a large scale given their huge populations—are lagging behind in supplementing traditional policies with behaviorally informed policies.
Our study extends the growing literature on nudging interventions by exploring how certain frames can be more effective than others in increasing the willingness to consume vaccines in a large developing country. Results from our experiment highlight the relative importance of benefits to self as an important driver of vaccine intake intention, which is consistent with the conceptual view that people make their vaccination decision based on their self-interests (Yamin and Gavious 2013). Individuals who received the individual-benefit framing were 6.7% more likely to state their preference to consume vaccine and expressed 6.8% greater willingness to consume relative to those under the societal-benefit framing. Interestingly, however, this effect was especially pronounced among those individuals who had never consumed any adult vaccine in the past: Within this strata of people, individuals who received the individual-benefit framing were 11.2% more likely to state their preference to consume vaccine and expressed 8.8% greater willingness to consume relative to those under the societal-benefit framing. While we did not find average treatment effects of deep relative to moderate discount frame, the relative importance of deep discount was prominent on the strata of individuals who had never consumed any adult vaccine in the past. Within this strata, individuals who received the deep-discount framing were 10.0% more likely to state their preference to consume vaccine and expressed 10.8% greater willingness to consume relative to those under the moderate-discount framing.
Some of the null results in our experiment are noteworthy. We did not find consistent evidence of the relative importance of loss frame or gain frame in their effect on the stated preference to consume vaccine. In doing so, our study joins the body of work that suggest that the relative importance of loss versus gain framing may not be unconditional (Bartels et al. 2010, Block and Keller 1995). In addition, we also did not find any distinguishable relative effect of Indian vs. American firm frame on the stated preference to consume vaccine. This null finding is important as it suggests that an individual’s decision-making process regarding vaccination may not be driven strongly by the liabilities of foreignness faced by foreign firms.
For academic research, our findings are noteworthy in that they advance the understanding of individual decision-making processes regarding vaccination. Some frames can be more effective than others in reducing vaccine hesitancy. Importantly, our findings suggest that the preference to consume vaccines can be stimulated more by appeals to self-interest rather than concerns for society per se (Yamin and Gavious 2013, Hendrix et al. 2014). This finding advances knowledge of how certain frames can be more successful in increasing the demand for preventive healthcare actions. For practitioners, our results are important in that they have a clear potential for practical impact. Our findings suggest that healthcare practitioners can reduce vaccine hesitancy by framing messages that appeal directly to consumer’s self-interest. Because many people in developing countries do not have a preference to consume adult vaccines (Dupas 2011, Kremer and Glennerster 2011), the findings of this study have relevant implications for managers of firms and transnational organizations and policymakers that are actively engaged in designing strategies and policies to reduce vaccine hesitancy among billions of people across developing countries (Dupas and Miguel 2017, Rezaie et al. 2012). This is specifically important given that public health experts suggest that herd immunity may require a substantial proportion of the population in a country to consume COVID-19 vaccine (Allen 2021, D’Souza and Dowdy 2021, Lazarus et al. 2021, Inamdar and Alluri 2021).
There are limitations to our study that serve as future research opportunities. While this study focused on the potential drivers of demand-side behavior, considering the supply-side behavior is also important. For example, a recent study by Niewoehner and Staats (2021) investigates the role of incentives and performance feedback in vaccine provider behavior in the context of flu vaccinations in the U. S., and finds that social comparisons such as performance feedback dominate over the effect of additional financial incentives. It would be a fruitful research endeavor to study the interactions between the supply-side and demand-side behavioral interventions leveraging both financial incentives and non-financial nudges.
In our study, we were able to measure an individual’s stated preference to consume vaccine. Although the theory of planned behavior suggests that intentions are likely to be significant predictors of behavior (Ajzen 1991, Zubair et al. 2020), we want to be clear that our study did not measure the revealed behavior, i.e., the actual intake of vaccine. Under some conditions, the intentions may not necessarily translate into actual behavior (Sheeran 2002). In the absence of the individual-level data on actual vaccine intake from India, however, we view that our findings investigating the relationship between distinct framing conditions and intentions to consume COVID-19 vaccine are nevertheless valuable to understand the potential drivers that may enhance vaccine uptake saving lives. Self-reported intention to consume vaccine offers useful insight in healthcare research (Daly et al. 2021). Future research ought to investigate this relationship using the actual vaccine intake data. One may also wonder about the external validity of our experimental findings that come specifically from India. We view our main contribution as investigating the underpinnings of how distinct frames may influence an individual’s intention to consume the COVID-19 vaccine, and India as a large developing country provided a relevant context to study this question. It will be fruitful for future research to focus on generalizability and extension replications of our findings across other settings and cultures more broadly and identify the boundary conditions across societies.
Although we have focused on individual preference for COVID-19 vaccination in this study, our results may broadly inform how individual decision-making processes could work for other prophylactic products (i.e., for which one pays now for uncertain benefits in future, e.g., insurance). As with the decisions for vaccinations, for other prophylactic products and preventive technologies more broadly, the consumer demand in most of the developing world is relatively muted because of present biased preferences of many individuals (Dupas 2011, Kremer and Glennerster 2011). The insights from our experiment conducted to study the individual decision-making process regarding vaccination in a developing country setting, juxtaposed with the findings from a growing set of influential experiments conducted across developed country settings (Milkman et al. 2011, 2021, see Dupas and Miguel 2017 for a review), may inform the design of nudges for improving the uptake of prophylactic products and preventive technologies more broadly (Argyris et al. 2021).
References
Allen, J. Fauci says herd immunity could require nearly 90% to get coronavirus vaccine. (2020). Reuters, 24 December. https://www.reuters.com/article/health-coronavirususa/fauci-says-herd-immunity-could-require-nearly-90-to-get-coronavirus-vaccineidUSL1N2J411V
Argyris, Y. A., Kim, Y., Roscizewski, A., & Song, W. (2021). The mediating role of vaccine hesitancy between maternal engagement with anti-and pro-vaccine social media posts and adolescent HPV-vaccine uptake rates in the US: The perspective of loss aversion in emotion-laden decision circumstances. Social Science & Medicine, 114043.
Arifoğlu, K., Deo, S., & Iravani, S.M. (2012). Consumption externality and yield uncertainty in the influenza vaccine supply chain: Interventions in demand and supply sides. Management Science 58(6):1072-1091.
Athey, S., & Imbens, G. W. (2017). The econometrics of randomized experiments. In Handbook of Economic Field Experiments (Vol. 1, pp. 73–140). North-Holland.
Banerjee, A. V., Duflo, E., Glennerster, R., & Kothari, D. (2010). Improving immunisation coverage in rural India: Clustered randomised controlled evaluation of immunisation campaigns with and without incentives. BMJ 340,1-9.
Bartels, R.D., Kelly, K.M., & Rothman, A.J. (2010). Moving beyond the function of the health behaviour: The effect of message frame on behavioural decision-making. Psychology and Health 25(7):821-838.
Benartzi, S., Beshears, J., Milkman, K.L., Sunstein, C.R., Thaler, R.H., Shankar, M., Tucker-Ray, W., Congdon, W.J., & Galing, S. (2017). Should governments invest more in nudging? Psychological Science 28(8):1041-1055.
Bhuyan, A. (2021). Experts criticise India’s complacency over COVID-19. Lancet 397:1611-1612.
Block, L.G., & Keller, P.A. (1995). When to accentuate the negative: The effects of perceived efficacy and message framing on intentions to perform a health-related behavior. Journal of Marketing Research 32(2):192-203.
Bloom, B. R., & Marcuse, E., Mnookin, S. (2014). Addressing vaccine hesitancy. Science 344:339-340.
Carrieri, V., Madio, L., & Principe, F. (2019). Vaccine hesitancy and (fake) news: Quasi‐experimental evidence from Italy. Health Economics, 28(11), 1377-1382.
Chapman, G.B., Li, M., Colby, H., & Yoon, H. (2010). Opting in vs opting out of influenza vaccination. JAMA 304(1):43-44.
Cohen, J. (2021). Is India’s coronavirus death ‘paradox’ vanishing? Science 372:552-553.
Daly, M., Jones, A., & Robinson, E. (2021). Public trust and willingness to vaccinate against COVID-19 in the US from October 14, 2020, to March 29, 2021. JAMA doi:10.1001/jama.2021.8246.
Diestre, L., Barber IV, B., & Santaló, J. (2020). The friday effect: Firm lobbying, the timing of drug safety alerts, and drug side effects. Management Science 66(8):3677-3698.
Dietze, P., & Craig, M.A. (2021). Framing economic inequality and policy as group disadvantages (versus group advantages) spurs support for action. Nature Human Behaviour 5(3):349-360.
Digman, J.M. (1990). Personality structure: Emergence of the five-factor model. Annual Review of Psychology 41(1):417-440.
Đorđević, J. M., Mari, S., Vdović, M., & Milošević, A. (2021). Links between conspiracy beliefs, vaccine knowledge, and trust: Anti-vaccine behavior of Serbian adults. Social Science & Medicine, 277, 113930.
D’Souza, G., & Dowdy, D. (2021). What is herd immunity and how can we achieve it with COVID-19? Johns Hopkins Bloomberg School of Public Health (updated 6 April 2021). https://www.jhsph.edu/covid-19/articles/achieving-herd-immunity-with-covid19.html .
Dupas, P. (2011). Health behavior in developing countries. Annual Review of Economics 3(1):425-449.
Dupas, P., & Miguel, E. (2017). Impacts and determinants of health levels in low-income countries. In Handbook of Economic Field Experiments (Vol. 2, pp. 3-93). North-Holland.
Espinoza, J. A., Daljeet, K. N., & Meyer, J. P. (2020). Establishing the structure and replicability of personality profiles using the HEXACO-PI-R. Nature Human Behaviour 4(7):713-724.
Fefferman, N.H., & Naumova, E.N. (2015). Dangers of vaccine refusal near the herd immunity threshold: a modelling study. Lancet Infectious Diseases 15(8):922-926.
Fine, P. E. M., & Clarkson, J.A. (1986). Individual versus public priorities in the determination of optimal vaccination policies. American Journal of Epidemiology 124(6):1012-1020.
Frew, P.M., Saint-Victor, D.S., Owens, L.E., & Omer, S.B. (2014). Socioecological and message framing factors influencing maternal influenza immunization among minority women. Vaccine 32(15):1736-1744.
Glennerster, R., & Takavarasha, K. (2013). Running Randomized Evaluations: A Practical Guide. Princeton University Press.
Hendrix, K.S., Finnell, S.M.E., Zimet, G.D., Sturm, L.A., Lane, K.A., & Downs, S.M. (2014). Vaccine message framing and parents’ intent to immunize their infants for MMR. Pediatrics 134(3):e675-e683.
Hornsey, M. J., Lobera, J., & Díaz-Catalán, C. (2020). Vaccine hesitancy is strongly associated with distrust of conventional medicine, and only weakly associated with trust in alternative medicine. Social Science & Medicine, 255, 113019.
Inamdar, N., & Alluri, A. (2021). How India’s vaccine drive went horribly wrong. BBC News, 14 May. https://www.bbc.com/news/world-asia-india-57007004 .
Kahneman, D. & Tversky, A. (1979). Prospect theory: An analysis of decision under risk. Econometrica 47, 263–292.
Kimura, A. C., Nguyen, C. N., Higa, J. I., Hurwitz, E. L., & Vugia, D. J. (2007). The effectiveness of vaccine day and educational interventions on influenza vaccine coverage among health care workers at long-term care facilities. American Journal of Public Health 97:684–690.
Kremer, M., & Glennerster, R. (2011). Improving health in developing countries: Evidence from randomized evaluations. In Handbook of Health Economics Vol. 2, 201-315. Elsevier.
Larson, H.J., Jarrett, C., Eckersberger, E., Smith, D.M., & Paterson, P. (2014). Understanding vaccine hesitancy around vaccines and vaccination from a global perspective: A systematic review of published literature, 2007–2012. Vaccine 32(19):2150-2159.
Lazarus, J.V., Ratzan, S.C., Palayew, A., Gostin, L.O., Larson, H.J., Rabin, K., Kimball, S., & El-Mohandes, A. (2021). A global survey of potential acceptance of a COVID-19 vaccine. Nature Medicine 27(2):225-228.
Levin, I.P., Schneider, S.L., & Gaeth, G.J. (1998). All frames are not created equal: A typology and critical analysis of framing effects. Organizational Behavior and Human Decision Processes 76(2): 149-188.
List, J.A., Murphy, J.J., Price, M.K., & James, A.G. (2021). An experimental test of fundraising appeals targeting donor and recipient benefits. Nature Human Behaviour forthcoming,1-10.
Luyten, J., Kessels, R., Atkins, K. E., Jit, M., & Van Hoek, A. J. (2019). Quantifying the public’s view on social value judgments in vaccine decision-making: A discrete choice experiment. Social Science & Medicine, 228, 181-193.
Masic, I., Gerc, V. (2020). On occasion of the COVID-19 pandemic-One of the most important dilemma: Vaccinate or not? Medical Archives 74(3):164-167.
McCrae, R. R., & Costa, P. T. Jr. (1999). In Handbook of Personality: Theory and Research (eds. Pervin, L. A., & John, O. P.). Elsevier, 139–153.
Milkman, K.L., Beshears, J., Choi, J.J., Laibson, D., & Madrian, B.C. (2011). Using implementation intentions prompts to enhance influenza vaccination rates. Proceedings of the National Academy of Sciences 108(26):10415-10420.
Milkman, K.L., Patel, M.S., Gandhi, L., Graci, H.N., Gromet, D.M., Ho, H., Kay, J.S., Lee, T.W., Akinola, M., Beshears, J., & Bogard, J.E. (2021). A megastudy of text-based nudges encouraging patients to get vaccinated at an upcoming doctor’s appointment. Proceedings of the National Academy of Sciences 118(20):1-3.
Niewoehner, R.J., & Staats, B.R. (2021). Focusing provider attention: An empirical examination of incentives and feedback in flu vaccinations. Management Science forthcoming.
Norton, A.J., Wiysonge, C.S., Habarugira, J.M.V., White, N.J., Bayona, M.T., Hagen, H.E., Archer, J.E., Alobo, M.S., Carson, G.L., Garcia, P.J., & Maciel, R.M. (2021). Priorities for COVID-19 research response and preparedness in low-resource settings. Lancet 397:1611-1612.
Regan, A.K., Bloomfield, L., Peters, I., & Effler, P.V. (2017). Randomized controlled trial of text message reminders for increasing influenza vaccination. Annals of Family Medicine 15(6):507-514.
Rezaie, R., McGahan, A.M., Daar, A., & Singer P. (2012). Globalization of health innovation. Nature Biotechnology 30:923–925.
Sheeran, P. (2002). Intention—behavior relations: A conceptual and empirical review. European Review of Social Psychology 12(1):1-36.
Tannenbaum, M.B., Hepler, J., Zimmerman, R.S., Saul, L., Jacobs, S., Wilson, K., & Albarracín, D. (2015). Appealing to fear: A meta-analysis of fear appeal effectiveness and theories. Psychological Bulletin 141(6):1178-1204.
Taylor, T.A., & Xiao, W. (2014). Subsidizing the distribution channel: Donor funding to improve the availability of malaria drugs. Management Science 60(10):2461-2477.
Tversky, A., & Kahneman, D. (1981). The framing of decisions and the psychology of choice. Science 211:453–458.
Tversky, A., & Kahneman, D. (2000). In Choices, Values, and Frames (eds D. Kahneman, A. Tversky, A.). Cambridge University Press 209–223.
Vaidyanathan, G. (2021). Coronavirus variants are spreading in India-what scientists know so far. Nature 593:321-322.
Vásquez, W. F., Trudeau, J. M., & Alicea‐Planas, J. (2021). Immediate and informative feedback during a pandemic: Using stated preference analysis to predict vaccine uptake rates. Health Economics.
Ward, J. K., Alleaume, C., Peretti-Watel, P., Seror, V., Cortaredona, S., Launay, O., … & Ward, J. (2020). The French public’s attitudes to a future COVID-19 vaccine: The politicization of a public health issue. Social Science & Medicine, 265, 113414.
Worldometers. (2021). COVID-19 coronavirus pandemic. https://www.worldometers.info/coronavirus
Yamin, D., & Gavious, A. (2013). Incentives’ effect in influenza vaccination policy. Management Science 59(12):2667-2686.
Yokum, D., Lauffenburger, J.C., Ghazinouri, R., & Choudhry, N.K. (2018). Letters designed with behavioural science increase influenza vaccination in Medicare beneficiaries. Nature Human Behaviour 2(10):743-749.
Zaheer, S. (1995). Overcoming the liability of foreignness. Academy of Management Journal 38(2):341-363.
Zubair, M., Iqbal, S., Usman, S.M., Awais, M., Wang, R., & Wang, X., 2020. Message framing and self-conscious emotions help to understand pro-environment consumer purchase intention: An ERP study. Scientific Reports 10(1):1-8. https://www.nature.com/articles/s41598-020-75343-8