Will Mitchell, Anthony S. Fell Chair in New Technologies and Commercialization, Rotman School of Management, University of Toronto
Contact: Will Mitchell william.mitchell@Rotman.Utoronto.Ca
Abstract
What is the message?
Generic and biosimilar drugs now comprise more than 90% of prescriptions and provide discipline on prices in the U.S. pharmaceutical market. Generic versions of traditional small cell pharmaceuticals have had a strong disciplining effect on drug prices. Biosimilars of biologic-based drugs are beginning to show a similar influence, although the impact of biosimilar competition has been slower in the U.S. than in Europe and other developed markets. The challenge going forward is to reinforce norms and rules of competition in the bio-pharmaceutical industry.
What is the evidence?
Assessments based on publicly available data from company reports and industry analysts.
Submitted: October 1, 2019; accepted after review October 31, 2019.
Cite as: Will Mitchell. 2019. Generic drugs: The hidden safety value in the drug pricing controversy. Health Management Policy and Innovation, Volume 4, Issue 2.
Overview
Drug prices in the U.S. are controversial yet again, providing heated talking points on all sides of the political spectrum. Yet most of the debate about drug prices focuses on less than 10% of drug prescriptions: the small share of the market held by patent-protected drugs. The vast majority of drugs that are prescribed each year – now 90% and more of prescriptions in the U.S. – are generic bio-equivalents of small cell pharma drugs or biosimilars of biologicals.[i] Yet there is limited understanding, at best, of the role that generics and biosimilars play in the U.S. pharmaceutical market.[ii]
History: Growth of generic prescriptions
Generic drugs have been available in the U.S. since the 1960s and earlier, but began to play a major role only with the passage of the Drug Price Competition and Patent Term Restoration Act, commonly known as Hatch Waxman, in 1984.[iii] Hatch Waxman extended patent life for innovator drugs while at the same time providing a regulatory pathway to gaining approval of Abbreviated New Drug Applications (ANDAs) for generic drugs. Key aspects of the act included access to data that allowed generic companies to begin to develop drugs prior to patent expiration (Bolar Provision), substituting bio‐equivalence testing for safety and efficacy testing requirements for generics, and offering 180 of market exclusivity for generic drugs that were first to file successful patent challenges (Paragraph IV provision). The changes had major impact on generic entry and, in turn, on drug revenues.
Figure 1 reports ANDA approvals in the U.S. from 1962 to 2018. From a base of 100 to 200 approvals per year in the 1970s, generic approvals grew rapidly after Hatch Waxman in 1984, subsided briefly while the generic pipeline was replenished, and then grew rapidly. In the eighteen years from 1967 to 1984, the U.S. Food and Drug Administration (FDA) approved 1,944 ANDA filings (mean 108 per year). During the next 18 years, from 1985 to 2002, 4,012 ANDAs were approved (223 per year). In the most recent 16 years, from 2003 to 2018, the rate doubled again as the FDA approved 7,764 ANDAs (485 per year). Indeed, in the past two years, approvals exceeded more than 800 ANDAs per year. This flood of data makes a simple point: generics have actively shifted from a secondary part of the pharmaceutical market to a major segment.
Figure 1. No. of U.S. Generic Approvals (ANDAs): 1966-2018
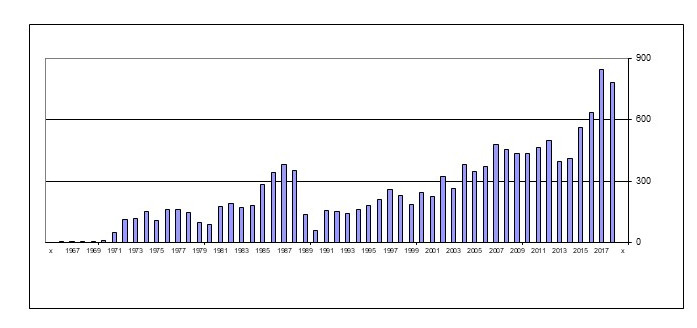
Source: U.S. FDA – https://www.accessdata.fda.gov/scripts/cder/daf/
In parallel, generic prescriptions now dominate U.S. clinical usage. In 1983, before the passage of Hatch Waxman, generic prescriptions accounted for less than 20% of the U.S. market. After Hatch Waxman, generic share grew to about 40% by the late 1990s and then more than doubled their share during the 2000s. [iv]
A major contributor to the recent growth in generic usage was the passage of the Medicare prescription drug benefit (Medicare Part D) as part of the Medicare Modernization Act of 2003. Medicare Part D expanded insurance coverage for drug usage by Medicare beneficiaries, while concurrently increasing incentives for insurance providers to place strong preferences for generics on their drug formularies. By 2018, generic usage reached at least 90% of prescriptions in the U.S.[v] Again, generics are hugely important parts of the market.
By contrast, the financial share of the market for generic drugs has grown much more slowly and, indeed, has fallen in the past five years. In 2013, generic share of revenues peaked at close to 30% of the market (when generic share of prescriptions was 86%), then fell to less than a quarter in 2017 (when generic prescription share had reached 90%).
The striking combination of many approvals, high share of prescriptions, and low share of revenues has been a safety valve for payers as prices of innovative drugs have increased.
Generic impact on branded pharma prices and revenues
Penetration of generic drugs has had a huge effect on drug prices and, in turn, on branded company revenues for individual drugs.[vi] Consider the following example.
Figure 2 depicts sales trends of Prevacid (lansoprazole) a proton pump inhibitor (PPI) for treatment of gastro-intestinal disease.[vii] Lansoprazole was developed by Takeda in Japan. In 1995, the drug was approved in the U.S. and co-marketed by Takeda Abbott Pharmaceuticals. Prevacid rapidly reached blockbuster status as sales grew to more than $3 billion per year in 2003. Then, even before Prevacid came off patent in the U.S., sales began to decline when a competing PPI, Astra Merck Incorporated’s Prilosec (omeprazole) came off patent in 2002 and its generics entered the market. In turn, when Prevacid itself came off patent in 2009 and multiple generic competitors entered the market, sales plummeted, falling to about $300 million in 2018 – 10% of peak revenue. Indirect and direct competition from generic drugs drastically deflated revenue of the branded drug.
Figure 2. Annual Sales ($ billion) Pre- and Post-Generic of Prevacid and Lupron, 1986-2018
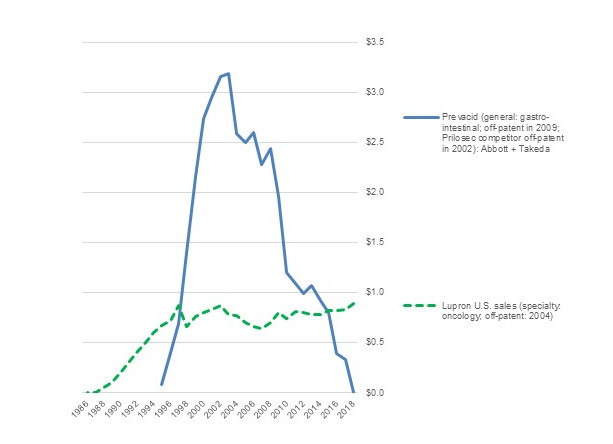
Source: Compiled from company annual reports
Variable versus fixed costs in innovative and generic pharma
The ability of generic entry to reduce prices reflects an important fact in the costs of pharmaceutical development, production, and marketing. The fixed costs of developing many drugs are very high, commonly in the hundreds of millions of dollars from lab initiation to completion of human trials. Moreover, when failed efforts are included in the calculations, the average fixed costs of R&D projects may exceed $2.5 billion.[viii] No matter what the estimates, developing new drugs is expensive, whether done in internal labs or by purchasing another company that paid for the initial development.
Yet, in a competitive market, prices do not result from fixed costs. R&D costs are largely sunk – and no payer is interested in covering expenditure that took place in the past. Instead, for any individual drug, prices need to cover the ongoing variable costs of producing and selling the drug, which typically are much lower than allocated total costs.[ix] For major branded bio-pharmaceutical firms, the median “cost of goods sold” (the cost to produce a drug) in 2018 was 28% of sales, while “selling, general, and administrative” expenses (an indicator of marketing costs) also was 28%. These costs largely vary directly with how many units of a drug are produced and sold. And, for any individual approved drug, the variable costs are the minimum of what a company needs to cover in order to justify its sales. [x]
R&D expenditures by major pharmaceutical firms also are high, averaging about 19% of sales in 2018. Yet, again, they are sunk costs and so are not relevant for the price of an individual drug.
Even if R&D costs are not relevant for the prices of individual drugs, across a company’s portfolio of drugs in multiple markets, the firm needs to cover its fixed costs as well as its variable costs in order to survive financially. This is the safe harbor that protection from competition via intellectual property rights provides. Patents create the ability to charge more than variable costs and so seek to cover total costs, because no other firm can offer the same product while patent protection is in place.
The gap between total costs and variable costs creates opportunities for price competition by firms that have lower variable costs and do not need to cover as much R&D expenditures. Bringing generic drugs to approval does require R&D expenditure, but typically lower than branded pharma. In 2018, global generic firms had median R&D/sales of about 6%, much lower than the 19% for major branded companies. Selling, general, and administration for the generic firms was about 22%, somewhat lower than the 28% for established pharma. The lower variable costs for marketing combined with lower R&D costs to allocate across a portfolio means that generic firms can operate at lower price levels while remaining financially viable.
Table 1 compares the cost structure of major branded bio-pharma and generic pharma companies from the U.S., Europe, and Asia in 2018. The generic companies have lower selling and R&D costs as a proportion of sales. However, their lower prices lead to substantially lower return on sales (9% vs. 16%) and a higher ratio of cost of goods sold (49% vs. 28%).
Table 1. Cost structure of Major Branded Bio-Pharmaceutical and Generic Pharma Companies
| Median values (2018) |
Branded |
Generic |
| Cost of Goods Sold (COGS) |
0.28 |
0.49 |
| Selling, General, & Administration (SG&A) |
0.28 |
0.22 |
| Research & Development (R&D) |
0.19 |
0.06 |
| Profitability: Return on Sales (ROS) |
0.16 |
0.09 |
|
|
|
| Number of firms in estimates |
# |
# |
| COGS |
34 |
22 |
| SG&A |
32 |
24 |
| R&D |
32 |
16 |
| ROS |
34 |
25 |
The critical role of competition
Yet simply coming off-patent does not deflate a drug’s sales. Figure 2 also depicts annual revenue of the oncology drug Lupron (leuprorelin/leuprolide). Like Prevacid, Lupron, was developed by Takeda and was introduced to the U.S. market by Takeda Abbott Pharmaceuticals. Introduced in 1986, Lupron has been off patent since 2004. Nonetheless, post-patent sales revenues have been stable, both in the U.S. and globally. Sales in 2018 were at least as high as in the last year of patent protection. What is the difference between the two drugs?
Despite coming from the same source and being marketed by the same companies, Prevacid and Lupron have two major differences. First, Prevacid is primarily used in general medicine and is substitutable with other PPIs or even other gastro-intestinal treatments. Lupron, by contrast, is used in specialized oncology medicine, where prescribers are much more reluctant to switch away from a drug that they are familiar with. Payers, meanwhile, are more hesitant to press specialists such as oncologists to switch to alternative less expensive cancer drugs than they are in more general medicines such as PPIs. Hence, for a specialty drug such as Lupron, patent status is less important than prescribers’ familiarity with the drug.
Second, and relatedly, Prevacid has far more generic competitors than Lupron. Lansoprazole (generic Prevacid) has more than 25 approved ANDAs by 18 different companies. By contrast, leuprolide acetate (Lupron) has only three active approved ANDAs. The difference is not primarily that one drug is more complicated to develop and manufacture than the other. Instead, because generic firms know that prescribers will be reluctant to switch, fewer competitors enter the market. In turn, with less competition, there is less pressure on prices.
The key point is that price reductions typically result, not from losing intellectual property protection, but from gaining competitors.[xi] Generics bring prices down markedly only if multiple generic companies enter the market. Otherwise, generic producers tend to price as high as possible., typically only slightly below the ceiling provided by the original branded drug.
The lack of competition has been the issue in high-profile price increases for generics such as Turing Pharmaceutical’s price increase in 2015 from $13.50 to $750 for the antiparasitic drug Daraprim (pyrimethamine) – for which Turing was the only supplier.[xii] Again, simply being generic does not reduce prices. Pricing discipline comes from competition.
Market exclusivity for generics
One wrinkle in the revenue impact of generics arises from Hatch Waxman’s Paragraph IV. This provision provides six months of market exclusivity for companies that successfully are the first to file challenges to drug patents. The six month exclusivity is a major incentive for aggressive generic companies to seek issues with patents, such as claims of obviousness, lack of novelty, and flaws in the patent filing, particularly for large market blockbuster drugs.[xiii] Following Paragraph IV entry, prices typically decline only slightly during the first six months, while the winning challenger operates without competition from other generic producers. Prices then typically decline drastically thereafter, as additional companies enter the market.
The FDA lists more than 1,000 Paragraph IV certifications.[xiv] Many of the challenges have been successful, leading to entry of generics well before the expected expiration of the original patents. Examples include Teva’s challenge of Merck’s Fosamax (alendronic acid), Lupin’s challenge of Sanofi’s Altace (ramipril), and Sandoz’s challenge of AstraZeneca’s Atacand (candesartan), among many others.
Indeed, aggressive generic companies such as Teva highlight their Paragraph IV initiatives. In 2018, for instance, Teva’s annual report noted that about 70% of the 297 ANDAs in its pipeline had Paragraph IV status, including 107 with first-to-file standing for drugs with current annual market revenue of $74 billion.[xv]
Branded company responses to generic competition
Branded companies have responded actively to their generic competitors, with mixed success.
Many tactics to compete with or block generics have not worked
Several tactics to push back against generic competition have largely failed. Most major branded companies have entered the generic market themselves, but typically withdrawing or cutting back once they find that the two business models tend to be incompatible. Novartis’s generic subsidiary, Sandoz, is the major exception to this rule, although Sanofi, Abbott, and several other established pharma companies do continue to operate in the generic segment. Companies and related industry associations have attempted public relations campaigns claiming lack of reliability of generic drugs, with limited success. Attempts to promote federal or state legislation that would limit generic competition also typically have failed. Similarly, most efforts to claim that generics have not achieved bio-equivalence with the original drug have not taken hold. Such reactive strategies have not held back generics.
Indeed, as Figure 3 shows, by the late 1990s, median profitability of major generic companies had reached the same levels as established branded pharma. In the early 2000s, though, a gap between branded and generic pharma profitability re-emerged, with profits of established pharma trending up and generic pharma trending down.
Figure 3. Return on Sales (ROS) of Major Branded vs. Generic/Specialty Pharma Firms, 1993-2018
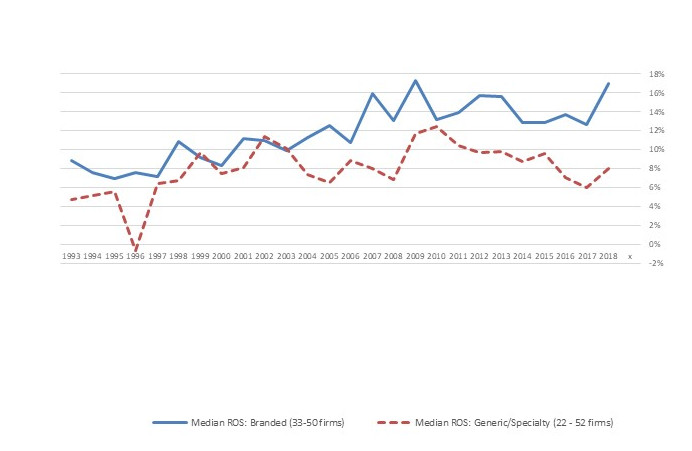
Source: Compiled from company annual reports
Note: The “generic/specialty” category includes companies that sell generic drugs and those that sell specialty branded pharmaceuticals because many such firms operate in both segments.
Three tactics to address generics have worked
The growing profitability gap partly reflected three proactive tactics from branded pharma companies. First, branded pharma firms now typically introduces their own “authorized generics” when they face competition from generic entrants, sometimes marketing the drugs themselves and other times licensing the rights to sell their drugs to other generic firms that have market access in the generic segment. This tactic means that the Paragraph IV winner does not have the market to itself during its 180 days of exclusivity and so faces a lower price ceiling that reduces generic profitability.
Second, branded companies appear to have become increasingly adept at stretching out the highly complex litigation concerning Paragraph IV and other patent challenges. [xvi] As a result, even if the challenges succeed, there often is relatively little of the original patent life remaining before generics enter the market.
Third, branded companies have negotiated many “pay for delay” deals with generic challengers, commonly resulting in withdrawal of the Paragraph IV filings – with no other challenger now able to achieve first-to-file status. With these deals, the generic challenger agreed to remain off the market in return for a typically undisclosed compensation. In practice, pay for delay means that prices typically remain higher longer than they might otherwise, with the originator and challenger firm sharing the benefits. Pay for delay deals are highly contentious in the U.S., with continuing debate about competing legal theories – in Europe and Canada, by contrast, courts and legislation have largely ruled out such agreements. The U.S. Federal Trade Commission has filed multiple lawsuits in attempts to block the deals.[xvii] In contrast, many branded and generic pharmaceutical companies argue that the deals remove uncertainty from the market and therefore facilitate trade.[xviii] The bottom line, though, is that the deals lead to delays in generic entry in the U.S. – with lower competition, comes higher prices of branded drugs.
Pricing and survival pressures on generics
The profitability gap in Figure 3 also reflects stronger pricing pressure from third-party payers. Faced with increasing prices of new biological drugs, payers in the U.S. and elsewhere are negotiating more demanding terms with generic firms. In practice, many payers are promoting a dual-track strategy for generics: increasing incentives to prescribe generic drugs, leading to the growing market share, while tightening generic prices when there are multiple providers, thereby leading to lower profitability in the generic sector.
Although there is high variance in estimates of the generic market size, growth in global sales of the leading firms in the generic industry has slowed. From the early 2000s to 2011, as the share of generic prescriptions grew rapidly, sales revenue of about 30 major firms grew from about $30 million to about $70 million. During the past decade, despite continued growth in prescription share, sales grew more moderately, to about $78 billion in 2018 and, in fact, have declined from $83 million in 2014.[xix] Hence, despite its dominant share of prescriptions, the generic market is a demanding competitive space, with substantially lower profits over the past decade.
In turn, the generic industry is highly dynamic in both entry and exit. Between 2002 and 2018, 485 unique firms from countries throughout the world received approval of at least one ANDA from the U.S. FDA. Few remained active for long. Of the 389 firms that had entered by 2016, 78% appear to have exited the market.[xx] Nonetheless, despite this history of exits, entry has continued – 96 first-time firms received ANDA approvals in 2017 and 2018. Barriers to entry of new generic firms remain low.
As a result, active consolidation in the form of multiple ongoing mergers and acquisitions in the sector has not led to substantial market power. The Hirschman Herfindahl Index (HHI) for the market shares bases on the global revenues of major generic competitors in 2018 was only 770, well below the 1500 level that signals concerns about market concentration.[xxi] Indeed, if we base concentration on number of U.S. ANDA approvals rather than global revenues, the ANDA-calculated HHI in 2018 was only 225. During 2018 alone, 819 ANDA approvals were granted to 183 unique firms, with 16 receiving more than ten approvals. Hence, the U.S. generic market continues to attract entry and remains competitive.
The core point here is that, even in the face of aggressive tactics by established branded pharma firms, the generic pharma industry places substantial pressure on branded pharma prices and revenues. In turn, generic pharma revenues account for a much lower share of total sales in the market than their major share of prescriptions. Quite simply, generic pharma has been a key safety valve in the pharmaceutical market.
The biological and genetic revolutions
But what of the new, expensive biological and gene-based drugs that are exploding drug budgets throughout the world? Have the new drugs constricted the generic safety valve?
The biological scientific revolution that began in the 1970s and 1980s was slow to take hold in the market. Although Genentech’s Humulin human insulin (licensed to Eli Lilly) received approval in 1982 and the same company’s Protopin growth hormone was approved in 1985, new biological-based drugs only trickled into the market until the late 2000s. In the past decade, though, biological approvals have exploded, followed more recently by approvals for gene-based therapies. As Figure 4 shows, biological approvals are now one-third or more of total new drug approvals in the U.S.
Figure 4. No. of FDA Approvals, New Molecular Entities (NMEs) and Biologicals (BLAs), 1942-2018
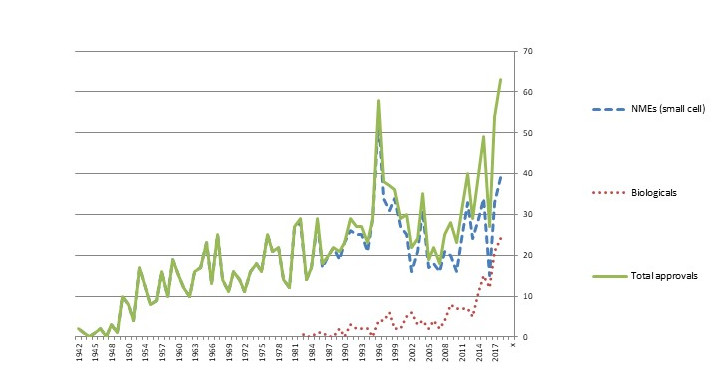
Source: U.S. FDA
Note: The spike in approvals in 1996 was the result of the Prescription Drug Use Fee Act (PDFA), which cleared a backlog of delayed applications.
Multiple firms have received approvals of biologicals. Some are biological specialists with little or no participation in the traditional small cell market. Others are established pharmaceutical firms that have added biologicals to their portfolios, often by allying with or acquiring development stage companies. The 168 biologicals approved from 1982 to 2018 included 77 unique firms, with the leaders being Roche/Genentech (17 approvals), Amgen (12), and Johnson & Johnson (8): an established pharmaceutical firm that acquired a bio pioneer (Roche-Genentech), a bio specialist (Amgen), and an established pharma firm that acquired and licensed in multiple bio entrants (J&J).[xxii] The potential pay-off has attracted a wide range of entrants from North America and Europe, and, increasingly, from Asia.
Many of the new classes of drugs have had huge impact on human health. Biological-based drugs have revolutionized treatments of many types of cancer, immunological disease, optical diseases, endocrinological disorders, and multiple other conditions. New gene-based therapies offer true promise for lipoprotein deficiencies, muscular atrophy, and other debilitating conditions. The innovations are a win for both economic development and health.
This win has come with a price tag for payers. Where payments of thousands of dollars once seemed high, list prices for courses of treatments involving biological-based drugs now commonly reach into the tens and hundreds of thousands of dollars. Indeed, some biological and gene-based therapies for rare diseases have list prices that exceed a million dollars per treatment. Understandably, payers are concerned and even frightened of the impact on their budgets.
The high list prices for biologicals, although typically well above prices actually negotiated by pharmaceutical benefit management firms and other third-party payers, have translated into growing revenues in the branded bio-pharma industry, especially in the U.S.[xxiii] Total reported U.S. revenue for major bio-pharmaceutical firms grew from about $150 million in the late 1990s to about $250 million in 2007, then stabilized until 2014. During the past four years, though, reported U.S. bio-pharma revenues have increased again, exceeding $300 million in 2018.[xxiv] Much of this revenue growth was fueled by the explosion of higher-priced biological drugs.
The common explanation of the high prices of biologicals is development cost of individual drugs, combined with the need to pay for development dry holes. Again, though, R&D is a sunk cost.
Instead, rather than R&D costs, the primary driver of the ability to charge high prices is high health value relative to alternative drugs and other treatments, combined with few competing products. Hence, even as their budgets have been pressed, third-party payers have been reluctantly willing to incur the higher costs, though typically after negotiating discounts and rebates in return for preferred market access. The patent life of the drugs provides barriers to competition that keep payers from pushing prices down to variable costs, thereby allowing successful companies to recover their total costs across their portfolios, including the sunk costs of R&D.
The big question, now, is whether we will see the same safety valve as biological drugs come off patent. Will “generic” versions place direct pressure on prices as individual biologicals come off patent and indirect pressure as biologicals that provide similar benefits lose their proprietary rights?
Biosimilars
Owing to their different technological basis, copies of biological drugs do not fall within the bio-equivalence realm of small-cell pharma. Instead, replications of originally biologics are “highly similar” to the original biologic medication. In turn, emerging regulatory initiatives are defining the conditions under which officially approved products and be marketed after patents expire. In the U.S., biological licensing applications (BLAs) for such “biosimilars” typically require functional studies and human clinical trials.
Regulatory pathways
Multiple countries have introduced regulations to guide approval and introduction of biosimilars. The European Medicines Agency in the European Union was among the first, with an initial framework set up in 2004-2005 and first approval in 2006.[xxv], [xxvi] Other countries soon followed with acceptance of biosimilars, including Canada (2006 regulations; first approval in 2009), New Zealand (first approval in 2012), and Japan (first approval in 2014).[xxvii] By contrast, the U.S. did not create a biosimilar framework until the Biologics Price Competition and Innovation Act of 2009 was passed in 2010, with the first approval occurring in 2015. The U.S. has been late to the biosimilar party.
Not surprisingly, there is substantially more biosimilar competition in Europe than in the U.S. For instance, nine biosimilars of filgrastim (Amgen’s Neupogen) had been approved in Europe by late 2018, while only Sandoz’s biosimilar Zarxio (filgrastim-sndz) and Pfizer’s Nivestym (filgrastim-aafi) had been approved in the U.S., in 2015 and 2018. In total, at least 55 biosimilars had been approved in Europe by late 2018,[xxviii] while only 16 had been approved in the U.S. by the end of that year. [xxix]
Biosimilar impact on revenues in the biological market
Not surprisingly, the price impact from biosimilars has come earlier in Europe and Canada than in the U.S. The extent of the price reductions is ambiguous, as negotiations are often confidential. Nonetheless, market analysts suggest about a 15% price reduction when a biosimilar first enters the market and reductions in the range of 35% when the second biosimilar enters, with the originator company usually matching the price cuts.[xxx]
With the price matching, the originator sometimes holds its prescription market share, owing to prescriber familiarity with the drug and the availability of supporting services such as infusion clinics. The continued lead by the originator products has been controversial, with the biosimilar companies filing complaints about unfair practices. [xxxi] Nonetheless, total revenue for the original drug sometimes begins to decline.
Figure 5 reports a relevant example, comparing sales trends of Humira (adalimumab), Remicade (infliximab), and infliximab biosimilars. Both adalimumab and infliximab are injectable monoclonal antibodies in the TNF inhibitor class, used for a wide range of autoimmune disorders. Both drugs have made major contributions to improving human health.
Figure 5. Sales Trends ($ billion) of TNF Inhibitors: Humira (adalimumab), Remicade (infliximab), and infliximab Biosimilars
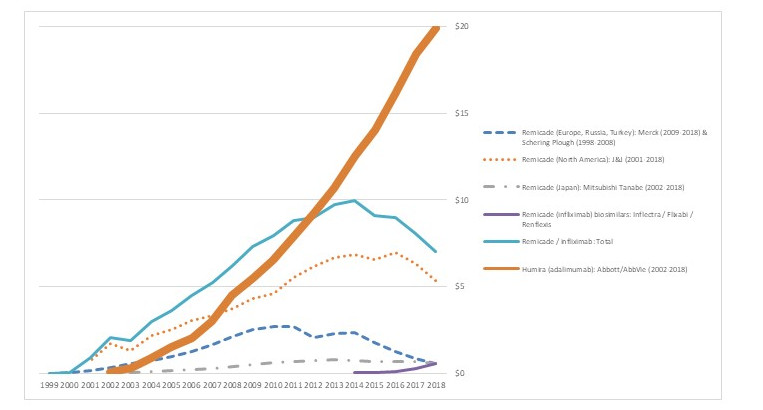
Source: Compiled from company reports
Remicade is sold in North America by Janssen/Johnson & Johnson, in Europe by Merck (previously by Schering Plough), and in Japan by Mitsubishi Tanabe. Remicade faced biosimilars in Europe in 2013 (Inflectra/Remsina, from Hospira/Celltion/Pfizer), followed by a three year lag until 2016 for the first infliximab biosimilar approval in the U.S. (Inflectra). As the figure shows, Remicade’s global sales began to decline in 2014, following the European biosimilars, and then increasingly declined in 2017, following the U.S. approvals. Remicade revenue in Japan began to decline in 2018, following the approval of Inflectra. Although the rates of decline differ, biosimilars have had an impact on Remicade revenues in all three countries.
Market penetration by the biosimilars themselves has been mixed. In Europe, Celltrion’s Remsina may now have more than half the market.[xxxii] In the U.S., by contrast, biosimilar competitors to Remicade such as Inflectra have gained only limited market penetration. In either case, though – whether through biosimilar success in the market or by downward pressure on prices of the original drug – the biosimilars have led to lower prices.
Barriers to biosimilars
Yet biosimilar approval alone does not lead to lower prices and reduced revenues. The revenue trends for Humira in Figure 5, the world’s largest selling prescription drug, are strikingly different to Remicade. The differences arise both from later approval of biosimilars and market barriers to approved biosimilars.
Until recently at least, Humira sales have continued to grow in both Europe and the U.S. In Europe, Humira’s patent expired in 2017 and two biosimilars were launched in 2018, by Amgen and Biogen/Samsung Bioepsis. It is likely that the biosimilar competition will deflate Humira revenue in Europe in the near future.
In the U.S., although biosimilar approvals pre-dated those in Europe, pressure on Humira revenue may be weaker. Although the FDA has approved several biosimilars of adalimumab (Amgen’s Amjevita in 2016, Boehringer Ingelheim’s Cyltezo in 2017, Sandoz’s Hyrimoz in 2018, and Samsung Bioepsis’s Hadlima in 2019), AbbVie has been able to stave of competition by filing a broad set of extension patents and then negotiating deals that will hold eight potential competitors – including some that have not applied for biosimilar approvals – off the market until 2023. [xxxiii] The potential competitors have been willing to settle in order to avoid the uncertainty of whether they would win lawsuits concerning the patent extensions. While some analysts argue that Humira prices and revenue in the U.S. will decline even without direct competition, in the face of pressure from third-party payers that may provide preferred market access to alternative TNF inhibitors such as Remicade, any such decline has not yet occurred.
Revenue trends for Amgen’s Epogen (etanercept) reinforce the point that simply gaining approval for biosimilars is not enough to add pricing pressure. The U.S. FDA has approved two biosimilars of Enbrel – Erelzi from Sandoz in 2017 and Eticovo from Samsung Bioepsis in 2019. However, although biosimilars of etanercept have been approved and sold in Europe and Canada for Sandoz (2016) and Samsung Bioepsis (2017), Sandoz and Amgen have been locked in litigation that has blocked Erelzi from entering the U.S. market.
Figure 6 highlights the differential impact on Enbrel revenues in the different geographies. In Europe, where the drug is marketed by Pfizer and faces competition from biosimilars, Enbrel revenue is down by about half. In the U.S., by contrast, despite a moderate decline in 2018, Enbrel’s sales have remained high.
Figure 6. Sales Trends ($ billion) of Epogen (etanercept)
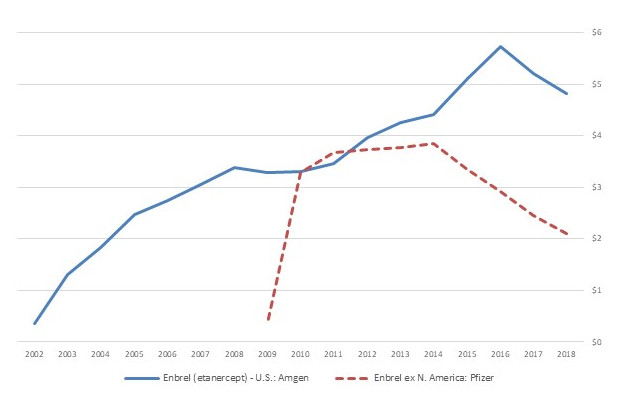
Source: Compiled from company reports
Why have biosimilars had less impact so far in the U.S.?
The examples above highlight the point that, so far, although biosimilars have led to somewhat lower revenue for the original drugs in the U.S., the effect is less than in Europe. Two factors help explain this.
Firs, biosimilar regulation was slower to take hold in the U.S., slowing down entry. In part, the slowness reflects both technical ambiguity and political challenges that arose in agreeing on a framework. Even though discussions began as early as the late 1980s and the first bills were introduced in 2006, the legislation did not pass until 2010.[xxxiv] In turn, it took the FDA several years to publish guidelines for developing and registering biosimilars.[xxxv]
Second, the slower impact also reflects strategies of biological incumbents. As we have seen in the examples above, bio-pharmaceutical incumbents have sought to slow competitive entry of some approved biosimilars, whether by challenging the validity of the approvals or signing pay-for-delay deals. In addition, incumbents have been active in litigation seeking to clarify multiple aspects of the legislation,[xxxvi] which has had the perhaps unintended consequence of delaying full implementation.
Hence, although biosimilars are beginning to provide the safety value of traditional generics, the valve has opened much more slowly in the U.S. than in Europe and other countries.
Will biosimilars have more impact on prices and revenues in the future?
The blockage in the biosimilar pipes does appear to be loosening in terms of approvals and in somewhat lower revenues for incumbents. During 2018 and the first seven months of 2019, the FDA approved 14 biosimilars, compared to only 9 in the previous three years.[xxxvii] The 23 total approvals from nine unique companies cover nine original biological drugs.
In turn, revenues for most reference biologicals that now face biosimilar competition in the U.S. were are undergoing at least moderate decline by the end of 2018. Nonetheless, the jury is still out – in some cases, almost literally, given the ongoing litigation – on how quickly the disciplining impact will take hold in the U.S. market.
Certainly there are incentives to take advantage of the biosimilar competition. Perhaps the most likely agents for moving the impact of biosimilars forward are private and public third-party payers. As more biologic alternatives become available in the market – both biosimilars and competing new biologicals – private insurers and pharmaceutical benefit managers are in increasingly strong positions to negotiate discounts in return for market access. In the public payer market, reductions may take hold if Medicare gains the right to negotiate prices for the drugs that they administer, although any such changes are politically uncertain and are likely to be multiple years in the future.
Looking forward
The core point here is that generic versions of traditional drugs and biosimilars of new biological medicines are hugely important yet under-recognized parts of the pharmaceutical market. So long as there is meaningful competition, their presence in the market leads to substantially lower prices, helping payers negotiate and manage their budgets.
This sequence is a sign of an effective market for innovation. Innovative drugs have a period of patent-protected safe harbor during which they can recover the high fixed costs of creating new drugs. Once patents expire, multiple entrants then provide longer-term pricing discipline, along with incentives to develop new innovative drugs that will enjoy the higher-priced safe harbor. The sequential combination of profitable innovation followed by pricing discipline in a competitive market offers major benefits for both economic development and human health. For the most part, the current pharmaceutical market has an effective balance.
Yet there are substantial barriers to competition in the current pharmaceutical market, which may inhibit market discipline on drug prices. Some barriers are political and regulatory, while others reflect strategies that take advantage of grey areas in the law. Rather than attempt to regulate pharmaceutical prices directly – which would inevitably be clumsy and lead to attempts to circumvent price regulations – public policy will better serve the market by promoting competition.
Fortunately, most of the norms and rules of competition are in place in the U.S. and other major markets. The challenge going forward is to reinforce those norms and rules.
Endnotes
[i] Small cell drugs are organic compounds that affect biologic processes with relatively low molecular weights, while biologicals are drugs based on proteins with therapeutic effects, made from living microorganisms of animal or plant cells. Small cell pharma was the primary focus of pharmaceutical development prior to the 1980s, when the biological revolution emerged as an important complement.
[ii] Clayton P. Wiske, Oluwatobi A. Ogbechie, and Kevin A. Schulman. October 29, 2015. Options to promote competitive generics markets in the United States. JAMA Generics, E1-E2. doi:10.1001/jama.2015.13498.
[iii] See http://plg-group.com/wp-content/uploads/2014/03/Overview-of-the-Hatch-Waxman-act-its-impace-on-Drug-Develo.pdf
[iv] Figures collected by the author from the Generic Pharmaceutical Association, IMS/IQVIA, and other sources.
[v] Generic usage in other traditional developed economies has also grown, though typically to somewhat lower levels.
[vi] I will focus on revenues rather than prices, because prices for even the same drug are highly varied and often ambiguous due to proprietary discounts and rebates. By contrast, revenue information based on company reports and industry analysis provides reliable trends.
[vii] These figures and other drug revenues are based on annual company reports.
[viii] J.A. DiMasi, H.G. Grabowski, R.W. Hansen, 2016. Innovation in the pharmaceutical industry: New estimates of R&D costs. Journal of Health Economics, 47: 20-33.
[ix] Will Mitchell. 2018. Pharma Prices Are Not Too High (Usually). Health Management Policy and Innovation, Volume 3, Issue 2. https://hmpi.org/2018/10/14/lead-article-pharma/
[x] The cost of goods sold, selling, general, and administration, and R&D ratios are average values of figures reported by about 30 global pharmaceutical firms based in Europe, North America, and Japan.
[xi] H.G. Grabowski, D.B. Ridley, K.A. Schulman. 2007. Entry and Competition in Generic Biologics, Managerial and Decision Economics, 28(4-5): 439-453.
[xii] https://www.nytimes.com/2015/09/21/business/a-huge-overnight-increase-in-a-drugs-price-raises-protests.html
[xiii] https://www.cornerstone.com/Publications/Research/Trends-in-Paragraph-IV-Challenges
[xiv] https://www.fda.gov/media/82686/download
[xv] Teva Pharmaceutical Industries Limited, Form 10 K, Report to the Securities Exchange Commission for the fiscal year ended December 31, 2018, page 61.
[xvi] https://www.americanpharmaceuticalreview.com/Featured-Articles/348913-Intricacies-of-the-30-Month-Stay-in-Pharmaceutical-Patent-Cases/?catid=25273
[xvii] https://www.ftc.gov/news-events/media-resources/mergers-competition/pay-delay
[xviii] https://www.forbes.com/sites/matthewherper/2011/05/09/stop-demonizing-drug-companies-over-pay-to-delay-deals/#505593462135
[xix] Author’s calculations, based on company reports.
[xx] Author’s calculations, based on U.S. FDA data. https://www.accessdata.fda.gov/scripts/cder/daf/
[xxi] Calculation based on reported company sales.
[xxii] Figures calculated from U.S. FDA data. https://www.accessdata.fda.gov/scripts/cder/daf/
[xxiii] Kevin A. Schulman and Matan Dabora. 2018. The relationship between pharmacy benefit managers (PBMs) and the cost of therapies in the US pharmaceutical market: A policy primer for clinicians. American Heart Journal, 2016: 113-122. https://doi.org/10.1016/j.ahj.2018.08.006
[xxiv] Figures based on reported U.S. revenue for a composite set of 30 to 42 (depending on year) of major bio-pharmaceutical firms based in the U.S., Europe, and Japan.
[xxv] M. Schiestl, M. Zabranksy, and F. Sorgel. 2017. Ten years of biosimilars in Europe: Development and evolution of the regulatory pathways. Drug Design Development and Therapy, 11: 1509-1515.
[xxvi] A. Harston. 2018. How the U.S. compares to Europe on biosimilar approvals and products in the pipeline. Rothwell Figg. https://www.biosimilarsip.com/2018/10/29/how-the-u-s-compares-to-europe-on-biosimilar-approvals-and-products-in-the-pipeline-3/
[xxvii] Generics and Biosimilars Initiative. December 14, 2018. Biosimilars approved in Canada. http://www.gabionline.net/Biosimilars/General/Biosimilars-approved-in-Canada
[xxviii] A. Harston. 2018. How the U.S. compares to Europe on biosimilar approvals and products in the pipeline. Rothwell Figg. https://www.biosimilarsip.com/2018/10/29/how-the-u-s-compares-to-europe-on-biosimilar-approvals-and-products-in-the-pipeline-3/
[xxix] https://www.fda.gov/drugs/biosimilars/biosimilar-product-information
[xxx] https://www.biopharmadive.com/news/merck-launch-remicade-biosimilar-discount-jnj-pfizer/447939/
[xxxi] S&P Global Market Intelligence. September 4, 2018. Pfizer complains to the FDA about J&J, Amgen comments on biosimilar products. https://www.spglobal.com/marketintelligence/en/news-insights/latest-news-headlines/46275504
[xxxii] https://www.centerforbiosimilars.com/news/celltrion-says-its-biosimilar-has-gained-56-of-the-european-infliximab-market
[xxxiii] https://www.biopharmadive.com/news/abbvie-boehringer-ingelheim-settle-humira-patent-biosimilar/554729/
[xxxiv] K.H. Carver, J. Elikan, and E. Lietzan. 2010. An unofficial legislative history of the Biologics Price Competition and Innovation Act of 2009. Food and Drug Law Journal, 65 (4): 617-818.
[xxxv] Jennifer Fox. July 25, 2018. Biosimilars: Challenge and barriers to entering the U.S. market. American Pharmaceutical Review. https://www.americanpharmaceuticalreview.com/Featured-Articles/352224-Biosimilars-Challenges-and-Barriers-to-Entering-the-U-S-Market/
[xxxvi] See Jennifer Fox (2018) above.
[xxxvii] https://www.fda.gov/drugs/biosimilars/biosimilar-product-information


