HMPI

Value-Based Pricing as a Signal for Drug Innovation

 Jennifer Ohn, MPH, Anna Kaltenboeck, MS, Memorial Sloan Kettering Cancer Center

Contact: Anna Kaltenboeck, kaltenba@mskcc.org

Abstract

What is the message?

In today’s pharmaceutical drug market, revenue is not directly associated with value. As drug prices increase, the financial burden is felt by payers and patients alike. Various strategies are undertaken to address this issue, but none addresses the conflicting market signals for what types of innovation are valuable. Incorporating analytic evaluations of value, value-based pricing takes aim at the increasing prices for the healthcare system and for patients.

What is the evidence?

Assessment and evaluation of current market strategies among stakeholders involved in the drug pricing supply and reimbursement chain.

Submitted: September 9, 2018; accepted after review: September 17, 2018

Cite as: Anna Kaltenboeck, Jennifer Ohn. 2018. Value-Based Pricing as a Signal for Drug Innovation. Health Management Policy and Innovation, Volume 3, Issue 2.

Introduction

By announcing that it would require new drugs to meet a threshold of $100,000 per quality adjusted life year (QALY) or face exclusion from their formulary, CVS Caremark, one of the largest pharmacy benefit managers (PBM) in the US, fired the latest salvo in the debate about the price of drugs in relation to their value.1 For years, the prices of specialty branded drugs have commanded headlines with their continued ascent, both for drugs dispensed by pharmacies and for those administered by physicians. This trend has highlighted the need for an analytic alternative to current approaches – an alternative by which a drug’s attributes and outcomes are systematically evaluated by the many stakeholders involved. Financial pressures due to the rise in prices have raised questions about what we are willing to trade off to pay for new drugs. The controversy has become particularly pressing at the state level, where drug coverage can significantly affect Medicaid spending, which comprises 28.7% of all total state budgets, as well as among patients who struggle to afford the out-of-pocket payments for their prescriptions.2 Beyond affordability concerns, compromises made to afford high-priced drugs often result in access restrictions that hamper the ability of patients to use therapies from which they might otherwise benefit.

Revenue as a Driver of Innovation: An Imperfect Signal of Value

By definition, affordability and access are linked to price and volume, the two variables that make up the revenue equation for drug manufacturers. These revenues act as the reward for innovation and commercial success, funding ongoing R&D efforts in hopes of developing innovative therapies and allowing manufacturers to recoup the expenses of clinical development. Formalized under the Drug Price Competition and Patent Term Restoration Act of 1984 (Hatch-Waxman Amendments), this arrangement grants branded drugs a period of time on the market during which they are protected from competition by generics or biosimilar equivalents of biological drugs. Underlying this approach is the assumption that revenue potential for new drugs offers a good signal about what type of innovation is valued, and that manufacturers will invest accordingly. Where this alone fails to offer sufficient inducement, such as with rare diseases with small populations, further provisions are offered to improve the payoff for innovation through tax credits, additional periods of exclusivity, and less burdensome regulatory review.

In an ideal market, greater revenue would be associated with greater value; however, for drugs, the market often fails to provide such clear direction. The current system of purchasing and reimbursement operates on transaction fees, spread pricing, and markups that generally have the effect of increasing pressure on prices. A well-known example is the gap between the list and net prices of drugs dispensed by pharmacies. Known as the “gross to net differential”, this disconnect arises from discounts and rebates provided by manufacturers throughout the supply chain to encourage preference for their drug, often at the expense of access to competitors’ drugs. Another is the practice of “buy-and-bill”, in which physicians are reimbursed for administering a drug plus its cost and a percentage markup, creating incentives to prefer higher priced drugs when the opportunity arises. For example, prescribing tendencies in oncology show a bias toward higher priced drugs; all other things being equal, drugs being offered at a lower price could find themselves at a competitive disadvantage compared to their more expensive peers.3

These practices result, among other things, in directionally problematic signals to the market about what types of innovation are valued.  For example, as of 2017, there were over 5,789 therapies in pipeline for oncology, more than 7 times the number of therapies in development for cardiovascular disease;5 yet the health impact of the two disease categories is similar – 1.2 years of life are lost due to malignancies for every one lost to cardiovascular disease.6 Prices of oncology drugs have been increasing over time, even when adjusted for life year gained, begging the question of how well existing incentives perform in driving drug development.7

Solutions to Date: Limited Impact

There has been no lack of proposed solutions to these problems, and many have already been implemented (see Table 1). One approach is to modify incentives within the supply chain, built on the thesis that addressing these financial interests reduces their inflationary pressure on drug prices. Efforts such as these may offer financial enticements for granting access to treatments that are known to provide certain health outcomes. This is a frequent feature of risk-sharing agreements, such as those in which health plans and providers are paid at least in part according to the number of patients receiving preventative care and screening or how many with diabetes achieve blood sugar control targets.8,9 Centers for Medicare and Medicaid Services (CMS) created the Star Rating System in 2007 with the goal of increasing payer accountability among their Medicare plans. Plans are rewarded through quality bonus payments (QBP) and Medicare Advantage rebate percentages based on the Star Rating and its bid. In the Medicare Shared Savings Program Accountable Care Organization model, participating provider organizations are rewarded when costs in Medicare Part A and B are lowered. Provider risk-sharing is also the rationale behind bundled payments; providers receive a fixed reimbursement for a particular bundle of care, with the choice of treatment left up to them. However, there is little or no evidence to suggest that these solutions have changed formulary placement and treatment selection in ways that reward value.

Table 1. Approaches for mitigating incentives for high drug prices


Approach


Premise

Changing payment practices Risk-sharing: By rewarding health plans and providers for performance on population-level outcomes measures, they  are incentivized to prefer treatments that improve outcomes
Bundled payment: By paying for a bundle of care or for meeting certain performance metrics, providers are incentivized to select treatments that improve care quality
Competitive acquisition & white bagging: By disintermediating providers from the purchasing process, payers can mitigate markup incentives that promote inflation
Changing patient incentives Cost-sharing: Increasing the patient’s share of a drug’s cost, they create downwards pressure on prices of drugs
Value-based insurance design (VBID): Matching the cost-sharing levels with evidence-based measures, health plans are able to  direct patient decision-making to reflect value
Value-based pricing Systematic analyses to determine a price based on a drug’s attributes and stakeholder preferences

Another approach to the problem is to change patient incentives in an effort to leverage their sensitivity to cost. Health plans are able to do so by shifting payment responsibility for a greater portion of the cost to beneficiaries through both high deductibles and higher co-pay and co-insurance rates. Value-based insurance design (VBID) also takes aim at this price sensitivity but instead harnesses it by lowering out-of-pocket payments for drugs that health plans would like to encourage them to use.

These approaches face a major practical barrier:  manufacturers can counteract this shift by providing copayment support to offset the out-of-pocket spending, making the tool moot. Copay assistance programs prevent patients from acting as consumers and undermine insurance companies’ leverage. Absent copay support, many patients are effectively priced out of the market, directly affecting adherence to potentially beneficial drugs. One study found that patients facing higher copayments for imatinib (Gleevec), a drug used to treat chronic myeloid leukemia and a number of other cancers, were significantly more likely to discontinue treatment than those with lower out-of-pocket expenses, putting them at risk of disease progression.10

The overarching drawback in these two approaches is that they do not address the issue of the unclear signal in the market of what treatments have value. None do away with confidential net price concessions in exchange for patient access. This makes it unclear what price would be acceptable for extending the incremental benefits of a new therapy to as many patients as could use it.

Potential Solution: Value-based Pricing

Benefits of value-based pricing

Value-based pricing aims to solve the problem of conflicting signals by offering a transparent and replicable analysis of the available evidence that reflects public input.11 The resulting price captures only the value of a drug’s incremental benefits over existing options, that is, it quantifies the price at which the financial trade-offs for offering treatment to all eligible patients would be net beneficial to patients and a good value for the healthcare system as a whole. In addition to providing a clearer understanding of what trade-offs must be made to maximize the health gains of new therapies, this model also gives manufacturers a clear line of sight of the desired attributes of new therapies without including the additional distortions that are added through purchasing and reimbursement transactions.

Overcoming implementation challenges

The challenge of value-based pricing lies in its implementation. To work effectively over a drug’s life cycle, pricing must be set at market entry. As post-approval evidence becomes available, the price should be adjusted accordingly to ensure that health gains continue to be captured and innovation incentivized accordingly; yet, current payment practice is not yet equipped for this. To be successful, this approach also requires that access be granted to those drugs that are priced at or below value, and penalizes those that are not.

This also brings up major challenges in multi-stakeholder buy-in. In the immediate term, systematic and complete implementation of such policies would be a heavy lift for payers. The challenge is especially striking for novel drugs with few competitors. New York State’s experience illustrated this challenge when Vertex12 , the manufacturer of the cystic fibrosis drug Orkambi, dismissed calls to bring its price in line with the drug’s value.

CVS acknowledges this limitation by exempting drugs with breakthrough designation from their program. But the industry, particularly health plans and PBMs, can gain practice in less contentious areas. Most branded drugs with multiple competitors that have similar benefits already compete heavily on net price to capture market share through formulary placement. By predicating coverage on their ability to meet or beat a value-based price, they would be forced to compete for patient preference or face exclusion from the formulary.

Outpatient drugs pose a different problem as neither list nor net price are incentivized to be lower. Unlike pharmacy benefits, medical benefits have no formulary, so there is no existing pathway for creating preference on the part of health plans. Here, plans can turn to what is known as “white bagging”, or competitive acquisition, an alternative system of reimbursement under which physicians order drugs on demand from a specialty pharmacy or distributor that will deliver it to the provider on behalf of the patient. This arrangement allows the health plan to pay the pharmacy or manufacturer for the drug, circumventing the markup to physicians and paying them in other ways to encourage value-based care. Already being used by a number of plans, this approach enables them to begin managing access according to whether or not a drug meets a value-based price.13

Looking Forward

Still in its infancy, the shift to value-based pricing will require changes to how the healthcare industry conducts its business. Conditioning formulary placement and provider payment on whether a drug has a value-based price are important first steps.14 Until recently, health plans’ coverage policies were driven primarily by pharmacy and therapeutics committee  reviews that focused on efficacy and safety; adding the assessment of value will require, at a minimum, new processes and skills. In the long run, extending the approach to branded drugs with limited competition and following through by managing according to value across benefit type will likely alter the financial relationships between health plans and providers, manufacturers, and employers.

In the short term, changes that are already underway as part of separate efforts to control costs or improve quality may offer opportunities to provide broader and more affordable access to drugs with value-based prices. Manufacturers have begun to place bets that this evolution will continue.  Novartis priced tisagenlecluecel (Kymriah) separately for its adult and pediatric uses to reflect differences in its value for each indication.15 The success of this strategy has yet to be determined, but they may hope for success similar to Regeneron’s, which was rewarded for improved access and exclusive formulary position by Express Scripts when it repriced alirocumab (Praluent) to align with ICER’s assessment of PCSK9 inhibitors.16


References

  1. Silverman E. CVS exec: Out new reliance on cost effectiveness should make drug makers ‘think about launch prices’. STAT News.  Published August 31, 2018. https://www.statnews.com/pharmalot/2018/08/31/cvs-troyen-brennan-cost/?utm_campaign=KHN%3A+First+Edition&utm_source=hs_email&utm_medium=email&utm_content=65598216&_hsenc=p2ANqtz–NTtY3W-R5v7dtq5HrdoC2MYdHLRWOqhPNO86IYFSXRfySqLaWKDVnJMl1VH58Z0vNC6vE_ZX8fL_28wEfKllglUjkjA&_hsmi=65598216.
  2. The Medicaid and CHIP Payment and Access Commission. Medicaid’s share of state budgets. https://www.macpac.gov/subtopic/medicaids-share-of-state-budgets/. Published 2017. Accessed September 10, 2018.
  3. Bach PB, Ohn J. Does the 6% in Medicare Part B drug reimbursement affect prescribing? Drug Pricing Lab. https://drugpricinglab.org/wp-content/uploads/2018/05/Part-B-Reimbursement-and-Prescribing.pdf. Published May 9, 2018. Accessed August 21, 2018.
  4. Global Oncology Trends 2018. IQVIA Institute. https://www.iqvia.com/-/media/iqvia/pdfs/institute-reports/global-oncology-trends-2018.pdf?_=1536696423000. Published May 24, 2018. Accessed September 11, 2018.
  5. Long G. The Biopharmaceutical Pipeline: Innovative Therapies in Clinical Development. Analysis Group, Inc. http://www.analysisgroup.com/uploadedfiles/content/insights/publishing/the_biopharmaceutical_pipeline_report_2017.pdf.  Published July 2017. Accessed September 12, 2018.
  6. National Cancer Institute. Person Years of Life Lost. https://progressreport.cancer.gov/end/life_lost. Updated February 2018. Accessed September 12, 2018.
  7. Howard DH, Bach PB, Berndt ER, Conti RM. Pricing in the Market for Anticancer Drugs. J Econ Perspect. 2015;29(1):139-162.
  8. Centers for Medicare and Medicaid Services. Medicare 2018 Part C & D Star Ratings Technical Notes. https://www.cms.gov/Medicare/Prescription-Drug-Coverage/PrescriptionDrugCovGenIn/Downloads/2018-Star-Ratings-Technical-Notes-2017_09_06.pdf. Published September 6, 2017. Accessed September 9, 2018.
  9. Centers for Medicare and Medicaid Services. Medicare Shared Savings Program Shared Savings and Losses and Assignment Methodology Specifications. https://www.cms.gov/Medicare/Medicare-Fee-for-Service-Payment/sharedsavingsprogram/Downloads/Shared-Savings-Losses-Assignment-Spec-V4.pdf. Published December 2015. Accessed September 9, 2018.
  10. Dusetzina SB, Winn AN, Able GA, et al. Cost Sharing and Adherence to Tyrosine Kinase Inhibitors for Patients With Chronic Myeloid Leukemia. J Clin Oncol. 2014;32(4):306-11. doi: 10.1200/JCO.2013.52.9123.
  11. Kaltenboeck A, Bach PB. Value-Based Pricing for Drugs: Themes and Variations.  JAMA.  2018;319(21):2165–2166.  doi:10.1001/jama.2018.4871
  12. Thomas K. A Drug Costs $272,000 a Year. Not So Fast, Says New York State. New York Times.  Published June 24, 2018. https://www.nytimes.com/2018/06/24/health/drug-prices-orkambi-new-york.html.
  13. Boekell DD. The Evolving Use of White Bagging in Oncology. OncLive. https://www.onclive.com/publications/oncology-business-news/2014/june-2013/the-evolving-use-of-white-bagging-in-oncology. Published July 9, 2014.
  14. Bach PB, Pearson SD. Payer and policy maker steps to support value-based pricing for drugs. JAMA. 2015;314(23):2503-2504. doi: 10.1001/jama.2015.16843.
  15. Ramsey L. Indication based pricing for Novartis. Business Insider. Published May 7, 2018. https://www.businessinsider.com/indication-based-pricing-for-novartis-car-t-cell-therapy-kymriah-2018-5.
  16. Terry M. Sanofi and Regeneron Slash Cost of New Cholesterol Drug Praluent. Biospace. Published March 12, 2018. https://www.biospace.com/article/sanofi-and-regeneron-slash-cost-of-new-cholesterol-drug-praluent/.

High-Cost U.S. Drugs: A Tale of Unhealthy Markets

David Wohlever Sánchez, Jackie Xu, and Qiang Zhang, Duke University

Abstract

What is the message?

Behind the high-cost drug industry lies a complex environment with many stakeholders with different incentives and strategies. In this article, we cover these major stakeholders, and their role, incentive, notable strategies, and relationship to drug prices to gain a comprehensive outlook of the healthcare market structure. We find that the healthcare system represents an unbalanced market with information asymmetry, a lack of competition, and exploitative practices. Existing solutions include different government policies and work from direct-action NGOs and advocacy NGOs. However, there remains a lack of integration between the private, public, and non-profit sectors, which can represent a next step in addressing this problem.

What is the evidence?

Our research is based on over 45+ academic sources and multiple interviews with stakeholders and industry experts, including a pharmaceutical executive, NGO founder, and Duke business and medical professors.

Submitted: December 1, 2018; accepted after review: July 21, 2018

Cite as: David Wohlever Sánchez, Jackie Xu, Qiang Zhang. 2018. High-Cost U.S. Drugs: A Tale of Unhealthy Markets. Health Management Policy and Innovation, Volume 3, Issue 2.

Introduction

While one might expect that high prices in an industry indicate a functioning market system, the US drug market is anything but ideal, characterized by a lack of competition, asymmetric information, and misaligned incentive structures.

From 2013 to 2015, net spending on prescription drugs increased approximately 20% in the United States, outpacing a forecast 11% increase in aggregate healthcare expenditures. In 2013, per capita spending on prescription drugs was $858, compared to an average of $400 for 19 advanced industrialized nations.

This problem has a tangible human cost. High costs are often passed to patients through higher copays, deductibles, and premiums for those on insurance and higher out-of-pocket expenses for those without coverage.1 Research suggests that as many as one in four patients cannot afford and do not fill their prescriptions, and the elderly and patients with chronic conditions are the most affected.

In many cases (including Medicare, Medicaid, and subsidized insurance plans), healthcare is a public venture, making price hikes a “tragedy of the commons.”2 This concentration of interests makes legislative change difficult; accordingly, we must search for solutions beyond only government policy.

Additionally, international trends demonstrate that high prices in the US put distorting pressures on global drug prices.3 Since U.S. drug markets and international drug markets are so intertwined, it is important that any changes in the U.S. market are carefully considered, given the potential implications to international markets. Accordingly, it is critical that we avoid blunt force or overly distortive economic policy. Holistic, market-driven, and competition-inducing reform is necessary to properly address this global challenge.

History

Starting in the 1990s, in a spur of scientific innovation, the pharmaceutical industry developed blockbuster drugs, extremely popular and profitable compounds. However, patents only last so long—at least, in theory.

As drug compounds became more complex, marginal pharmaceutical improvements became more difficult, meaning manufacturers had to find new sources of revenue. This meant increased costs of R&D for new drugs, as well as efforts by firms to protect their market exclusivities. The combination of direct-to-consumer advertising, loose patent law, and unparalleled lobbying put stress on the market, contributing to the high prices patients see today.

Core Realities: A Model to Contextualize High Prices

In order to contextualize the problem, we must understand four core realities.

First, drugs, especially life-saving drugs, are generally price inelastic; demand will change little despite price hikes.

Second, science and technology are complicated and expensive. Research and development costs make it difficult for firms to enter the market.

Third, the U.S. government is only partly responsive. At the macro level, government responds to popular demand for healthcare provisions (e.g. Medicare/Medicaid/subsidies) and drug safety regulations (i.e. FDA). At the micro level, however, politicians react to lobbyists who help reelect them.

Fourth, we are in a profit-driven market system. Accordingly, we should not expect firms to neglect profit maximization insofar as we wouldn’t expect firms in other industries to do so.

These core realities lead to a system where market realities inform actor strategies, and vice versa. This creates a feedback loop that results in high prices.

Core Realities in Practice: Factors that Drive Up Prices

These core realities create an unhealthy market characterized by the following:

Regulation: The FDA process creates a barrier to entry by increasing production costs and putting downward pressure on competition.4

Lack of transparency5: There is little transparency with R&D and production costs, since firms are not required to release this data. Thus, firms can easily “justify” high prices by claiming high costs.

Market uncertainty: Since this space is complex, suboptimal pricing schemes can emerge.

Types of High Priced Drugs:

In the prescription drug market, there are three main categories of high-cost drugs:

  1. Patented pharmaceuticals6: Once approved by the FDA, drugs can be sold at any price that a payer agrees to cover. These drugs stay high-priced, so long as no adequate substitutes exist. This state-granted monopoly administered via patent laws limits competition. However, these laws do spur innovation by creating incentives to develop new drugs.
  2. Specialty generics (“orphan drugs”)7: On-patent and off-patent specialty drugs that a small number of people need. However, since they are often life-saving, demand is inelastic.8 Even when patents expire, the lack of competition is caused by the high cost of entry and the low demand.9
  3. “Super generics10: New generics with more convenient methods of administration (e.g., nasal vs. injection) or combination of multiple pills into one.11 Slightly more effective, much more expensive. High cost of entry decreases competition.12

Stakeholder Analysis & Strategies

Stakeholders employ strategies to “maintain the loop” and their marketplace position, having direct and indirect impact on the problem landscape.


Stakeholder Role Incentive Strategy Relationship to price
Pharmaceutical  Manufacturers Manufacture drugs; R&D High prices; strict patent law Evergreening, lobbying, information asymmetry, strategic payouts “Price-makers” in problematic cases, “price-takers” in competitive cases
Hospitals / Physicians Receives drugs from manufacturers at discount; drug vendors that can pocket profit Generally profit-driven Utilize price mark-ups when selling drugs to patients Intermediary that drives up prices for the patient or payer
Pharmacy Benefit Managers Mediators between insurance companies and pharmaceuticals, negotiate prices and coverage options Profit-driven Receive discounts from manufacturers to promote their product over competitors’ Act as mediators and drive up transactions costs; negotiate discounts and rebates
Patient Advocacy Groups Advocates for and educates patients Profit-driven given relationship with manufacturers Provide educational materials that are not value-based Contribute to information asymmetry that drives up prices
Government at the micro level Public expectation to provide for high-quality, low-cost, and safe healthcare system Hold interest in lower drug costs as funder of Medicare/Medicaid Subsidize R&D; regulate drug manufacturers via FDA As regulators, drive prices up (FDA); subsidize costs of production via research grants
Health insurance providers Compete with other insurance providers to include many treatments in their plans but constrained by costs Generally want lower costs for themselves so their share of the payout is lower Negotiate group discounts Historically price-takers; now generally attempt to negotiate down prices
Universities Fuel basic science for pharmaceutical drug R&D, often funded by government Seek grant money to fund research and other activities Do not have the capacity to manufacture drugs, sell royalty rights to pharmaceutical companies13;

receive grants and donations from pharmaceuticals

Currently do little to influence pricing schemes


Notable Strategies

Pharmaceuticals/Manufacturers: 

  • “Evergreening”14: Involves tweaking a small aspect of a drug’s formula or delivery method to extend patent by 20 years.
  • Lobbying: In 2016, pharmaceuticals spent $244 million lobbying, the most of any US industry.15
  • Paying generic manufacturers to drop patent challenges16: 2005 Federal Trade Commission decision allows manufacturers to pay generic companies to drop patent challenges.
  • Lack of transparency on internal finances17: Cost of R&D is often a justification for exorbitant prices18. However, manufacturers spend nearly twice as much on marketing products as on R&D.


Hospitals: Charity hospitals (serving underprivileged neighborhoods) receive discounted drugs and sell them for profit. Through the 340b program, Medicare/Medicaid exclude these discounted rates when establishing payouts, which allows hospitals and manufacturers to profit heavily. An expanding number of hospitals now qualify for this status.

Patient Advocacy Groups (PAGs): PAGs receive donations and drug royalties from pharmaceutical companies. Accordingly, they provide “education” to patients about the drugs that are most effective/efficient, without any consideration of value-pricing.19

Universities: More than half of the 26 most transformative drugs of the last 25 years originated in publicly funded research.20 They also often receive grants and donations from manufacturers. However, they do not have the capacity to manufacture drugs, so they sell royalty rights to pharmaceutical companies.21 They play very little role in determining price schemes.

The Solution Landscape

At the core of the problem lies an unbalanced market, characterized by information asymmetry, lack of competition, and exploitative practices. Below are some existing solutions that have improved market systems in the U.S. and other countries.

Current Solutions Landscape

  R&D, Intellectual Property Direct pricing negotiation Increase competition Increase transparency
Government Bayh-Dohl Act (patenting by federal research grantees) Value-based pricing Hatch-Waxman Act (facilitate generic entry) Sunshine laws
Direct action NGOs Public-private partnerships Generic manufacturers Organize into networks to collect market information for drug manufacturer


Advocacy NGOs Advocacy with pharmaceuticals and PBMs: release price and production costs


Solutions for R&D/Intellectual Property Rights:

  • Bayh-Dohl Act of 198022:
    • Section 202 requires federal research grantees to confer a nonexclusive, royalty-free license on their patents to the government
    • Government has “march-in rights” to demand a patented drug be manufactured on its behalf23
  • Public-Private Partnerships:
    • Public (NGO, government) and private (companies) actors co-finance R&D for diseases affecting developing countries that would not otherwise be attractive markets24
    • Private companies receive PR benefits

Solutions for Direct Pricing Negotiation:

  • Value-based pricing25:
  • UK’s central advisory board calculates value of drug based on efficacy, safety, and total benefits to the healthcare system, setting prices accordingly

Solutions for Increasing Competition:

  • Hatch Waxman Act of 1984
    • Decreased the price of FDA generic drug applications26
    • Granted a period of market exclusivity to generic manufacturers who challenged patents before they expired27
    • Enabled, in part, the increase from 36% to 84% of generic product’s share of total prescriptions market in US28 (about 90% in 2018)
  • Promote generic manufacturing by nonprofits
    • Increased competition among drug manufacturers reduces prices
    • The Drew Quality Group
      • First approved 501(c)(3) to manufacture drugs, developing off-patent generic drugs and eventually legacy drugs29
      • Must publicly disclose all financial information

Solutions for Increasing Transparency:

  • Physician Payments Sunshine Act30
    • Requires drug and medical device manufacturers to disclose payments made to physicians31
  • Pharmaceutical companies market products by giving physicians free drug samples or gifts, skewing prescribing habits.32
  • NGO Networks
    • Create local networks of NGOs to gather market data on drug demand
    • Build reliable forecasting, convincing pharmaceutical companies to lower drug prices to reach a wider market.33
  • NGO Advocacy34
    • Universities Allied for Independent NGOs35 have mitigated information asymmetry between patients and pharmaceuticals.
    • Essential Medicines empowers students to petition their universities for better drug access policies.36

Lessons & Levers of Change

Media coverage of this issue has spotlighted manufacturers, but structural barriers within the healthcare system challenge reform.

At present, only the public and nonprofit sectors are direct actors in the solution landscape. Yet to build a more balanced market system, the private sector needs increased opportunities and stronger incentives to price products sustainably. This sector has the most leveraging power to change the pricing ecosystem.

Private Sector: Market governance

  1. Provide more robust opportunities for drug manufacturers to decrease R&D costs, encouraging price reductions
  2. Increase government grant funding and open knowledge collaboration with private manufacturing companies

Non-Profit: Informal governance

  1. Creation of NGO network: Pool local demands as negotiating power to reduce drug prices, or assume risk of drug manufacturers by holding excess stock; NGOs can leverage local knowledge; incentivize state governments to create NGO networks through common interest of providing medication for populations of need; advocacy NGOs can partner with NGO drug manufacturers, providing market information
  2. Venture-capital and government co-investment in NGO drug manufacturers to decrease capital barriers to entry.
  3. Incentivize and empower universities to leverage their position as the innovators of the science on which drug manufacturers rely; charitable social mission to educate individuals in service of society
  4. Publicize third-party, research findings on the value of drugs based on efficacy, safety, and overall societal benefits.

Public: Official governance

  1. Leverage Bayh-Dohl Section 202 provision: Inform NGOs of existing institutional pathway; allow government to pass license to NGO drug manufacturers, who can then compete with pharmaceuticals in patented market
  2. Include accessibility requirements on existing R&D cost-sharing agreements through public-private partnerships

Conclusion

The question of “fair” pricing remains open. While we do not want to ignore the contributions of profit-seeking firms, we cannot bear exorbitant prices forever. We believe a middle ground exists where manufacturers can pocket a profit and patients can afford their drugs.

Governments, manufacturers, and NGOs ought to remember the human costs of restricted access. Solutions will only be found when stakeholder incentives align with reasonable pricing. This can be achieved; whether or not we follow through remains to be seen.

Appendix – Bibliography

Endnotes

[1] Studies have found that people who see rises in their drug costs spend less on their families, other expenses, and sometimes even postpone retirement to keep their employer’s health insurance so they can afford the drug.

[2] This means that a few firms can internalize huge gains at the expense of the rest of society, the members of which each bear a tiny fraction of the true cost: a “death by a thousand papercuts.”

[3] For example, Canadian internet pharmacies, also dubbed mail-order pharmacies, enable Americans to purchase drugs from Canada, putting strong upward pressure on Canadian retail drug prices.

[4] There is a tradeoff here: the FDA keeps drugs safe, but also increases prices. This is not an all-or-nothing binary; we believe that there is a middle ground between drug safety and producer-side cost of regulation that would lead to optimal outcomes.

[5] This allows the pharmaceutical lobby to repeat the oft-given response that high prices are justified by cost of research. However, our research suggests cost of research and development is not as high as one might think.

[6] Example: Hepatitis C drug Sovaldi was originally planned to sell at $34,000. Gilead now sells Sovaldi at $84,000 for a 12 week treatment, or $1,000/pill.

[7] Example 1: Turing Pharmaceutical’s (former CEO Martin Shkreli) Daraprim jumped from $13.50 to $750/pill overnight. Daraprim treats a parasitic infection called toxoplasmosis that targets people with compromised immune systems, certain cancer patients. Toxoplasmosis infects an estimated 4,000 individuals in the US each year.

Example 2: Rodelis Therapeutic’s acquisition of cycloserine resulted in increase from $500 to $10,800 for 30 pills. Cycloserine treats multi-drug resistant tuberculosis (MDR-TB). In 2015, the US had 89 cases of MDR-TB.

[8] Inelastic meaning people will continue to buy regardless of price, since they need the drug.

[9] Firms that manufacture and sell these specialty drugs are able to set the price high enough so they are able to make a huge profit, but low enough such that new firms won’t be incentivized to enter the market, given cost of entry.

[10] Example: Amphastar Pharmaceutical is the only company to manufacture intranasal naloxone, which experienced a 100% price increase in 5 months.

[11] The existence of these effective generics improves patient health outcomes, but the difference between the more effective and less effective generics is likely not large enough to justify the huge price discrepancies.

[12] This leaves one or two firms at the top with the more effective, much more expensive generics.

[13] Example: Xtandi (prostate cancer blockbuster drug) will generate $33.3 million in royalties and other income for University of California.

[14] Example: Pfizer’s Caduet is a simple combination of Norvasc and Lipitor, which expired in 2007and 2011, respectively. Pfizer’s creation of Caduet when Norvasc and Lipitor were due to expire prevented other manufacturers from producing generic versions of these drugs.

[15] Example: Pharma lobbied Congress in 2003 to prevent Medicare from negotiating prices with pharmaceuticals for its new Part D program. Wholesale prices of brand-name drugs have increased average of 3.6 percent since the establishment of Medicare Part D.

[16] Example: In a patent challenge case against Cipro, a potential generic manufacturer received upfront and quarterly payments totaling $398 million and agreed to wait until patent expiration to market its product.

[17] In December 2016, 20 states filed complaints against pharmaceutical companies conspiring to artificially inflate prices generic drugs, coordinating through informal industry gatherings and personal calls/text messages.

[18] Example: Johnson & Johnson and Pfizer spent about 13 percent and 16 percent on R&D, respectively. At the same time, both companies spent about 30 percent of revenue on selling, marketing, and administrative expenses.

[19] 67% of patient advocacy groups receive funding from for-profit companies.

[20] Example: Sanofi’s collaboration with Harvard University is part of corporate strategy to fill pipeline with innovative drugs.

[21] Example: Xtandi (prostate cancer blockbuster drug) will generate $33.3 million in royalties and other income for University of California.

[22] Originally, this Act allowed federally-funded inventors and their employers to retain patent ownerships, incentivizing the commercialization of government funded R&D.

[23] However, note that all six petitions to the National Institutes of Health (NIH) to exercise march-in rights have been denied. The NIH claimed that drug pricing itself was not sufficient to provoke march-in rights.

[24] Examples include the International AIDS Vaccine Initiative, Global Alliance for TB Drugs Development (Stop TB), and Medicines for Malaria Venture (MMV). The Stop TB Partnership led to an agreement signed by Janssen Therapeutics to provide medication free for eligible MDR-TB patients—a promised donation of 30 mil over a 4 year period to low/middle income countries.

[25] In Australia, the Pharmaceutical Benefits Advisory Committee reviews the comparative effectiveness of various drugs. Similar patterns are also seen in Germany under the Federal Joint Committee, Canada under the Patented Medicines Prices Review Board, and the UK under the National Institute for Health and Clinical Excellence. In all these nations, the price of a drug is determined by the value it will bring.

[26] An Abbreviated New Drug Application (ANDA) process granted by the Act reduced the cost of completing an FDA application for approval of a generic drug.

[27] The first generic manufacturer(s) to file a Paragraph IV challenge against a brand-name patent is granted a 180-day period of exclusivity on the market before patent expiration. A Paragraph IV challenge is a claim to the FDA that the generic product does not infringe on the listed patent of a brand name drug, or that the brand-name patent is not valid.

[28] Other proposed reforms included the Greater Access to Affordable Pharmaceuticals Act in 2003, the Pharmaceutical Market Access Act of 2003, and the Pharmaceutical Market Access and Drug Safety Act of 2011. While these acts slightly differ in detailed nuances, their ultimate intent was to break down barriers of entry for generic drugs within the drug market.

[29] Legacy drugs are patented products that companies no longer desire in their product lineup. Drew Quality Group has two classifications of drugs. 1) Surplus drugs generate capital for future growth. 2) Service drugs may be sold at or below production cost to increase access of medications to vulnerable populations.

[30] Signed into the Affordable Care Act of 2010.

[31] All reports made to Centers for Medicare and Medicaid Services.

[32] Doctors may begin prescribing medications driven by personal motivations. In 2014, nearly 40% of the 50 largest pharmaceutical companies had academic medical center leaders on their Board of Directors, giving these individuals with significant weight on directions of medical research a financial responsibility to generate profits to shareholders.

[33] Example: AA&D is working with cities around world to quantify demand for TB drugs, creating NGO coalitions to streamline and pool this demand and use as negotiating power. These NGO coalitions can also assume risks from pharmaceutical companies by holding excess drug stock.

[34] Examples: NeedyMeds.org, a national non-profit, maintains a website of free information on programs that help people who can’t afford their medications or other health-care costs. It also offers a free drug discount card. The patient advocacy groups Campaign for Personal Prescription Importation, PharmacyChecker.com, Prescription Justice Action Group, RxRights.org, and the publisher of TodaysSeniorsNetwork.com, together representing more than four million Americans, advocated for the need of political action on high drug costs. Organizations such as Pharmacists United for Truth and Transparency, comprised of more than 1,000 pharmacists and pharmacy owners, aim to expose the intricate business model of PBMs designed to exploit the other players within the prescription drug market. Other examples include the National Community Pharmacists Association and PBMwatch.com.

[35] More advocacy NGOs: Sites like GoodRx offer information on retail costs of medications at local pharmacies. FamilyWize offers free prescription drug savings cards, allowing patients to negotiate discounts with pharmacies.

[36] This group was founded by successful Yale student advocates who reduced price and opened generic manufacturing of Bristol-Meyers Squibb’s antiretroviral d4t (discovered at Yale).

The Supply-Side Effects of Moral Hazard on Drug Prices

Kevin A. Schulman, MD, Clinical Excellence Research Center, Stanford University

Contact: Kevin A. Schulman, kevin.schulman@standford.edu

Abstract

What is the message?

This paper analyzes the impact of moral hazard on prices established by pharmaceutical manufacturers and the implications for policy makers. The findings show that the escalation of drug prices will likely continue unabated in the absence of significant mechanisms to induce restraint and discipline in this market.

What is the evidence?

Moral hazard is a powerful theory of how health insurance influences the delivery of healthcare. While moral hazard has been used to understand changes in demand for services through insurance, a literature review shows that until now, its impact on pharmaceutical prices has not been well developed. The findings documented in this paper should therefore help spark a vigorous debate on the implications of different pharmaceutical pricing models for the US market.

Submitted: December 18, 2017; accepted after review: July 21, 2018

Cite as: Kevin A. Schulman. 2018. The Supply-Side Effects of Moral Hazard on Drug Prices. Health Management Policy and Innovation, Volume 3, Issue 2.

Unit prices for pharmaceutical products are reaching ranges never before experienced.  Prices for cancer products are routinely over $100,000 per patient per annum, while novel CAR-T therapies are being offered for $475,000 per patient. These prices are a dramatic increase over the prices of the most expensive drugs only a decade ago.[1]

Prices are set by pharmaceutical manufacturers in negotiation with payers, and are set to reflect the fact that these products have a value based in intellectual property that is far greater than the marginal cost of production. Historically, the pharmaceutical industry has argued that prices are justified on the basis of research and development costs, the high risk of drug failure[2], and the value of new products.[3] Rarely are the prices ascribed to the actual price of manufacturing the products. At the same time, industry critics have highlighted the role of public funding in biomedical sciences as directly or indirectly supporting the development of many products, and the changing nature and risk of drug development characterized by much smaller and speedier clinical development programs and accelerated review times at FDA.[4]

While these arguments have existed for many years, the nature of biomedical research has changed.  The industry has moved development of products from broad, mass-market molecules to niche investments in cancer and orphan diseases.  The concern over high drug prices in these markets has been met with additional arguments for high prices based on limited market sizes in many of these product niches.[5]

In the current market environment, there is limited direct pressure on manufacturers setting these unprecedented prices. In contrast to many other countries, the US government does not directly negotiate over pharmaceutical prices except within the Veteran’s Administration (VA) system.  Even when direct negotiation is possible, the lack of competition within market segments limits the bargaining power of private payers. As a result, high and increasing prices directly impact health insurance premiums across the market, and the cost of the federal health plans, Medicare and Medicaid.[6] [7]

The Supply Effects of Moral Hazard

The extraordinary prices for pharmaceutical products can only be imagined in a world where patients have health insurance. Health economists have long been worried about the economic impact of health insurance on the patterns of consumption of healthcare due to a concept called “moral hazard.” Moral hazard describes the change in individual behavior between conditions of self-pay and conditions of third party payment. Kenneth Arrow was awarded the Nobel prize in economics for developing this framework[8]. Mark Pauly further developed the theory to focus on demand.[9]

The basic framework is easy to understand.  We all make purchases based on our concept of value.  We generally make purchases of goods or products for $1.00 when we perceive that they offer $1.00 worth of value. This concept of value is an individual determination – we all have our own tastes, preferences, and needs which form our assessment of value.

Third-party payment alters this fundamental calculus. Consider going out to dinner with a group of friends.  After the menu is passed around, you notice items of lower and higher price, salad, and steak. You can approach payment in one of two ways: individual checks or splitting the check.  If you all decide on individual checks before you order, you may decide to purchase the lower-cost salad since you are on a budget.  However, what happens if you decide to split the check after you order? You may be worried that everyone else at the table is likely to order the higher-priced steak, and you will have to pay your share of their higher-priced meals.  Since you are paying for their steak, why not order your own steak so at least you get the benefit of the higher price you will pay for dinner.  In this simple illustration, your behavior changes between self-payment and third-party payment models.

Health insurance is one form of third-party payment. Under health insurance, rather than paying the full cost of medical products, you pay only a co-payment (fixed amount), or co-insurance (a percentage payment) for medical products.  As illustrated in Exhibit 1, products 1-3 offer at least $1.00 of value for $1.00 of cost.  In a self-payment model, you would be expected to purchase only products 1-3 since only these products have a value of $1.00.  In an insurance model, however, you only pay the copayment of $0.20.  Now, products 1-6 offer value equal to or greater than the $0.20 copayment, so using the same rule (only buying products that offer value greater than or equal to the price you pay), you would purchase products 1-6.  Again, behavior changes under conditions of third-party payment.

Exhibit 1: Hypothetical Set of Products Based on Value, Cost and Insurance Status

Legend: Value-perception of value to the patient (in dollar equivalents). Cost (No insurance)-assumes only cash payments for the product. Cost (insurance)-assumes the product is covered by an insurance policy with a 20% coinsurance requirement.


While many economists have argued that health insurance increases the overall cost of healthcare due to these changes in demand,[10] there is also the concept of good moral hazard where people can purchase goods or products through insurance that would otherwise be unaffordable.[11]

To this point, the discussion of moral hazard has focused on the impact of moral hazard on the demand for healthcare products. However, the impact of moral hazard also extends to the supply side of health care.[12] [13] [14] While much of the literature examines the impact of moral hazard on the provision of services and technology, there is also an impact on the price of products. Given insurance, the suppliers of high-value products can realize that products are perceived as being significantly underpriced since insured patients only consider the out-of-pocket costs and not the full cost of therapy.  Applying a value framework to pricing can lead manufacturers to raise their prices to meet the value threshold rather than simply developing a price to meet their internal financial expectations. This supply-side moral hazard effect on the price of pharmaceutical products has been much less discussed in the literature.[15] [16]

Again, going back to the basic example of product 1 in Exhibit 1, this product provides great value to patients under conditions of self-payment and even more under conditions of third-party payment. Sophisticated suppliers will notice these conditions. In a competitive market, suppliers will have little ability to influence the welfare surplus enjoyed by patients in this example since the price is determined by the market and is driven by the entry and exit of firms. However, there are circumstances when suppliers have power to influence prices, especially in healthcare.

Suppliers can have market power when they have a barrier to market entry such as a patent awarded to a pharmaceutical manufacturer or a product developed for a niche category which is too small to attract competition.  In these cases, suppliers can increase the price of product 1 based on value.  If they decide to price at the total value of the product, they could raise the price from $1.00 to $1.50 to capture the full value to patients. Under our conceptual model, this pricing strategy would be attractive to patients even in a cash pay market.

However, under conditions of third-party payment, suppliers can consider an even more aggressive pricing strategy by considering that patients measure value against their co-insurance, not the full cost of the product.  Under these conditions, suppliers can raise the price to $7.50 while consumers would have a cost-share of $1.50, or an amount equal to the value they expect to receive from the therapy. As a result of supply-side moral hazard, the cost increased from $1.00 to $7.50 in this simple example.

The supply side implications of moral hazard are potentially significant. Beyond the short-term impacts on patients, this effect can have longer term effects by distorting the drug development portfolio. In Exhibit 2, we imagine a manufacturer with a simple two product portfolio, with each product having equal development costs and market price. In analyzing their options, the firm invests in the opportunity with the largest market size.[1] However, in Exhibit 3, under conditions of market power, they can consider the question of value of the therapy to patients in setting a price.  In this case, they chose to undertake development of product B despite its smaller market size.

Thus, the supply-side effects of moral hazard can be seen in both the prices of products in the marketplace, and in the portfolio of drug products available on the market.

Exhibit 2: Optimal Drug Portfolio without Moral Hazard

Product Cost of Development Size of Target Market Price Revenue
A $50,000,000 20,000 $10,000 $200 M
B $50,000,000 10,000 $10,000 $100 M

Legend: Cost of Development-out of pocket dollar costs of development (assumption).  Size of Target Market: number of accessible candidates for therapy considering incidence and prevalence of underlying condition.  Price-market price for the product (net price to manufacturer). Revenue-net revenue from the product (price times market size).


Exhibit 3: Optimal Drug Portfolio with Moral Hazard

Product Cost of Development Size of Target Market Value of Therapy Price Revenue
A $50,000,000 20,000 1 $10,000 $200 M
B $50,000,000 10,000 5 $50,000 $500 M


Legend: Cost of Development-out of pocket dollar costs of development (assumption).  Size of Target Market: number of accessible candidates for therapy considering incidence and prevalence of underlying condition.  Value-perception of value to the patient (in dollar equivalents). Price-value price for the product (net price to manufacturer). Revenue-net revenue from the product (price times market size).


Possible Solutions

Four frameworks can be considered as part of a regime to set appropriate market prices: market competition, cost-effectiveness analysis, prizes, and profit regulation.

1. Market Competition

As suggested earlier, in competitive markets with free entry of firms, the supply-side effect of moral hazard is not an issue. Firms that attempt to extract a high price from the market will be quickly met with competitors.  To a great degree, market competition has worked in the pharmaceutical market. When several firms with products enter a class, they often face price competition (although, this being healthcare, not all of this price competition is transparent and can occur in the form of a PBM rebate[17]).

A recent example is the cost of Hepatitis C treatment in the United States.  The payer community was in shock over the original price of Solvaldi at $84,000 per patient for a 12-week course of therapy (or double that amount for 24-weeks).[18] This set off a debate around the price of the therapy, and led to significant challenges for many public and private health insurers.[19] However, the entry of additional novel therapies for patients with Hepatitis C led to price competition in the marketplace, with prices ranging from $26,400 to $62,500 per treatment course by 2017.[20]

While this may be seen as a success of the market model, we do not have a good understanding of which product categories will remain competitive in an era of precision medicine. As indications for products become more targeted at a molecular level, it may be difficult for fast-followers to enter specific niche markets, leading to the failure of this mechanism to address the pricing impact of moral hazard.

2. a. Economic Analysis

Over the last several years, we have seen the re-emergence of products’ economic value as a consideration for supporting prices. This concept was developed in the 1970s and 1980s as a tool to help understand the value of investments in new pharmaceutical therapies.  Outside of the United States, regimes incorporating economic analysis have helped to set national formulary decisions in the UK, Germany, and Australia. These regimes can consider the patient population impacted by the condition, the potential outcomes of the therapy, and the net cost of the intervention (the net cost considers the cost of the new therapy, the cost of administration such as hospitalization for supportive care or side effects, less costs avoided as a result of the treatment). Through this analysis, products can be found to be cost saving (those rare products that reduce overall costs), or cost effective, requiring additional spending but providing additional value to patients.

Providing coverage for cost-effectiveness therapies is predicated on an interest in an investment in new therapies by everyone in the insurance pool or by taxpayers if addressing a publicly funded program. Generally, there is no direct process for such a determination, so this process is left to proxies such as a pharmacy and a therapeutic committee or some other type of formulary review committee.

Economic evaluation can be used to assess the value of therapies once a price is determined, or it can be used to set the price in advance to ensure “access” or uptake into the marketplace. The use of economic analysis before a product is marketed can help understand the potential value of the therapy in practice.[21] If economic evaluation is conducted once a product is on the market, findings that therapies are not cost-saving or that they do not meet a value threshold could reduce spending by limiting access to low-value therapies. At present, there is no consistent application of a value threshold in the United States.

2.b. Considerations for the Specialty Pharmaceutical Marketplace

Applications of the economic analysis framework to high-cost therapies could be problematic.

Economic evaluation can be used by manufacturers to help set a price for a product. Using this framework, high prices can be justified by expected benefits using outcome measures such as years of life gained for therapies that have a survival advantage, or quality-adjusted life years considering an impact on both length and quality of life.

One means of enhancing the “value” of a therapy is to limit the indication to those that would perform best under this framework to support a high price.  Therapies that have a large impact on pediatric cancer, for example, would offer the potential for large denominators in a cost-effectiveness framework since patients who benefit from therapy would have substantial remaining life expectancy. Thus, bringing a technology to market first for a pediatric indication would allow a price that would be considered poor value in other indications.

Application-specific pricing is a remedy to address this strategy where prices would be adjusted based on clinical indication. However, there is no evidence that these schemes have been successfully adopted and enforced.  If enforcement of this method fails, then the “benchmark” price for a technology could be established by the best-case scenario rather than the expected use in the market.

Market “guarantees” could be another mechanism to enhance the effectiveness of therapies.  Again, the issue would be the ability and cost to track “effectiveness” over time to enforce these contracts.  Not only is there potential for significant disputes over patients who have adverse outcomes for a variety of reasons unrelated to the treatment (car accidents for example),  significant administrative costs would be associated with the resulting “manual” billing process.  Further, if a manufacturer offers this framework in advance of going to market, they could include their estimate of likely clinical effectiveness in setting their price (i.e., they raise the price above their initial consideration to account for the cost of the guarantee).

If patient perspective is considered in assessing value, there is significant concern that conditions involving highly emotional situations (such as a life-threatening illness or genetic diseases) or loss (a new diagnosis of cancer) lead to very high value on any potential benefits of therapy, and patients may appear to be risk-seeking in making treatment choices. [6], [21] This value framework of patients is expected to differ significantly from the value framework of people in the insurance pool not impacted by life-threatening illness.[22]

Cost-effectiveness of therapies is not tied to the overall cost in the market since total budget is tied to the price and the number of patients treated, not the value of a therapy.[21] Cost-effectiveness analysis can be used to prioritize new investments in pharmaceutical therapy, but will lead by definition to increases in spending.[23]

3. Prizes for Drug Discovery

Nobel Prize-winning economist Joseph Stiglitz developed the concept of a prize for drug discovery that would compensate inventors for their efforts while providing the public access to novel therapies closer to their marginal cost.[23] However, the mechanics of such an approach are challenging.

First, new drugs enter to market as a combination of both drug discovery and drug development.  Discovery is the early-stage basic science work in a laboratory, while development requires teams of people to develop a formulation for use in humans, optimize drug manufacturing, test for toxicity, and undertake clinical testing.  Discovery often occurs through public funding, while development requires private funding.  A prize awarded for discovery would be very difficult to administer; many new targets and biologic mechanisms are discovered, only to later fall out of the drug development pipeline.

Similarly, a prize for drug discovery could create significant challenges in funding drug development, with no private incentive to invest in clinical research since post-prize research would be a public good. A prize awarded after drug development runs the risk of skewing development to tasks required to access the prize rather than to optimize the development program for market impact.

Finally, given the tremendous output of basic science in the United States, there may be a subjective component to the process of awarding prizes which could create significant uncertainty in the marketplace and reduce incentives for drug development.

4. Profit Regulation

In some European markets, price negotiation used to include profit regulation. Government purchasers developed a framework considering that the patent holder was a monopolist that needed to be regulated (like a utility). Profit regulation schemes considered the costs of drug development and manufacturing in setting price and market access, with additional consideration for manufacturers’ production capacity within a market. The manufacturer would be allowed a price that offered a return on these demonstrated costs. For example, in the UK, profits were limited to 21% until 1998, rising to 29%.[24]

Profit regulation allows for a separation of the research costs (supported by the public) and drug development costs incurred by the private sector.  In addition to direct costs in clinical development, profit regulation schemes can consider the time cost of an investment. This mechanism was largely applied to the consideration of self-originated portfolios.  It is not clear how these schemes would evaluate in-licensed products and whether there would be any consideration of the costs of acquiring molecules in calculating the allowable profit for firms. A decision to exclude acquisition costs from pricing considerations could have a significant negative impact on firms paying high prices to acquire novel therapies, but could potentially lead to a reduction in market prices for new products.[25] [26]

Under a profit framework, manufacturers would have incentives to develop products for a wide variety of indications.  This could broaden the portfolio beyond the narrow niche of oncology and orphan products currently in development.  While manufacturers might have an incentive to increase development costs under this framework to enable a higher nominal profit level,[27] in practice, the high cost of venture capital may limit the impact of this perverse incentive.

Given the fixed cost of drug development, this concept of profit regulation entails a scale problem. The market may have to facilitate purchase of a sufficient quantity of a novel therapy before this profit cap would apply.

One approach to profit regulation could be to provide a pathway to using less private capital in drug development.  Leveraging private capital with public grant funding could allow private investors to achieve their expected returns while providing a pathway for lower drug prices post-approval.[28] The NIH’s recent announcement of a novel co-development program with industry would be a perfect opportunity to test such a program.[29]

Final Considerations

There is significant anecdotal evidence of an impact of supply-side moral hazard on specialty drug prices. In the face of this effect, public constraints on drug pricing may be required:  “To avoid breaking the government’s budget, this would require some type of restraint on manufacturer prices, such as price-regulation or direct price controls.”[14]

Currently, there is no mechanism in the US market to address this issue in product categories with single solutions such as many specialty pharmaceutical categories.  This paper developed the theory of why this is an issue, and examined how four currently available strategies can be used to assess the appropriate price for products for the US market.  Each framework, the market, value, prize, and profit frameworks, have significant strengths and significant limitations. Each approach provides different incentives to shape the portfolio of products in development, and may result in different pricing frameworks for products that either the market (see Exhibit 4). Consideration of each of these schemes should include considerations of access, innovation and affordability of new drug products [21] At some level, all of these mechanisms are designed to ensure some conflict in setting prices within this market.

The escalation of drug prices will likely continue unabated in the absence of significant mechanisms to induce restraint and discipline into this market.  Thus suggests the need for a vigorous debate on the implications of these different pricing models in the US market, a need recently highlighted by the National Academy of Medicine.[31]

Exhibit 4: Policy Solutions to the Effects of Moral Hazard on Price

Scheme Unit Price Utilization Total cost
Market Competition High until competitors enter the market May result in barriers to market access Potential to increase the total cost
Economic Analysis May increase prices for high value therapies May enable market access Potential to increase the total cost
Prize Low marginal cost per patient Enables increased use with little cost barrier Total cost depends on how the prize scheme is established
Profit Regulation Price cap based on investment May enable market access Total cost depends on regulation scheme


References

  1. Reed SD, Antrom KJ, Ludmer JA, et al. Cost-effectiveness of imatinib versus interferon‑a plus low-dose cytarabine for patients with newly diagnosed chronic-phase chronic myeloid leukemia. Cancer. 2004;101:2574-2583.
  2. DiMasi JA, Grabowski HG, Hansen RW. Innovation in the pharmaceutical industry: New estimates of R&D costs. Journal of Health Economics. 2016;47:20-33.
  3. Paris V, Belloni A. Value in Pharmaceutical Pricing. OECD Health Working Papers. 2013(63), OECD Publishing, Paris.
  4. Bach PB.  New Math on Drug Cost-Effectiveness. New England Journal of Medicine. 2015;373(19):1797-1799.
  5. Trusheim MRBerndt ERDouglas FL. Stratified medicine: strategic and economic implications of combining drugs and clinical biomarkers. Nature Reviews Drug Discovery. 2007;6(4):287-293.
  6. Hirsch BR, Balu S, Schulman KA. The impact of specialty pharmaceuticals as drivers of health care costs. Health Affairs (Millwood). 2014;33(10):1714-1720.
  7. Warraich HJ, Schulman KA. Health Care Tax Inversions — Robbing Both Peter and Paul.  New England Journal of Medicine. 2016;374(11):1005-1007.
  8. Arrow KJ. Uncertainty and the Welfare Economics of Medical Care.  The American Economic Review. 1963;53(5):141-149.
  9. Pauly MV. The Economics of Moral Hazard: Comment. The American Economic Review. 1968;58(3):531-537.
  10. Newhouse JP. A summary of the RAND Health Insurance Study. Annals of the New York Academy of Science. 1982;387:111-114.
  11. Nyman JA. Is ‘moral hazard’ inefficient? The policy implications of a new theory. Health Aff (Millwood). 2004;23(5):194-199.
  12. Rice TH. The Impact of Changing Medicare Reimbursement Rates on Physician-Induced Demand. Medical Care. 1983;21(8):803-815.
  13. Debpuur C, Dalaba MA, Chatio S, et al. An exploration of moral hazard behaviors under the national health insurance scheme in Northern Ghana: a qualitative study. BMC Health Services Research. 2015;15:469.
  14. Amy Finkelstein. With Kenneth J. Arrow, Jonathan Gruber, Joseph P. Newhouse, and Joseph E. Stiglitz. Moral Hazard in Health Insurance. New York: Columbia University Press. December 2014
  15. Lakdawalla D, Sood N. Innovation and The Welfare Effects of Public Drug Insurance. Journal of Public Economics. 2009;93(3-4):541-548.
  16. Havighurst CC, Richman BD. Distributive Injustice(s) in American Health Care. Law and Contemporary Problems. 2006;69(4):7-82.
  17. Dabora MC, Turaga N, Schulman KA. Financing and Distribution of Pharmaceuticals in the United States. JAMA. 2017 May 15. doi: 10.1001/jama.2017.5607.
  18. Hepatitis C Online. Sofosbuvir. https://www.hepatitisc.uw.edu/page/treatment/drugs/sofosbuvir-drug.
  19. Liao JM, Fischer MA. Early Patterns of Sofosbuvir Utilization by State Medicaid Programs. New England Journal of Medicine. 2015;373(13):1279-1281. doi: 10.1056/NEJMc1506108.
  20. Sagonowsky E. Fierce Pharma. AbbVie’s new pan-genotypic hepatitis C drug Mavyret deeply underprices the competition http://www.fiercepharma.com/pharma/abbvie-s-new-pan-genotypic-hep-c-drug-mavyret-undercuts-competition. Published Aug. 3, 2017.
  21. Schulman KA, Glick HA, Rubin H, et al. Cost-effectiveness of HA-1A monoclonal antibody for gram-negative sepsis: economic assessment of a new therapeutic agent. The Journal of the American Medical Association. 1991;266:3466-3471.
  22. Mark DB, Schulman KA.  PCSK9 Inhibitors and the Choice Between Innovation, Efficiency, and Affordability.  The Journal of the American Medical Association. 2017;318(8):711-712.
  23. Rasiel EB, Weinfurt KP, Schulman KA. Can prospect theory explain risk-seeking behavior by terminally ill patients? Medical Decision Making. 2005;25:609-613.
  24. Birkett DJ, Mitchell AS, McManus P.  A Cost-Effectiveness Approach to Drug Subsidy and Pricing in Australia Economic Analyses of Drugs Have Led to Greater Efficiency and Access, but Costs Continue to Rise at Unsustainable Rates. Health Affairs (Millwood). 2001;20(3):104-114.
  25. Stiglitz, JE. Prizes, Not Patents. Project Syndicate. https://www.project-syndicate.org/commentary/prizes–not-patents?barrier=accessreg. Published March 6, 2007. Accessed November 1, 2017.
  26. Sood N, De Vries H, Gutierrez I, et al. The effect of regulation on pharmaceutical revenues: experience in nineteen countries. Health Affairs (Millwood). 2009;28(1).
  27. Schulman KA, Little L, Mullangi S, et al. AbbVie. Harvard Business School Case 316-095. 2016.
  28. Gilead. Gilead Sciences to Acquire Kite Pharma for $11.9 Billion. http://www.gilead.com/news/press-releases/2017/8/gilead-sciences-to-acquire-kite-pharma-for-119-billion Published August 28, 2017. Accessed November 1, 2017.
  29. Bradley JVandoros S. Creative compliance in pharmaceutical markets: the case of profit controls. Expert Review of Pharmacoeconomics Outcomes Research. 2012;12(1):31-38.
  30. Valverde AM, Reed SD, Schulman KA. Proposed ‘grant-and-access’ program with price caps could stimulate development of drugs for very rare diseases. Health Affairs (Millwood). 2012;31(11):2528-35.
  31. Steenhuysen, J. U.S. NIH. 11 drugmakers partner to accelerate cancer therapy research. Reuters. https://www.reuters.com/article/us-usa-healthcare-cancer/u-s-nih-11-drugmakers-partner-to-accelerate-cancer-therapy-research-idUSKBN1CH22E. Published October 12, 2017. Accessed November 1, 2017.
  32. Augustine NR, Madhavan G, Nass SJ. Making Medicines Affordable: A National Imperative. The National Academies of Sciences, Engineering, and Medicine. November, 2017.


Word from the Editors

On behalf of the editorial team – Regina Herzlinger, Kevin Schulman, Lawrence Van Horn, and myself – I am delighted to welcome you to Volume 3 of HMPI featuring a strong set of new articles central to our core goal: drawing from the research and experience of scholars and practicing leaders to advance healthcare and health systems. The authors offer innovative, highly relevant approaches to improving health sector management practices worldwide.

In this issue of HMPI, the authors:

  • Explore how immunity from legal liability affects healthcare quality;
  • Study the adoption of telehealth practices;
  • Discuss opportunities for global health organizations to act as value chain integrators in bringing partners together to deliver outstanding services;
  • Highlight opportunities to improve management education for healthcare leaders;
  • Identify trends in the roles of chief innovation officers in U.S. hospitals;
  • Examine how countries can learn from each other in providing services for aging populations, and
  • Provide insights about how to translate core ideas from consumer behavior theory into healthcare marketing.

Together, the work is highly relevant for leaders of public and private health organizations in the U.S. and globally.

Healthcare is now one of the largest – if not the largest – employer in economies around the world. The Bureau of Labor Statistics in the U.S. reports more than 19 million jobs in healthcare and social assistance in 2016 (12.2% of the work force), projecting growth to more than 23 million jobs (13.8% of the work force) in 2026. In Canada, similarly, Statistics Canada reports that healthcare and social assistance jobs accounted for 12.8% of the workforce in 2017, second only to wholesale and retail trade (15.3%). Healthcare also makes major contributions to economic output – more than $2 trillion in the U.S. in 2016 (7.1% of the economy). Healthcare is central to the economy, to innovative development, and to human well-being.

Yet, in country after country, those healthcare jobs and productive output are often managed poorly. The core problem is not that healthcare leaders do not care or work hard. Instead, many of the issues arise from challenges concerning management skills. Some of those challenges involve the need for stronger skills of individual health sector leaders. Many challenges, though, arise because of weak integration and misaligned incentives across the many fragmented silos of healthcare systems. Quite simply, the health sector is too large and too important to allow the problems that arise from poor management – whether from weak individual skills or from misalignment along the healthcare value chain – to continue.

The authors of the articles that we publish are committed to improving management practices in health systems around the world. We welcome your comments about the ideas that the articles spark and your ideas for subsequent articles. Please send us your comments to info@hmpi.org. We also welcome discussion on the BAHM Forum on LinkedIn [https://www.linkedin.com/groups/7042389] and on Twitter, https://twitter.com/HMPI_Journal.

If you have an idea that you would like to explore for HMPI, please send an outline of your article to our editorial team at info@hmpi.org.

Will Mitchell
Professor of Strategic Management
Anthony S. Fell Chair in New Technologies and Commercialization
Rotman School of Management, University of Toronto

Regi’s ‘Innovating in Health Care’ Cases – Hub and Spoke: Health Care Global

This issue of Regi’s Case Corner highlights the opportunities for a “focused factory” model in health care. The case, which includes a teaching note, and a background reading are available from the HBS case distribution site.

HBS case: Hub and Spoke, Health Care Global and Additional Focused Factory Models for Cancer Care, 9-313-030

Authors: Regina E. Herzlinger, Amit Ghorawat, Meera Krishnan, Naiyya Saggi

Synopsis: Dr. Ajai Kumar, the founder of Health Care Global (HCG), a chain of innovative Indian cancer treatment centers, is contemplating whether to expand his model in India or to enter some African countries. Along the way, he assesses the lessons he can learn from the business models of other cancer treatment centers described in the case, such as the research-focused Dana Farber or the consumer – focused Cancer Treatment Centers of America (CTCA).

Abstract

Regi notes that she teaches this case with an “Innovating in Health Care” framework that enables students to evaluate the following questions.

  • How well aligned is the innovation with six critical aspects of the health care ecosystem: financing; structure; public policy; technology; accountability; and consumers? I call them the “Six Factors”. If the innovation is not well aligned with the Six Factors, we discuss what, if anything, could be done to improve the alignment.
  • Will the business model work? The business models of some innovations contain unrealistic ideas about important elements such as the strategy, financing, and management team composition. The students evaluate the business model and recommend specific changes.

Materials

  • Reading: Innovating in Health Care – Framework
  • Case: Hub and Spoke, Health Care Global and Additional    Focused Factory Models for Cancer Care, 9-313-030
  • edX MOOC: Innovating in Health care
  • Note about access to materials: Harvard Business School holds the copyrights to most materials in this section; the links connect to the HBS case site where they may be purchased. Academic readers typically can register with the HBS site for access to complementary educator review copies of the materials.

Reading: Innovating in Health Care – Framework

  • HBS case: 9-314-017 (July 8, 2015)
  • Author: Regina E. Herzlinger
  • Synopsis: This note contains three frameworks that will help you create effective health care innovations: Three different types of health care innovations; “Six Factors” alignment: Is the idea viable?; Business model elements: How to make it happen.
  • HBS link: https://cb.hbsp.harvard.edu/cbmp/product/314017-PDF-ENG

edX MOOC: Innovating in Health Care (HarvardX MOOC)

  • Instructors: Regina E. Herzlinger (Harvard University), Margo I. Seltzer (Harvard University), Kevin Schulman (Duke University)
  • Synopsis: Improve critical thinking about health care entrepreneurship by reading, discussing, and analyzing case studies and writing a business plan.
  • Link to archived coursehttps://www.edx.org/course/innovating-health-care-harvardx-bus5-1
  • Next session: The MOOC will be offered again in 2018

Regi would love to hear from readers who have teaching materials (e.g., cases; syllabi; experiences with mentoring, entrepreneurship in residence; blended courses) in innovating in health care. She welcomes all other feedback, too.


Private Physicians with Sovereign Immunity at a Public Hospital: The Impact on Adverse Events


David A. Lubarsky; Steven G. Ullmann; John Tawwater; Myka B Whitman; Melissa Black; Kaming Lo; Shari Messinger Cayetano; Lisa F Rosen; David J Birnbach

Contact: David A. Lubarsky, dlubarsky@med.miami.edu

Disclosures: No funding was received in relation to this study. None of the authors declare any conflicts of interest.


Abstract

What is the message?

The study found that when a large physician group at a public hospital received sovereign immunity (SI) from malpractice litigation, the incidence of serious harm decreased over time and the implementation of SI did not impact the safety of care delivered.

What is the evidence?

To explore the impact of tort reform on adverse events, the incidence of serious patient harm was evaluated over a six-year period where care was provided by a single, large physician group. At Jackson Memorial Hospital, a public hospital, physicians were protected from large medical malpractice claims by sovereign immunity for the last four years of the six-year study.

Submitted: November 16, 2017. Accepted after review: December 20, 2017

Cite as: David A. Lubarsky, Steven G. Ullmann, John Tawwater, Myka B Whitman, Melissa Black, Kaming Lo, Shari Messinger Cayetano, Lisa F Rosen, David J Birnbach. The impact on the rate of adverse events after granting private physicians sovereign immunity at a public hospital. Health Management Policy and Innovation, Volume 3, Issue 1.

Introduction

With the ongoing concern about quality and safety1, healthcare providers are focused on reducing adverse events and creating the best systems to improve outcomes2. Significant initiatives to impact practice include data sharing3, education and debriefings4, safety management systems5, electronic medical records6,7, checklists and time-outs8-10, leadership and accountability11, and error reporting2. However, the plaintiff’s bar continues to believe that there is a role that the tort system plays in monitoring physician’s behavior and providing a check on healthcare systems that might otherwise lack sufficient oversight for optimal safety12.

Trial attorneys have been forceful in publicizing medical errors as a legitimate way to alert the public to deficiencies in proper care, and they claim that litigation motivates providers to practice more safely13 and maintain a high quality of care14,15. Published reports agree that improvements in patient safety lead to better practices and reduced malpractice claims16. On the other hand, there is conflicting evidence whether defensive medicine or malpractice suits improve quality of care17-19. For example, there are inconsistent findings as to the impact of malpractice suits may on the rate of Caesarean-sections in obstetric practices13,20.                   

 The threat of lawsuits has a major impact, and is driving current governmental efforts at tort reform. In many areas of the United States, rising medical malpractice premiums have become unmanageable; furthermore, the economic and social costs of malpractice claims may drive physicians away from specialties and environments that are considered high risk21-23. Additionally, the fear of lawsuits may lead to the practice of defensive medicine—the unnecessary ordering of tests and services to reduce a physician’s liability costing nearly $50 billion annually24-28.

Background

In 1952, an agreement designated Jackson Memorial Hospital (JMH) as the teaching hospital for the University of Miami Miller School of Medicine. This arrangement stipulated that Miami-Dade County would operate JMH for both the indigent and for patients who could pay. The University of Miami, through the School of Medicine, provided the faculty to care for the patients and train residents. (Figure 1) What this meant, in fact, is that while JMH was protected by sovereign immunity (SI) as a government entity, the individual physicians who worked for the University of Miami could be held liable for medical errors. As a result, this exposed the University physicians as the only “deep pockets” during the care of South Florida’s most difficult and complex cases.  Recognizing the importance of public teaching hospitals, resident education and resident retention throughout the State of Florida, and the disproportionate share of liability imposed on private medical school in Florida that provide patient care at public teaching hospitals, in 2011, the State of Florida extended the protections of sovereign immunity to any private medical school in Florida (including its physicians and employees) that had a contractual agreement with a public teaching hospital to provide patient care serves at such hospitals. As a result of this amendment, the University of Miami and JMH amended their long-standing contractual relationship so that the 900 clinically active employed physicians at the University of Miami could be deemed agents of JMH and received the protections of sovereign immunity when they were providing medical care at a JMH facility. The same 900 clinically active employed physicians were on staff at the University’s privately-owned, 560 bed, University of Miami Hospital (UMH) and continued to practice there without SI.

Study Aims

This unique setting allowed us to evaluate the temporal trends on safety events without tort reform and to isolate the impact of tort reform on the same physicians practicing at JMH who had received SI. There has never been a recorded instance of disparate tort application in such close proximity at two hospitals, let alone for the same physician group; usually comparisons only exist over time and/or across different state borders.  Nor has any research previously been conducted to evaluate safety events related to SI over such a prolonged time period using objective auditable safety data from a large single physician group. In planning the study, we wanted verify that if the rate of serious events did not increase, it was not an anomaly. To achieve this, we used UMH as a control hospital to assess the natural rate of change in safety events over time for the same physicians.  Given this opportunity to assess the impact of the threat of malpractice on patient safety events, we hypothesized there would be no impact from the granting of tort reform protections and that the incidence of harmful events would not increase at JMH.

Methods

Quantros, a provider of software that collects and quantifies safety data, provided report summaries with graded harm were available from 2010 to 2015 at JMH and also at the comparator hospital UMH. Only two years pre-SI were collected using this software, thus limiting the data set for the pre-SI years. Serious harm was defined as category G =Event may have contributed or resulted in permanent harm; H=Event that required intervention to sustain life; and I=Death related to event or cause unknown. Annual safety outcomes were defined as the log of the incidence of serious harm reports/patient bed days, adjusting for volume of care.  SAS version 9.4 was used to analyze the data.

Total unique number of claims, total dollar value of claims, and average dollar value of claims involving UM attending physicians at JMH were evaluated for 2010-2011 versus the 2012-2013 time periods.  The analysis extended only to 12/31/2013 to account for the expiration of the two-year statute of limitations which would assure an examination of a virtually complete set of malpractice claims that could be filed. Any open claims from those time periods that had not been settled were valued at the reserves set by the legal team (at the likely settlement value).

Statistical analysis: The appendix to the paper describes the statistical analysis that we undertook with the data.

Results

At JMH, where University of Miami physicians received SI, the incidence of harmful events declined significantly after SI comparing the pre vs post period. The post-SI average incidence rate of harmful event among the four post-SI years was 13% lower (estimate=-0.1368, RR=0.8721, p=0.0109) compared to the two pre-SI years (Table 1). The trajectory of changes in the incidence of harmful events over time was not significantly different at UMH versus JMH (with SI) (Figure 2B).  The case mix index (CMI), a measure of severity of patient presentation, increased slightly over time at both hospitals (Table 2).  Over the period of the study, the university faculty practice employed approximately 900 physician clinicians reporting work relative value units. Approximately two-thirds delivered care at both hospitals during those years.  For example, in the last year of the study, the exact numbers employed were 919 physicians and 66.7% delivered care at both hospitals.

There was a marked decline in the total ($16.5M vs $0.7M) and average ($3.3M vs $0.233M) dollar value of claims at JMH following SI for the university faculty practice.   Despite an intention to perform a statistical analysis, there were an insufficient numbers of claims to provide a valid statistical analysis.

Discussion

The implementation of SI at JMH did not impact the safety of care delivered.  In order to rule out that the safety of care was not compromised and might have been unrelated to SI, a comparison to UMH showed similar findings. Our study provides the first opportunity to assess whether the threat of significant malpractice exposure drives the safety of care delivered by physicians.

There is only one previous direct study of disparate tort protections on total quality of care25. A single hospital corporation with hospitals in Texas (TX) and Louisiana (LA) assessed CMS quality of care indicators over a common time period after caps on pain and suffering were introduced in TX but not in LA. That evaluation occurred at widely separated sites and with totally disparate medical staffs, unlike our study.  Regardless, their findings were similar to ours. From 2000-2006, there was no impact of tort reform on quality of care between those who had caps on pain and suffering in Texas and hospitals owned in Louisiana by the same parent company where caps were not in place.  The only difference was in the dramatic decline in malpractice cases brought in Texas based on non-economic damages.

Similarly, in our study, there was a similar marked decline in the dollar value of lawsuits brought against University of Miami physicians practicing at JMH following the granting of SI.  In a second study, also consistent with our findings, a single academic surgical department reported a significant decline in the cost of malpractice following tort reforms, but no other physician group studies exist21.

There are several studies that have examined the impact of tort reform (most often non-economic caps) across statewide or national claims databases on the care of patients with coronary artery disease or labor and delivery.  Several of those studies found a decline in procedural treatment intensity associated with tort reform26,29; others have shown that there is a larger impact on diagnostic intensity27. A reduction in either diagnostic or procedural activity would be expected to yield fewer possible safety errors and is consistent with our findings of reduced reports of safety events.

Since tort reform almost uniformly involves caps on pain and suffering, and in all previous cases have been implemented at the same time across an entire state, studies in the medical and legal literature have only been able to evaluate sequential performance over time without adequate control.25 These before/after studies of a tort reform intervention may not be able to fully control for changing care paradigms, nor can they control how documentation initiatives change reporting of quality over time for the physicians or facilities affected.

Our ability to control for the severity of patients treated via the trajectory of safety events occurring over time, and reporting paradigms for safety events for the same physician group by assessing these variables 250 yards away in a different tort environment, are unique and unlikely to be repeated.   We were thus able to rule out impacts of the expected increased focus over time on patient safety (which was parallel in both institutions), which might otherwise confuse definitive evaluation of safety performance. We were therefore able to determine that performance of the physicians after being granted SI was better in terms of serious patient safety events and comparable to the performance over time when compared to a private hospital environment in which such protections did not exist.

This study had controls to conclude that physician behaviors related to patient safety were not impacted by the either SI or the threat of a lawsuit.  The patient population did not have a reduced acuity of care that could account for the reduced safety events. At JMH, and at the comparator UMH, CMI increased, and thus one would expect more, not the same or fewer safety events based on patient severity of illness.  It was controlled for volume (rate adjusted by patient bed days), temporal trending (no difference with control hospital related to a reduction in serious patient harm reporting), and geography (the two hospitals were across the street from one another).  It was also controlled for physicians, since the vast majority of care in both hospitals was provided by the same group of approximately 900 physicians, assisted by 1,000 rotating residents and fellows under their supervision. In addition, leadership of all academic departments spanned both hospitals, and the patient safety administrators at both hospitals remained consistent throughout the study period.

It is important to note that we did not seek to compare the rate of safety events at UMH with JMH.  The two facilities, while doing a similar number of elective surgical procedures, have a different number of licensed beds, disparate socio-economic patient populations, and unique service lines (e.g. a Level 1 trauma center, organ transplant program, obstetrics and neonatal ICU only at JMH, and technologically advanced non-invasive minimally invasive cardiology at UMH).  We only compared each hospital’s own specific trajectory of serious safety events to address the potential that JMH safety event performance could have been improved over time had SI not been granted.  Since the trajectories between safety events at the two hospitals were similar (both declined a similar amount over time), we can dismiss that as a limitation of the study.

Nonetheless, there are six limitations. First, a small subset of physicians only deliver care at either UMH or JMH and thus would not be affected by the initiation of SI. Since this group comprised only approximately 1/3rd of the total number of faculty, it is unlikely this impacted the overall results.  Their practice patterns remained constant and were not isolated, as all of them served in academic departments overseeing practice at both institutions.  Second, the impact of SI on physicians who spend more time at either hospital could not be individually evaluated; there might be a subset of physicians where SI did drive practice decisions despite the larger group demonstrating no effect.  Third, rotating interns and residents change monthly, and each year a new class begins. Because the attending physician is ultimately responsible for the residents, we believe that the impact of varying identity of residents on different services would have a negligible effect over such a prolonged time period. In addition, both hospitals had new faculty hired after the initiation of SI, so it is unclear if any of these changes had a subtle influence on practice. Fourth, while we do not believe there was a failure to enter G, H, and I events in the Quantros system, this is unverifiable since all such outcomes were reported through this mechanism.  The vast majority of Quantros events are entered by nursing staff, and since they were unaffected by the granting of SI, it is likely their reporting patterns remained unchanged through the study period.  Fifth, University physicians, whether they received sovereign immunity or not, were protected by insurance provided by the medical group and do not directly pay for their own premiums, such as private practice physicians might, limiting the personal financial impact of sovereign immunity.  However, while University physicians may not be personally liable, they may experience acute stress disorder, shame, and self-doubt, a condition now known as the ‘second victim’30.  After being granted SI, and given the presence of trainees, one might imagine less oversight and management by the attendings after the threat of lawsuits was eliminated in the public hospital, but there was no evidence this occurred based on the declining incidence of serious safety events.  Sixth, the practice of offensive medicine (additional highly remunerative procedures after tort reform26, and its impact on total quality of care, would not be expected in the University of Miami’s salaried academic faculty. This might have resulted in a slight decrease in the incidence of safety events compared to a fee for service population of physicians.

The results of this study suggest that norms of practice, along with a stable physician commitment to providing the best care possible, are maintained without the threat of malpractice lawsuits.  Further, the persistence of safe practice patterns over at least four years following the granting of SI leads us to conclude that the threat of malpractice is not a significant driver of safe physician behaviors.  A well-functioning liability system should provide incentives to institutions that adopt safer systems, since tort reform on its own does not achieve this goal25,27. These investments should result in fewer adverse events and increased quality31. We believe that physicians are inherently committed to achieving sustainable patient safety practices, and, as we expected, adhere to professional standards regardless of the threat of being sued.


Contributors: DAL jointly conceived the study with DJB and MB. CT, MW, KL, SM, LFR and MB were involved in the study design and provided collated data.  All authors were involved in analysis and interpretation of the data. All authors revised it critically for important intellectual content and approved the final version. DAL is guarantor.

Funding: This study received no funding.

Ethical approval: This study was granted exemption from the university’s Institutional Review Board.

Transparency statement: The lead authors (the manuscript’s guarantors) affirm that this manuscript is an honest, accurate, and transparent account of the study being reported; that no important aspects of the study have been omitted; and that any discrepancies from the study as planned (and, if relevant, registered) have been explained.

The authors gratefully acknowledge Maureen Fitzpatrick, MSN, ARNP-BC, for her assistance with the manuscript.

Note: The first paragraph in the Background section of the initial version of this article read as follows:

In 1952, an agreement designated Jackson Memorial Hospital (JMH) as the teaching hospital for the University of Miami Miller School of Medicine. This arrangement stipulated that Miami-Dade County would operate JMH for both the indigent and for patients who could pay. The University of Miami, through the School of Medicine, provided the faculty to care for the patients and train residents. (Figure 1) What this meant, in fact, is that while JMH was protected by sovereign immunity (SI) as a government entity, the individual physicians who worked for the University of Miami could be held liable for medical errors. As a result, this exposed the University physicians as the only “deep pockets” during the care of South Florida’s most difficult and complex cases.  Recognizing the financial burden on the University from this arrangement, the State of Florida granted SI in November 2011 to the more than 900 University of Miami medical school faculty physicians who practice at the 1,600 bed JMH.  The same 900 clinically active employed physicians were on staff at the University’s privately-owned, 560 bed, University of Miami Hospital (UMH) and continued to practice there without SI.

References

  1. Pronovost PJ. Toward eliminating all harms. Quality Management in Health Care. 2016;25(3):185-186.
  2. Makary MA, Daniel M. Medical error – the third leading cause of death in the US. British Medical Journal. 2016;353:i2139.
  3. Reed TL, Levy D, Steen LT, Roach J, Taylor T, Call K, et al. Adverse event triggered event reporting for devices. Journal of Clinical Engineering. 2016;41(2):83-89.
  4. Hicks CW, Rosen M, Hobson DB, Ko C, Wick EC. Improving safety and quality of care with enhanced teamwork through operating room briefings. The Journal of the American Medical Association: Surgery. 2014;149(8):863-868.
  5. Birnbach DJ, Rosen LF, Williams L, Fitzpatrick M, Lubarsky DA, Menna JD. A framework for patient safety: a defense nuclear industry-based high-reliability model. Joint Commission on Journal on Quality and Patient Safety. 2013;39(5):233-240.
  6. Middleton B, Bloomrosen M, Dente MA, Hashmat B, Koppel R, Overhage JM, et al. Enhancing patient safety and quality of care by improving the usability of electronic health record systems: recommendations from AMIA. Journal of American Medical Inform Association. 2013;20:e2-e8.
  7. Otieno GO, Hinako T, Motohiro A, Daisuke K, Keiko N. Measuring effectiveness of electronic medical records systems: towards building a composite index for benchmarking hospitals. International Journal of Medical Informatics. 2008;77(10):657-669.
  8. Porter AJ, Narimasu JY, Mulroy MF, Koehler RP. Sustainable, effective implementation of surgical preprocedural checklist: an “attestation” format for all operating team members. Jointt Commission Journal on Quality and Patient Safety. 2014;40(1):3-9.
  9. Haynes AB, Weiser TG, Berry WR, Lipsitz SR, Breizat A-HS, Dellinger EP, et al. A surgical safety checklist to reduce morbidity and mortality in a global population. New England Journal of Medicine. 2009;360(5):491-499.
  10. Haynes AB, Berry WR, Gawande AA. What do we know about the safe surgery checklist now? Annals of Surgery. 2015;261(5):829-830.
  11. Mathews SC, Demski R, Pronovost PJ. Redefining accountability in quality and safety at academic medical centers. Quality Management in Health Care. 2016;25(4):244-247.
  12. Suk M. Sovereign immunity: principles and applications in medical malpractice. Clinical Orthopaedics and Related Research. 2012;470(5):1365-1369.
  13. Frakes M. Defensive medicine and obstetric practices. Journal of Empirical Legal Studies. 2012;(9):457-481.
  14. Mello MM, Studdert DM, Brennan TA. The new medical malpractice crisis. New England Journal of Medicine. 2003;348(23):2281-2284.
  15. Baicker K, Fisher ES, Chandra A. Malpractice liability costs and the practice of medicine in the Medicare program. Health Affairs (Millwood). 2007;26(3):841-852.
  16. Black BS, Wagner AR, Zabinski Z. The association between patient safety indicators and medical malpractice risk: evidence from Florida and Texas. American Journal of Health Economics. 2017;3(2):109-139.
  17. Sklar DP. Changing the medical malpractice system to align with what we know about patient safety and quality improvement. Academic Medicine. 2017;92(7):891-894.
  18. Mello MM, Kachalia A. Medical malpractice: evidence on reform alternatives and claims involving elderly patients. Medicare Payment Advisory Commission. http://www.medpac.gov/docs/default-source/reports/dec16_medicalmalpractice_medpac_contractor.pdf. Published December 2016.
  19. Dhankhar P, Khan MM, Bagga S. Effect of medical malpractice on resource use and mortality of AMI patients. Journal of Empirical Legal Studies. 2007;4(1):163-183.
  20. Shurtz I. The impact of medical errors on physician behavior: evidence from malpractice litigation. Journal of Health Economics. 2013;32:331-340.
  21. Stewart RM, Geoghegan K, Myers JG, Sirinek KR, Corneille MG, Mueller D, et al. Malpractice risk and cost are significantly reduced after tort reform. Journal of the American College of Surgeons. 201;212(4):463-469. e1-e42.
  22. McGwin G Jr, Wilson SL, Bailes J, Pritchett P, Rue LW 3rd. Malpractice risk: trauma care versus other surgical and medical specialties. The Journal of Trauma: Injury, Infection, and Critical Care. 2008;64(3):607-613.
  23. Encinosa WE, Hellinger FJ. Have state caps on malpractice awards increased the supply of physicians? Health Affairs. 2005;24:W5-250-W5-258.
  24. Thomas JW, Ziller EC, Thayer DA. Low costs of defensive medicine, small savings from tort reform. Health Aff (Millwood). 2010;29(9):1578-1584.
  25. Illingworth KD, Shaha SH, Tzeng TH, Sinha MS, Saleh KJ. The impact of tort reform and quality improvements on medical liability claims: a tale of two states. American Journal of Medical Quality. 2015;30(3):263-270.
  26. Avraham R, Schanzenbach M. The impact of tort reform on intensity of treatment: evidence from heart patients. Journal of Health Economics. 2015;39:273-288.
  27. Kessler DP, McClellan MB. How liability law affects medical productivity. Journal of Health Economics. 2002;21:931-955.
  28. Baicker K, Chandra A. The effect of malpractice liability on the delivery of health care. Forum for Health Economics and Policy. 2005;8(1). https://doi.org/10.2202/1558-9544.1010.
  29. Currie J, MacLeod WB. First do no harm? Tort reform and birth outcomes. The Quarterly Journal of Economics. 2008;132(1):795-830.
  30. Wu AW, Steckelberg RC. Medical error, incident investigation and the second victim: doing better but feeling worse? BMJ Quality and Safety. 2012;21(4):267-270.
  31. Kachalia A, Mello MM. New directions in medical liability reform. New England Journal of Medicine. 2011;364(16):1564-1572.


Table 1. Log linear model estimates

Estimate RR p-value
Hospital JMH 0.2946 1.3426 <0.0001
UMH
Post SI
Years Post -0.1368 0.8721 0.0109
Pre
Individual post-years
Years 2012 0.0059 1.0059 0.9373
2013 -0.1851 0.8310 0.0195
2014 0.0658 1.0680 0.3688
2015 -0.4339 0.6480 <0.0001
Pre
Legend: RR = Rate ratio. A negative estimate with a significant p value means there was a significantly lower rate of serious harm events.


 Table 2

Case Mix Index

Year University of Miami Hospital Jackson Memorial Hospital
2010 1.5533 1.364
2011 1.5651 1.392
2012 1.5824 1.401
2013 1.5841 1.434
2014 1.5872 1.443
2015 1.6054 1.523


Figure 1: Purpose of the Public Health Trust

The purpose(s) of the Trust shall include operation, governance, and maintenance of Trust facilities:

For the benefit of the general community and not for the exclusive benefit of any single individual or group of individuals; As the major provider of health services, directly and indirectly, to the poor and near poor with-in Miami-Dade County; For serving the health care needs of patients living in reasonable geographic proximity to Jackson Memorial Hospital and other Trust Facilities; With the capability of supporting, maintaining and managing a proper balance between primary, secondary and tertiary health care programs that will strive for a single standard of general and specialized health services; As a major referral center which has elected to offer a full range of medical and support specialties which are not generally available at community hospitals, including trauma care; As a teaching facility which operates training programs for physicians, nurses and other health care professionals; For providing major clinical facilities which support the University of Miami School of Medicine and other educational institutions, which train future health care professionals; and For providing opportunities for clinical and applied research in all areas of medicine to continuously upgrade the general level of medical care available to citizens. The purpose(s) of the Trust shall also include:

Participation in activities designed to promote the general health of the community; Providing recommendations to the Commission for the establishment of health care delivery policies in the designated facilities of the Trust; and Fulfillment of the objectives set forth by the Commission in the Trust Ordinance and compliance with County-wide health care delivery policies which have been or may be established by the Commission.

The purpose(s) of the Trust shall include operation, governance, and maintenance of Trust facilities:

For the benefit of the general community and not for the exclusive benefit of any single individual or group of individuals;

As the major provider of health services, directly and indirectly, to the poor and near poor with-in Miami-Dade County;

For serving the health care needs of patients living in reasonable geographic proximity to Jackson Memorial Hospital and other Trust Facilities;

With the capability of supporting, maintaining and managing a proper balance between primary, secondary and tertiary health care programs that will strive for a single standard of general and specialized health services;

As a major referral center which has elected to offer a full range of medical and support specialties which are not generally available at community hospitals, including trauma care;

As a teaching facility which operates training programs for physicians, nurses and other health care professionals;

For providing major clinical facilities which support the University of Miami School of Medicine and other educational institutions, which train future health care professionals; and

For providing opportunities for clinical and applied research in all areas of medicine to continuously upgrade the general level of medical care available to citizens.

Figure 2 A


Figure 2 B

Legend: Rate per 1000 patient bed days of Quantros G, H, and I reports per 1000 patient bed days by year.


Appendix: Statistical Analysis

Quantros report summaries with graded harm were available from 2010 to 2015 at both JMH and UMH.   Serious harm was defined as category G, H, and I in the Quantros system (Table 1).  In order to assess the effect of SI, the incidence of serious harm reports/patient bed day (Figure 2A) was used as an outcome in a log linear model using the log of patient bed days as the offset to account for unequal exposure to potential harm in each year. A binary time, pre-post SI, and a hospital indication (JMH or UMH) were included as independent variables.

The pre-sovereign immunity period in the pre-post SI variable was defined as pre-years (2010 and 2011), and the post-years, combining incidence of harm for 2012-2015. This two category grouping was chosen a priori to specifically compare incidence before and after the point of SI implementation. Pre vs post sovereign immunity incidence rates were evaluated, controlling for hospital trends over time by using an interaction term for JMH vs. UMH.

The interaction term was first examined between hospital and year while keeping both variables binary to evaluate whether SI’s effect on the incidence of harmful reports differed between hospitals. The interaction term was not significant (χ2=1.28; p=0.2580) and was dropped from the final model. A contrast was also conducted for the pre-sovereign immunity period vs each year of the post SI period a posteriori as well to see how individual post year was compared to the pre-years to make sure early or late temporal trends in behavior were not masked by the overall result. Contrast weights were evenly-distributed among each post SI year.

Our approach involves fitting a log-linear model to estimate and test the interaction effect between pre-post SI and hospital.  This allows us to estimate potentially differential effects of SI on the different hospitals, as well as test for significance in the difference between the effect of SI in the different hospitals. By incorporating the interaction term we are able to conduct the difference-in-difference estimation and testing. The model used is as followed:

In our model, the interaction term failed to reach statistical significance, indicating that we do not have evidence to support differential effects of SI among the hospitals.  For this reason, it is removed from the model and the final model used to generate the results in Table 1 is as followed:

In addition to the final model, which describes the effect of SI comparing pre vs post years as a binary variable, we also compared each individual post year to the pre years through contrast. The weights used for the contrast is as followed: pre-years (-1), 2012 (0.25), 2013 (0.25), 2014 (0.25), 2015 (0.25).


Leading Change – A National Survey of Chief Innovation Officers in Health Systems

Sneha P. Shah, Harvard Business School; Lauren McCourt, Kristina Jakobson, Amy Saddington, Kate Harvey, Russell Reynolds Associates; Kevin A. Schulman, Harvard Business School, Duke Clinical Research Institute and Department of Medicine, Duke University School of Medicine

Contact: Kevin A. Schulman, kevin.schulman@stanford.edu

To listen to the authors discuss their findings in a related webinar, click here.

Abstract

What is the message?

Chief innovation officer roles have been established in many health systems to guide innovation efforts. Respondents to our survey were enthusiastic, informed, and satisfied with the progress they have been able to make to date. However, whether organizational support and structure around this effort is yet sufficient for transformative innovation of delivery systems towards new models of care is an open question.

What is the evidence?

Structured survey of leaders at the 40 largest healthcare systems by revenue in the United States.

Submitted: January 26, 2018; Accepted after review: March 5, 2018

Cite as: Sneha P. Shah, MBA; Lauren McCourt, BA, BS; Kristina Jakobson, BA; Amy Saddington, BS; Kate Harvey, MBA; Kevin A. Schulman, MD. Leading Change—A National Survey of Chief Innovation Officers in Health Systems Health Management Policy and Innovation, Volume 3, Issue 1.

Introduction

Healthcare policy is increasingly designed to incentivize the transformation of healthcare delivery.1,2 Payment model reform requires health systems to develop the capacity to innovate so that they may successfully navigate clinical and organizational transitions to new models of care.3-9 This shift in focus has led to the rise of an “innovation agenda” in health care.10-12 One of the most visible responses to this agenda has been the rise of “chief innovation officers” in the highest ranks of executive leadership in health systems. The term chief innovation officer was described in 1998 as part of a growing recognition that innovation within organizations needed to include continuous and discontinuous, or disruptive, strategies.13 Individuals in the chief innovation officer roles were to identify new ideas, concepts, and business opportunities, and then to develop the capabilities to support and implement this agenda.13

A PubMed search found that, in 2016, 646 articles had been published on the topic of organizational innovation. However, only 2 articles pertained to the position or mission of chief innovation officers in health care.14,15 Both reports were single-institution descriptions of innovation efforts. While more systems are adopting a chief innovation officer as a member of their senior leadership team, little is known about the charge, evaluation, and support of the individuals in these roles.

We sought to better understand the organizational framework, reporting structure, resource allocation, and metrics of success for chief innovation officers. Based on these findings, we can better understand how these roles are structured within health care systems. These data can also allow us use concepts from organizational innovation theory to analyze whether health systems are adequately supporting their chief innovation officers for success of the innovation agenda in health care.

The summary results are striking. Of the 40 largest healthcare systems in the United States, 32 had a senior innovation officer. Half of respondents (52%) characterized their role as strategic, 24% as operational, and 24% as financial. Structurally, 80% resided within established organizational structures, and 36% reported directly to the chief executive officer. Overall, 44% had short-term metrics of success, 68% medium-term, and 24% long-term (nonexclusive responses). The median budget for the role was $3.5 million, but some organizations invested significantly more, usually in a venture capital function. In terms of barriers to innovation, 64% of respondents reported that the biggest barrier is culture or organizational structure, while 16% of respondents reported budget, talent, and process as the largest hindrances to innovation.

Methods

Survey Development

We developed a survey based on the conceptualized role of the chief innovation officer in health systems using teachings from organizational innovation theory.10-13,16,17  We advanced and tailored these concepts using a set of position specifications available to Russell Reynolds Associates, an executive search firm. Finally, we refined the survey through qualitative interviews with three chief innovation officers who volunteered to both respond to the survey and to provide feedback on the survey instrument. The final instrument was designed to be interviewer-administered, prompted by a set of open-ended discussion questions and recorded on a data collection form that included 23 structured questions: eight questions about organizational charge and structure, four about outcomes/metrics, two about barriers, three about resources, and four about career preparation and background. Finally, we developed two summary assessment questions, each using a 7-point Likert scale to better characterize the role of the chief innovation officer. The questions were anchored as internally focused vs. commercially focused, and as tactical vs strategic. The survey was considered exempt research by the institutional review board of Harvard University.

Survey Sample

We identified the 40 largest health systems by revenue in the United States using the Definitive Healthcare data set as candidates for our sample. We then used LinkedIn, organization websites, publically available press-releases, and Russell Reynolds Associates’ proprietary database to identify the chief innovation officer or most senior innovation-responsible executive at each organization. For organizations where we could not identify a chief innovation through the above methodology, or in the case that the identified chief innovation officer was the wrong executive, we conducted sourcing interviews with industry experts to identify the chief innovation officer or to confirm that the organization had such as position.

Survey Administration

Between January and May 2017, chief innovation officers received an email, consent form, and interview agenda detailing the content of the interview. Interviewers were cross-trained during the month of January to ensure standardization of interview delivery, and interviews were recorded to ensure quality control. Phone interviews were conducted over WebEx, and recordings were stored securely. Each call was attended by two interviewers—one who conducted the interview and the other who took notes during the call.

Nonrespondents received two follow-up emails sent one week apart, followed by a phone call one week later. Nonrespondents were contacted once more at one month after the initial four attempts at outreach. No financial incentive was included to encourage participation, and participants were informed that all data would be deidentified in reporting.

Data Analysis

We developed descriptive statistics for the 23 structured questions derived from the open-ended interview questions. We further categorized these roles using our own categorization of the chief innovation officer role from the qualitative interviews. Data from the structured interviews, the qualitative interviews, and the summary assessment questions are shown graphically in a 2-by-2 figure.

Results

We were unable to identify a chief innovation officer or equivalent position for eight of the 40 health systems in the sample. This resulted in a sample of 32 organizations with a chief innovation officer or other senior innovation-responsible executive. We were able to complete 25 interviews from this sample, for a response rate of 78%. Of the 25 individuals interviewed, 22 had “innovation” in their title, such as “chief innovation officer” or “senior vice president of strategy and innovation.” Nine of these 22 participants had “chief innovation officer” specifically in their title. Three participants did not have “innovation” in their job title but did have the term in their job description, such as “senior vice president of ventures” or “vice president of market development and incubations,” and were identified as the senior-most executive charged with the innovation agenda at their health system.

When asked to select whether the primary focus of their role was strategic, operational, or financial, we found that the majority (52%) of participants reported having a strategic focus, 24% operational, and 24% financial (Table 1). In qualitative analysis, we were able to characterize participants’ roles into 1 of 4 patterns: (1) an “internal consulting group” that educated, advised, and partnered around continuous process improvement (36%); (2) an incubator that worked to grow and scale projects (28%); (3) a group that imported and scaled established technology (12%); and (4) a venture fund that invested externally and sometimes internally (24%) (Table 2).

Table 1Characteristics of Chief Innovation Officers by Primary Function

Characteristic Strategic
(n = 13)
Operational
(n = 6)
Financial
(n = 6)
Total
(N =25)
Reporting directly to chief executive officer, % 54 0 33 36
Business unit outside existing structures, % 8 0 67 20
Budget (in millions), median, $a 3.0 2.0 35.0 3.5
Headcount, median, No.b 17.0 6.5 30.0 9.5

a  Budget data were provided by 9 of 13 chief innovations officers in the strategic function, 5 of 6 in the operational function, and 6 of 6 in the financial function.

b  Headcount data were provided by 13 of 13 chief innovation officers in the strategic function, 6 of 6 in the operational function, and 5 of 6 in the financial function.

Table 2. Primary Stated Focus vs. Functional Categorization of Chief Innovation Officers

Focus Strategic
(n = 13)
Operational
(n = 6)
Financial
(n = 6)
Total
(N =25)
Internal consultants 7/13 (54%) 2/6 (33%) 0 9/25 (36%)
Incubator 5/13 (38%) 2/6 (33%) 0 7/25 (28%)
Import and scale 1/13 (8%) 0 0 3/25 (12%)
Venture 0 0 6/6 (100%) 6/25 (24%)

In terms of reporting structure, only 36% of participants reported that they reported to the chief executive officer, with 8% reporting to the chief operating office and the rest to other senior leaders of the organization. Table 1 shows the organizational structure by primary focus.

Overall, 72% of participants reported that the organizational board is involved with the innovation efforts of the chief innovation officer. Most often, the board was noted to play an instrumental role in setting up the position or innovation centers in the health system. Subsequently, chief innovation officers often provided the board with quarterly or annual updates, but the board did not play an active role in setting the innovation agenda.

The majority of respondents reported that the innovation function resided within the traditional organizational structure, with 52% reporting that the innovation group is a new business unit within the existing structure, and 28% reporting that the innovation group is an existing business unit within an existing structure. Twelve percent of respondents reported that the innovation group was a new business unit outside of the existing organizational structure, and 8% of respondents reported that the innovation group is a new initiative outside of the traditional structure entirely, such as an external venture capital fund.

Most respondents (72%) reported that their organizations had developed an innovation center of some kind, and 89% of respondents in systems with innovation centers work directly with these centers. Thirty-six percent of respondents reported that they worked with the technology transfer function within their organization, and 72% work with external entrepreneurs, 56% with external venture capital firms, and 32% with external consultants. Sixty-eight percent reported that they have introduced tech solutions as part of their innovation agenda.

We obtained organizational timelines for 24 of the 25 chief innovation officer positions. The median number of years the position has existed at these institutions is 4 years (mean, 5.3 years); 16 (67%) have existed for 5 years or less, 7 (29%) for 6 to 10 years, and 1 (4%) for longer than 10 years.

We asked respondents about metrics used to assess the success of the chief innovation officer function, and 44% reported that the metrics used are short-term, 68% medium-term (1 to 3 years), and 24% long-term (multiple responses were permitted). Metrics reported by participants included individual project measures, counts of outside company partnerships, counts of employees that were influenced or reached, quality metrics, and financial return on investment metrics.

In terms of barriers to innovation, 64% of respondents reported that the biggest barrier is culture or organizational structure, while 16% of respondents reported budget, talent, and process as the largest hindrances to innovation. More than one response was allowed for this question. Overall, 28% of respondents reported that they spend a disproportionate amount of time advancing the innovation agenda at the executive level of the organization, 36% with operational leadership, 24% with financial leadership, and 24% with clinical or university leadership. None of the respondents reported that they spent a disproportionate amount of time with their board of directors.

Of all respondents, 20 (80%) provided their total budget amount and 24 (96%) shared their headcount. Overall, the median budget under the control of the chief innovation officer in was $3.5 million. There was a strongly skewed distribution of responses; 60% of respondents have a budget of $5 million or less, 15% greater than $5 million but less than or equal to $20 million, and 25% greater than $20 million. The latter group consisted of organizations that have developed their own venture capital funds. The median headcount was 9.5 people; 54% have a headcount of 10 or less, 29% have a headcount less than or equal to 50, and 17% have a headcount greater than 50. Of groups with greater than 50 full-time employees, 75% were organizations with their own venture capital funds. Overall, 68% of respondents reported that they are funded through operational funds, 24% through executive discretionary funds, and the rest through either investment or strategic funds.

We also asked about career trajectories and backgrounds. Among the respondents, 60% of respondents were internal candidates when appointed. Overall, 44% of respondents reported that they have an MD degree; among these, 45% are still practicing medicine. Four of 25 respondents were women.

The results of our summary questions sorted by the charge of the position are shown in the Figure. Overall, chief innovation officer roles that were characterized as strategic were most frequently identified as strategic and internally focused, roles that were characterized as operational were most frequently internally focused, and organizations with a financial charge were most frequently strategic.

Discussion

This study provides important data on the status of the innovation agenda across the largest healthcare systems. To our knowledge, it is the first study of innovation to look across multiple health systems and to specifically address the role of the chief innovation officer. In response to calls for organizational change, most of the largest health systems established a new leader in their organization to fill the role of a senior innovation officer. The structure and function of the role was remarkably diverse across systems, in mandate, structure, and budget.

We found a varied set of responses to the definition of innovation within an organization that often tracked with the definition of the chief innovation officer role. The responses reflected thoughtful approaches to the challenges of organizational innovation. As one respondent reflected, the role was created “in recognition that the tyranny of the daily trumps the pursuit of the remarkable…absent a countervailing force.…there is a large amount of untapped creative energy in the organization; and it needs a beacon to light the way.” This supports findings from the innovation literature: “Most companies have plenty of creativity and plenty of technology. What they lack are the managerial skills to convert ideas into impact.”16

Innovation can be characterized on a spectrum that includes execution, improvement, and transformation.17 Execution is focused on ensuring evidence-based practices (such as hand washing). Improvement (also known as sustaining innovation) is focused on incremental betterment of existing processes, products, or services. Transformation (also known as disruptive innovation) is focused on development of novel processes, products, or services that represent a fundamental shift in an approach that will eventually overtake existing processes.14,15 All of the participants we interviewed reported that they were focused on improvement or transformation as their core assignment.

The innovation literature has a growing focus on the role of organizational structure as a key enabling approach for organizations to consider, particularly for business transformation.4 This focus follows from the description of a classic organizational design at Hewlett-Packard’s printer division,12 through the restructuring of Google into Alphabet.18 Yet, in our study, only 20% of respondents reported that innovation included a novel organizational form. This result stands in contrast to an aspiration for transformative innovation in organizations, such as a shift to value-based payment models in health care. This result may limit the impact of these innovation efforts: “When innovators stop short of business model innovation, hoping that a new technology will achieve transformative results without a corresponding disruptive business model and without embedding it in a new disruptive value network or ecosystem, fundamental change rarely occurs.”12

For most organizations, the chief innovation officer role was characterized as a strategic one. Yet, in only a minority of organizations did the chief innovation officer report to the chief executive. As stated by 1 respondent,The reporting relationship is critical. [When asked], ‘Who owns innovation?,’ [our CEO] immediately said, without skipping a beat, ‘the CEO does,’ even with me sitting next to him. He is absolutely right. If the CEO doesn’t own innovation, the organization will eat it alive. It’s just not a fair fight. The CEO has to own it, drive it, and value it.”

Organizational culture and structure was the category respondents described as the biggest obstacle to success. The most important role of any leader is to establish and communicate a clear vision for the organization. In an organization as complex as a health care system, this is a difficult challenge, even when the market and policy environment is stable. While conceptually there is an understanding of the transition to value as a payment model in health care, in most markets and policy discussions this remains an aspiration rather than a market imperative. Thus, leaders discuss and address innovation often in the context of supporting existing fee-for-service business models. This lack of clarity at an organizational level can lead to confusion at an operational level in terms of the innovation agenda. As one of our respondents said, “Decide if you want to really innovate or not. Don’t pretend. Because that has implications across staffing, funding, organizational commitment.”

Most large healthcare organizations have finely tuned budget models with clear metrics to guide investment decisions. The innovation agenda can be challenging in this type of environment, as by definition innovation is not designed to be predicable and is inherently risky. In addition to investment in new organizational forms, innovation can replace existing legacy business models, such as facilities and clinical or administrative structures. Addressing these legacy issues requires political capital and close-out funding that can be equally difficult to manage from a resource allocation perspective.11 For most of the organizations in our survey, the chief innovation officer has a modest budget and headcount, given the strategic nature of the role.

The study has several limtations. Our study is based on self-report by survey respondents. We did not audit the data. When respondent organizations identified a senior leader who was the head of innovation, only 9 had the explicit title of chief innovation officer, and the research team had to determine whether the role was really a senior innovation role.

Chief innovation officer roles have been established in many health systems to guide innovation efforts in response to policy changes in health care. Respondents to our survey were enthusiastic, informed, and satisfied with the progress they have been able to make to date. However, whether organizational support and structure around this effort is yet sufficient for transformative innovation of delivery systems toward new models of care is an open question.


Acknowledgments

Funding/Support: This work was supported internally by the Duke Clinical Research Institute.

Additional Contributions: Damon M. Seils, MA, Duke University, assisted with manuscript preparation. Mr Seils did not receive compensation for his assistance apart from his employment at the institution where the study was conducted.


References

  1. Berwick DM, Hackbarth AD. Eliminating waste in US health care. Journal of the American Medical A 2012;307(14):1513-1516.
  2. Rajkumar R, Press MJ, Conway PH. The CMS Innovation Center–a five-year self-assessment. New England Journal of Medicine. 2015;372(21):1981-1983.
  3. McGlynn EA, McClellan M. Strategies for assessing delivery system innovations. Health Affairs (Millwood). 2017;36(3):408-416.
  4. Ellner AL, Stout S, Sullivan EE, Griffiths EP, Mountjoy A, Phillips RS. Health systems innovation at academic health centers: leading in a new era of health care delivery. Academic Med 2015;90(7):872-880.
  5. Schulman KA, Richman BD. Reassessing ACOs and health care reform. Journal of the American Medical Association. 2016;316(7):707-708.
  6. Song Z, Fisher ES. The ACO experiment in infancy–looking back and looking forward. Journal of the American Medical Association. 2016;316(7):705-706.
  7. Poku M, Schulman KA. We interviewed health care leaders about their industry, and they’re worried. Harvard Business Review. https://hbr.org/2016/12/we-interviewed-health-care-leaders-about-their-industry-and-theyre-worried. Published December 14, 2016. Accessed September 13, 2017.
  8. Herzlinger RE, Schleicher SM, Mullangi S. Health care delivery innovations that integrate care? Yes! But integrating what? Journal of the American Medical Association. 2016;315(11):1109-1110.
  9. Rudin RS, Bates DW, MacRae C. Accelerating innovation in health IT. New England Journal of Medicine. 2016;375(9):815-7.
  10. Herzlinger RA, Schulman KA. Diffusions of global innovations in health care: how to make it happen. Health Management, Policy and Innovation. 2016;2(1). https://hmpi.org/2016/10/17/diffusion-of-global-innovations-in-health-care-how-to-make-it-happen/. Published October 30, 2016. Accessed September 13, 2017.
  11. Richman BD, Mitchell W, Schulman KA. Organizational innovation in health care. Health Management, Policy and Innovation. 2013;1(3):36-44.
  12. Christensen CM, Grossman JH, Hwang J. The Innovator’s Prescription: A disruptive Solution for Health Care. New York, NY: McGraw-Hill; 2009.
  13. Miller W, Morris L. Fourth Generation R&D: Managing Knowledge, Technology, and Innovation. New York, NY: John Wiley & Sons; 1998.
  14. Dulin MF, Lovin CA, Wright JA. Bring big data to the forefront of healthcare delivery: the experience of Carolinas HealthCare System. Frontiers of Health Services Management. 2017;33(1):1-12.
  15. Samet K, Smith M. Thinking differently: catalyzing innovation in healthcare and beyond. Frontiers of Health Services Management. 2016;33(2):3-15.
  16. Gobindarajan V, Trimble C. The Other Side of Innovation: Solving the Execution Challenge. Boston, MA: Harvard Business Review Press; 2010.
  17. Christenson CM. The Innovator’s Dilemma: When New Technologies Cause Great Firms to Fail. Boston, MA: Harvard Business School Press; 1997.
  18. Page L. G is for Google. https://googleblog.blogspot.com/2015/08/google-alphabet.html. Published August 10, 2015. Accessed September 12, 2017.


Figure Legend

Figure. Summary Assessment Questions for Chief Innovation Officers With a Stated Primary Focus That Was Strategic (Panel A), Operational (Panel B), and Financial (Panel C).

Chief innovation officer roles that were characterized as strategic were most frequently identified as strategic and internally focused; roles characterized as operational were most frequently internally focused; and roles with a financial charge were most frequently strategic.


Healthcare Innovation Education in Schools of Medicine and Healthcare Management: Is There Light at the End of the Tunnel?

Regina E. Herzlinger, McPherson Professor, Harvard Business School, and founder of the Global Educators Network for Health Innovation Education (GENiE) 

Group analysis of universities: James Wallace, Senior Research Associate, Harvard Business School

Contact: Regina E. Herzlinger, rherzlinger@hbs.edu

Abstract

What is the message?

The expert participants of the October 2017 Global Educators Network for Health Innovation Education (GENiE) conference generated six predictions about key future healthcare innovations.

Content analysis of the focus and orientation of healthcare innovation courses at the top seven U.S. universities offering courses in medicine and healthcare management found only limited match to the predicted future needs of the healthcare system, particularly needs for nuanced knowledge of how to implement changes.

Interviews with key health care leaders and recruiters highlighted the innovation skills they wanted academia to teach. Academics agreed with these goals and identified the important collaborative efforts that needed to be implemented to achieve them.The article contains examples of academic institutions that have already attained them.

What is the evidence?

Content analysis of published curricula; interviews with 51 innovative healthcare CEOs and top healthcare recruiters; surveys of academics.

Submitted: November 25, 2017; Accepted after review: February 28, 2018

Cite as: Regina E. Herzlinger. 2018. Healthcare Innovation Education in Schools of Medicine and Healthcare Management: Is There Light at the End of the Tunnel? Health Management Policy and Innovation, Volume 3, Issue 1.

In many sectors of the economy, innovation not only raises productivity—which in turn controls costs, thus both increasing wealth and improving access to goods and services—but it also frequently raises quality. Consider the automobile industry, where costs declined relative to income, thus increasing access, and quality was vastly improved by process innovations, the Japanese model being a prime example.

Innovation in the large-scale healthcare delivery and payor sectors is critical to controlling costs and improving both quality and access. But instead, we are continually presented with mostly bigger versions of the same creaky, outdated machinery as successive consolidations and other attempts to refine existing ways of providing healthcare services raise prices with uncertain effects on quality and access.1,2  As but  one example of declining quality offered by current healthcare institutions, a  2016 article estimated that  250,000  U.S. deaths per year were caused by medical error,3 while 18 years ago, the landmark book To Err is Human estimated the maximum number of deaths at 98,000.4 Although the tally of  these deaths is somewhat controversial  , this important metric of quality in US healthcare has not improved, despite massive cost increases.

The Global Educators Network for Health Innovation Education (GENiE) Group

One reason for the lack of transformational healthcare innovation is the paucity of education specifically designed to prepare executive candidates to innovate. The Global Educators Network for Health Innovation Education (GENiE) Group was created to make innovation a central part of the education of future leaders in healthcare.  GENiE represents diverse, global academic institutions, professional organizations, and healthcare consultancies dedicated to teaching innovation to future leaders in healthcare.

When GENiE sponsored its latest conference in October 2017 at Harvard Business School in Boston, the GENiE researchers took advantage of this meeting of the minds to solicit the predictions of professionals seeking to make healthcare more efficient, affordable, and accessible. What innovations did they deem most and least likely in the healthcare space? What effects should those changes have on healthcare innovation education?

The participants at the October 2017 GENiE conference were acknowledged leaders in healthcare innovation from around the world, including current and former executives at Bain & Company, Centers for Medicare & Medicaid Services, Johnson & Johnson, Evercore, The World Bank, Massachusetts General Hospital, Cancer Treatment Centers of America, EIT Health (EU), Philips North America, The Cato Institute, Ribera Salud (Spain), TPG Growth (India), and the UnitedHealth Group. In parallel, a strong array of top-flight educational institutions represented health innovation education leaders from across the Americas, Europe, Asia, and Africa.

Where Is Healthcare Innovation Heading?

The 2017 GENiE conferees made a number of predictions about the most and least likely innovations in the healthcare space:

1.     On the supply side, generation of potential new products and services  by life sciences and technology innovators is highly likely to continue because they are well funded and amply taught
2.     On the demand-side,  adoption of innovations among payors, providers, and other actors is much more doubtful
3.     Healthcare financial systems and payors’ choices tend to reduce adoption of innovation significantly.
4.     Patient/consumer-centric innovation is key to improving outcomes
5.     Corporate-backed venture capital in the form of “intrapreneurship”: divisions inside large companies that conduct their own R&D will continue to increase.
6.     Major regulatory reform, while strongly needed, is unlikely

To evaluate these predictions, we drew upon diverse sources of information on the current role of innovation in the education of healthcare executives: a broad-based curriculum content analysis, interviews with CEOs and recruiters in the health sector, and surveys of academics who self-identified as being committed to teaching innovation in healthcare.

Where’s The Beef? Curriculum Content Analysis of Healthcare Innovation Courses 

We performed content analysis of more than 3,000 online descriptions of courses taught at 32 schools within the top seven U.S. universities offering courses in medicine and healthcare management.5 (Because our purpose is across-the-board analysis with an eye towards educational reform we do not identify universities by name.) We constructed our content analysis of these courses along two axes: focus (narrow vs. broad) and orientation (implementation vs. research).

  • Focus: Focus refers to the approach taken to target subjects. Generally, schools appear to focus on medical or healthcare management courses either narrowly (i.e., deep study of ONLY a few specific activities such as biomedical engineering or pharmacology) or more broadly (such as anatomy or digital health), with the chief objective of familiarization.
  • Orientation: Courses with an implementation orientation are typically concerned with a particular outcome or objective, e.g., a tangible product, service, or result that is often commercializable. The search terms selected to denote implementation of innovation included entrepreneur, hatch, innovate, invent, patent, and startup. Courses that approach innovation with a “research” orientation, on the other hand, typically focus on experimentation and development of knowledge; the eventual result may be commercialized but that is not the immediate goal. Search terms denoting a research orientation included adopt, commerce, develop, experiment, incubate, research, science, service, and technology.

In six of the top seven universities’ course descriptions, only 5% of the course offerings were oriented towards implementation. The remaining 95% of the course descriptions contained words that placed them in the “research” category, i.e., a concentration on the accumulation/ analysis of knowledge (see Figure 1, Curriculum content analysis of top US medical and healthcare programs). Only in the seventh university, a large institution in the Upper Midwest (it is the bubble showing 106 courses in the upper right quadrant of Figure 1), were a more encouraging 16.5% of course offerings in the “implementation” category. The bottom line: even prestigious schools that self-identify as educating healthcare managers are sorely lacking in course offerings that focus on adopting and implementing innovation rather than researching and creating it.

Figure 1. Curriculum content analysis of top US medical and healthcare programs.*

N = 3180 courses across 30 schools at the seven top universities offering courses in medicine and healthcare management.5

  • Blue = schools of healthcare management (HLT); Orange = medical schools (MED)
  • Bubble size/number = number of courses analyzed at that university
  • Quadrants: The vertical bar at 1.2 is the average of the occurrence of any innovation term (implementation/research) per course; the horizontal bar at 5.8 is the average number of terms per course denoting a focus on innovation implementation (rather than research).

* Among the 7 universities analyzed, one had healthcare management courses but no medical school; thus there are 7 blue bubbles but only 6 orange bubbles.

Match Between Six Predictions of Where Healthcare Innovation Is Heading and Current Innovation Curriculum

Below is a comparison of the six predictions of the GENiE participants regarding where healthcare is going with the education offerings gleaned from our content analysis.

  • Prediction 1: Generation of potential new products and services by life sciences and technology innovators is highly likely to continue because they are well funded and amply taught
  • Response 1: There is clearly extensive teaching about innovation in medical technology, with notable hubs of innovation education; but there is much less education on the implementation of such improvements.
  • Prediction 2: The adoption of innovations among payors, providers, and other actors on the demand-side is much more doubtful
  • Response 2: There is very little education on innovation for delivery and insurance; of more than 3000 courses, there was not one on payors.
  • Prediction 3: Healthcare financial systems and payors’ choices tend to reduce adoption of innovation significantly.
  • Response 3: This is another area for which innovation education is sorely lacking.
  • Prediction 4: Patient/consumer-centric innovation is the key to improving outcomes.
  • Response 4: Supportive evidence for this prediction found in the growth of high-deductible plans among well-informed consumers.8 But, again, appropriate education is sparse.

This kind of education can yield important, actionable results, such as the findings by Leslie K. John and colleagues on modifying consumer behavior. 11 Neither of the text warnings shown below produced a significant effect on consumer behavior.

However, the graphic warning label below reduced daily purchase of sugary drinks by 15.5 percent and the average calories per drink purchased from 88 to 75.11

  • Prediction 5: Corporate-backed venture capital in the form of “intrapreneurship”: divisions inside large companies that conduct their own R&D will continue to increase.
  • Response 5: Issues of organizational design are of great importance, as evidenced in the many failures of innovation in most large, seemingly well-resourced organizations.7  And, in the eyes of an experienced healthcare venture capitalist who attended the 2017 GENiE conference, many accelerators and innovation labs fail: “… because they mute the sharp point of a free market. If an idea is good enough, all the things that accelerators provided will come along anyhow. In the breeding ground for ideas they created, the bad ones took resources away from the good ones.”

Yet, our content analysis revealed much greater focus on corporate management than on entrepreneurship.

Some of our panelists illustrated novel intrapreneurship divisions designed as largely separate from the parent company to protect them from the “bear hug” that kills off too much innovation. When it’s time to implement a promising innovation, though, the innovation can deploy the parent company’s size and infrastructure to support effective dissemination.

  • Bruce Rosengard, Chief Medical, Science, and Technology Officer, Johnson & Johnson: “When I arrived, we started from scratch–which was an advantage. I was able to pull together elements of what is now J&J Innovation and J-Labs, creating a platform for new ventures inside Johnson & Johnson.  This has allowed us to invest in early-stage funding, while other sources of seed funding have decreased.”
  • Tommy Hawes, Managing Director, and Sandbox Industries: “When we started, we were trying to figure out how to innovate a function in a mature segment of the industry, i.e., venture funding in the Blue Cross Blue Shield system.  We did this by ceding control of the investment decision to our investors, a unique concept in venture funding… and it worked because of our culture.  We insisted on complete transparency, and over three funds, we moved from 11 to 31 of the 36 Blues plans as investors, and our results have followed this trend.”
  • Michael Weintraub, former Managing Director, Optum Ventures: “How did we do it [innovation]?  Shortly after (my company was)… acquired by UnitedHealth Group, I was asked a similar question at a conference.  I answered, ‘We’re going to innovate at scale.  We’re going to use the money, resources, and access to customers of a large company to accelerate our innovation, which is very hard for a small startup to do.  And that’s what we did.”
  • Prediction 6: Major regulatory reform, while strongly needed, is unlikely.
  • Response 6: Our content analysis revealed a greater focus on studying the nature of present regulation than on considering how regulation affects patients.

CEOs and Recruiters: Desired Qualities of Healthcare Innovation Executives

To determine desirable qualities in future healthcare innovation leaders from the perspective of employers, GENiE worked with a market research consultancy to interview 56 CEOs from the world’s largest and most innovative health-sector companies; those transcripts then underwent content analysis. 6

In addition, interviews with 16 leading U.S. healthcare recruiters provided insights in what they look for in senior-level candidates.6 Unsurprisingly, a content analysis of these interviews revealed ‘healthcare’ was the most frequent search term; but some form of the words ‘innovate’ or ‘entrepreneur’ came in second, ahead of ‘company,’ ‘industry,’ and ‘system.’

The recruiters found the hospital sector actively resistant to hiring innovators: “Where you’re getting innovation is everything outside of our hospital institutions.” They noted that, at least among employers who are healthcare providers, they see little “out-of-the-box thinking” and a lack of willingness to reward the type of risk required for substantial innovation. They opined: “institutions are looking for ‘regulated’ and ‘incremental change,’ not radical transformation”. Recruiters also squarely blamed academia for recruiting the wrong kinds of students and teaching them the wrong things in the wrong way. One noted, academia is “still teaching people and tracking people who want to be hospital administrators … you don’t get people who are really gung-ho…to do entrepreneurial things.”

Both recruiters and executives wanted to see students with deep knowledge of the healthcare domain, including a “strong strategic sense of the inter-relationships of manufacturers, distributors, providers, insurers and patients,“ as well as comfort with finance and venture capital and the utilization of data and technology. They were especially eager to find candidates prepared to take the risk of predicting and driving the future, who are self-reflective and -directed; the type of people “not content to have good jobs, but who want to run and build their own companies.” In a word: entrepreneurs.

Academic Leaders’ Views of Healthcare Innovation Education

Surveys of academics reflect an acknowledgment of the urgent need to educate students skilled in innovation—but also keen awareness of a number of roadblocks, including a shortage of business educators knowledgeable about healthcare delivery and insurance, health IT, and medical technology.4 They believe that public health and health administration faculty, on the other hand, often lack knowledge of appropriate managerial skills, entrepreneurial approaches to global health, venture capital, and the case method. These shortcomings are exacerbated by faculty resistance to curricular changes, together with academic incentives to conduct and publish traditional research rather than to foster innovation projects and innovate curricula. Additionally, scholars may have difficulty accessing data on real-world organizations or course material that integrates healthcare and business school curricula.

Conclusions

Those of us who educate healthcare executives have before us a daunting task—and an exhilarating opportunity.  Global healthcare faces a threefold crisis of unsustainable economics, erratic quality, and unequal access. The GENiE researchers find that CEOs are keenly aware of this crisis and of the vital role of innovation in finding our way out of it. The same is true of many academics, but they face considerable obstacles in reshaping curricula to support the necessary focus on education towards innovation.

We can support world leaders who are equal to the challenge of innovating 21st-century healthcare if we create unprecedented collaboration among disciplines and between academia and business; revamp curricula that may no longer serve us; and use the academic tools we know to be effective. We have already been notable examples of progress. In the US and Canada several noteworthy academic programs in healthcare innovation have been created.

  • Harvard Business School launched its Healthcare Initiative (HCI) in 2005, offering courses, industry speakers, career coaching, treks, and alumni engagement for aspiring healthcare innovation leaders.
  • The University of Alabama Collat School of Business offers MBA students (and non-MBA graduate students in science) a Graduate Certificate in Technology Commercialization and Entrepreneurship. The program blends classroom and experiential learning to move scientific discovery and inventions out of the lab and into the marketplace.
  • The University of Texas at Austin’s Dell Medical School, whose stated mission reads, “We will revolutionize how people get and stay healthy.” That is further broken down into: “Improving health in our community as a model for the nation; Evolving new models of person-centered, multidisciplinary care that reward value; Advancing innovation from discovery to outcomes; Educating leaders who transform healthcare; and Redesigning the academic health environment to better serve society.”
  • Duke University’s Masters of Management in Clinical Informatics program engages students with concepts and practice at the frontier of digital health.
  • The University of Toronto’s Rotman School of Management has launched a Global Executive MBA program in Healthcare and the Life Sciences, focused on engaging experienced leaders from the full health sector value chain and helping them learn how to engage at the interfaces of traditional silos.

Across the Atlantic, the European Institute of Innovation and Technology (EIT) has formed EIT Health, a consortium that promotes research, education, and business expertise to accelerate entrepreneurship and innovation in healthy living and active ageing with the aim to improve quality of life and healthcare across Europe.”7 The Copenhagen Business School has both a Department of Innovation and Organizational Economics and is affiliated with the Innovation Growth Lab, which describes itself as “A global laboratory for innovation and growth policy, bringing together governments, researchers and foundations to trial new approaches to increase innovation, accelerate high-growth entrepreneurship and support business growth.”10

All the stakeholders – providers, payors, life sciences, investors, and government – must support educational innovators like these in disseminating their efforts to create the executives healthcare needs.

We are hopeful. If any scholars should believe in their ability to spearhead substantial change, it is those in healthcare. After all, their area of expertise has more than once vanquished the seemingly impossible, whether by substantially increasing life spans or revoking the death sentence of AIDS in the developed world. Will our crowning achievement be to broaden access to healthcare across the world through cost-effective managerial innovations?

References

  1. Herzlinger RE, Richman BD, Schulman KA. Market-based solutions to antitrust threats–the rejection of the Partners settlement. New England Journal of Medicine. 2015;372(14):1287-1289.
  2. Gaynor M, Mostashari F, Ginsburg PB. Making Healthcare Markets Work: Competition Policy for Healthcare. Journal of the American Medical Association. 2017;317(13):1313-1314.
  3. Makary MA, Daniel M. Medical error-the third leading cause of death in the US. British Medical Journal. 2016;353:i2139.
  4. Institute of Medicine. To Err Is Human: Building a Safer Health System. Washington, DC: The National Academies Press; 2000. https://doi.org/10.17226/9728.
  5. Best U.S. Healthcare Management Programs. U.S. News & World Report. https://www.usnews.com/best-graduate-schools/top-health-schools/healthcare-management-rankings?int=abc409. Accessed October 19, 2017
  6. Herzlinger RE. Benchmarks for Confronting the Challenges for Innovation in Healthcare with a Modern Curriculum. GENiE 2012 Annual Conference; Boston, MA. Harvard Business School, 2012. http://www.thegeniegroup.org/publications/. Accessed December 12, 2017.
  7. Herzlinger R, Wiske C. Disseminating and Diffusing Internal Innovations: Lessons from Large Innovative Healthcare Organizations. Health Management Policy and Innovation. 2017;2(2). https://hmpi.org/2017/09/08/disseminating-and-diffusing-internal-innovations-lessons-from-large-innovative-healthcare-organizations/. Published July 1, 2017. Accessed October 19, 2017.
  8. Thaler, RH. Why So Many People Choose the Wrong Health Plans. The New York Times. https://www.nytimes.com/2017/11/04/business/why-choose-wrong-health-plan.html. Published November 4, 2017. Accessed January 1, 2018.
  9. EIT Health. https://www.eithealth.eu/. Accessed December 30, 2017.
  10. Copenhagen Business School. Innovation Growth Lab. http://www.innovationgrowthlab.org/affiliations/copenhagen-business-school. Accessed December 30, 2017.
  11. Donnelly GE, Zatz LY, Svirsky D, John LK. Graphic Warning Labels Curb Sugary Drink Purchasing. GENiE 2017 Annual Conference; Boston, MA. https://static1.squarespace.com/static/534853fbe4b021e125a8a4ee/t/5a859a8041920237fe9124b0/1518705282259/GENiE+2017+White+Paper+2018+02.13.pdf. Published February 14, 2018. Accessed February 23, 2018.


Value Chain Integration Strategies in Global Health

Raman Sohal, Onil Bhattacharyya, Will Mitchell, University of Toronto 

Contact: Will Mitchell, william.mitchell@Rotman.Utoronto.Ca 

Abstract

What is the message?

Social enterprises have been able to leverage resources from a range of partners along the health systems value chain in order to fulfil their core mission of health services delivery at the base of the pyramid. The ability to draw upon existing infrastructure and distribution channels has enabled these social enterprises to significantly reduce their start-up and ongoing costs and simultaneously expand their reach. As the examples illustrate, value chain integration requires health services organizations to be deliberate in reaching disparate types of partners that are needed along stages of their value chains from financing, setting up a clinic, and health service delivery. In doing so, the lead organizations benefit from enabling strategies in the form of developing an efficiency core and gaining strength in four key types of management skills.

What is the evidence?

A mixture of primary interviews plus reviews of studies in the published literature.

Submitted: October 17, 2017. Accepted after review: December 20, 2017

Cite as: Raman Sohal, Onil Bhattacharyya, Will Mitchell. Value Chain Integration Strategies in Global Health. Health Management Policy and Innovation, Volume 3, Issue 1.

Introduction

Health systems around the world are increasingly recognizing the benefits of value chain integration (VCI) strategies to foster scalable services (Kim, Farmer, & Porter, 2013; Porter & Teisberg, 2006). VCI strategies involve coordinating the activities of partners that help design, develop, produce, and deliver goods and services to customers (Adner, 2006; Mitchell, 2014). These strategies help global health services that target base of the pyramid clients overcome barriers to growth that arise from the complexity of the broader ecosystem in which healthcare activities are embedded. VCI offers the potential for health service organizations to work with skilled partners for funding, health services delivery, logistics, political support, and other key elements of the healthcare value chain. Yet we are only beginning to understand the nature of VCI in global health, as well as the challenges that organizations face in implementing the strategies.

This qualitative study examines how health services delivery organizations use value chain integration to achieve scale lower and middle income countries. We describe how ten private sector global health organizations operating in Africa, the Americas, and Asia are using VCI strategies, highlighting both successful routes and challenges to achieving sustainable scale. We selected the cases based on their ability to help us refine and develop categories of VCI as an emerging conceptual framework in global health delivery. We identify three main mechanisms for using a VCI strategy to scale up health services delivery: identifying mutual dependency with partners, creating an efficiency core (Wong et al., 2014), and building a strong set of four types of management skills, including financial skill, quality management, supply chain management, and client relationships. The base conclusion is that – despite real challenges – creating value chain integration partnerships with diverse actors can help global health enterprises serve clients effectively.

Table 1 summarizes the ten cases. Four organizations operate in one country while the remaining six operate in two to 42 countries. Six have for-profit legal structures and four are non-profit.We drew on existing literature and then supplemented the data by interviewing leaders of five of the organizations. The published research and interviews provide lessons about how organizations implement VCI strategies.

Table 1. Examples of Value Chain Integration Strategy
 Organization Mutual Dependency Management Capabilties Efficiency Core
1. Healthy Entrepreneurs

(Congo, Uganda, Tanzania, Ghana, and Haiti)


Source: Literature

Health Entrepreneurs (HE) has developed a full supply and distribution chain solution to bring high-quality and affordable health products to rural regions. HE streamlines the supply chain, reducing inefficiencies caused by “middlemen” and sub-contractors. Their team equips, trains, and provides technical support to a network of franchisees that in turn provide health education and sell essential medicines and products to remote communities. Healthy Entrepreneurs offers of a combination of health education, screening, counseling, referral and access to products. HE has developed a full supply and distribution chain solution to bring high-quality and affordable health products to rural regions.
  • Supply chain model
  • Franchise model
  • Last mile distribution model
2. Jacaranda Health

(Kenya)


Source: Literature and interviews

By offering high-quality maternity services, Jacaranda has been able to develop strong relationships with government clinics in Kenya. Jacaranda provides capacity building training to government hospitals to help them improve their maternity services. Jacaranda Health in Kenya, operates a chain of maternity hospitals and provides comprehensive maternity care at a fifth of the cost of other private hospitals. Jacaranda uses a fee-for-service model and combines quality and affordability in its service offering. The maternity hospitals are located in in peri-urban Nairobi, in the backyards of the women who need them most. The organization provides respectful patient-centerd obstetric care, safe delivery, family planning, and postnatal care.
  • Clinic chain
  • Revenue generation
  • Narrow clinical scope
3. Lifenet International

(Burundi, Uganda, and the Democratic Republic of the Congo)

Source: Literature and interviews

Lifenet originally piloted a nurse-led model in which nurses would do outreach in the communities to deliver primary care. During the pilot phase, however, Lifenet realized that existing church-run medical centers not only already provided healthcare to Burundi’s rural poor, but these centers had significant buy-in from the community. Rather than set-up a parallel system, Lifenet abandoned the nurse-led community model and developed a franchise conversion model to bring existing providers into the Lifenet network, which now includes 90 health centers in three countries in Africa in Burundi, Democratic Republic of the Congo and Uganda. Lifenet provides comprehensive solutions to management, medical and supply problems. LifeNet International’s conversion franchise model includes nurse training, management training, growth financing, and pharmaceutical supply to transform quality of care and increase range of services in primary healthcare facilities in Burundi, Uganda, and the DRC. Lifenet provides logistics, financing, equipment and training services to existing, faith-ba  sed health centers in East Africa. Lifenet’s partners finance their own operations, as well as medicine and equipment purchases, ensuring local responsibility and sustainability.
  • Conversion franchise model
  • Medical training
  • Management training
  • Pharmaceutical supply program
  • Loan program
4. North Star Alliance

(12 countries in Sub-Saharan Africa)


Source: Literature and interviews

North Star has forged alliances with different types of actors in order to obtain the resources, both tangible and intangible, its needs in order to deliver healthcare to mobile populations along the transport corridor in Africa.  North Star Alliance received significant public support from the humanitarian, government and the private sector. The impact of the HIV/AIDS crisis on a productive workforce (i.e., truck drivers) enabled North Star to leverage support from potential allies such as the United Nations World Food Programme and from partners in the commercial sector, such as the global courier company TNT Express. These partnerships enabled North Star to obtain resources and capabilities needed to launch the Roadside Wellness Centre network in ten countries in Africa. North Star Alliance is a non-profit that has established a network of roadside health clinics at major truck stops and border crossings to serve hard-to-reach populations across Africa, including truck drivers, sex workers and general community members. North Star operates in collaboration with government, businesses and civil society partners and identifies disease hotspots along major transport routes, where clinics are housed in blue-box shipping containers. North Star forms teams of local community health workers to conduct outreach activities to reach its target population, which comprises mobile populations.  North Star uses principles of logistics and supply chain management to establish network of Roadside Wellness Centres in 10 countries in Africa. The organization has developed an electronic health passport that syncs across 10 countries.
  • Standardized network of RWCs along transport corridor in Africa
  • Lean staffing model
  • Electronic health passport system that syncs across 10 countries
  • Task-shifting
5. Operation Asha

(Cambodia, India)


Source: Literature

Operation ASHA partners in locations with extensive foot traffic. For patient convenience, Operation ASHA establishes TB treatment centers within strategically placed shops, homes, temples, and health clinics. The organization also works closely with  other NGOs and governments at international and national levels. Patient convenience, community mobilization, and comprehensive counselling form core components of the organization’s offering. Operation ASHA trains community members (often former patients) to become TB health workers who are responsible for identifying new patients, ensuring adherence to the drug regimen, and carrying out regular educational campaigns.
  • Shared distribution channels
  • Community Health Worker Model
6. Penda Health

(Kenya)


Source: Literature and interviews

Penda Health partners with a range of partners including factories, universities and insurance companies in order to scale its operations in Kenya. By building alliances with organizations that can offer a paying client base, Penda not only scales up its operations, it also strengthens its sustainability. Penda Health operates a chain of primary care clinics in Kenya. Penda offers affordable, high-quality, standardized, evidence-based medical care for the whole family, including scarce women’s sexual and reproductive services such as breast and cervical cancer screening, provided by friendly, caring staff via an outpatient clinic model.  In addition to curative healthcare services, Penda offers “Wellness Checks” for men, women, and children and some counseling, which all fall under the umbrella of preventive healthcare services.
  • Clinic chain
  • Revenue generation
  • Task-shifting
7. Riders For Health

(Seven Countries In Sub-Saharan Africa)


Source: Literature

The Riders for Health network of technicians regularly travels to service vehicles in the communities that health workers serve. Riders works with ministries of health, international and African NGOs, private-sector organizations, local community-based organizations, and religious groups, to improve access to healthcare for over 21 million people. Riders for Health manages motorcycles, ambulances, and other four-wheel vehicles used in the delivery of healthcare in seven countries across Africa. Rider’s network of technicians regularly travels to service vehicles in the communities that health workers serve. Riders works with ministries of health, international and African NGOs, private-sector organizations, local community-based organizations, and religious groups to improve access to healthcare for over 21 million people. In addition, Riders’ programs provide training and employment opportunities to build local capacity.
  • Fleet management system for healthcare delivery in Africa
8. Unjani Clinics

(South Africa)


Source: Literature and interviews

Unjani Clinics is backed by a logistics supplier, Imperial Health Sciences Ltd., through its CSR activities. Unjani has been able to obtain the start-up capital needed to establish a social franchise of primary care clinics through Imperial. Imperial provides the working capital for Unjani Clinics to be set up. Unjani Clinics also enable Imperial to pursue opportunities to grow new markets for clients in Africa. Imperial was cognizant that by catering for a segment of the population which was currently under served, Unjani Clinics offered a means to grow its core pharmaceutical and consumer clients’ sales volumes. Unjani Clinics uses a social franchise model to achieve scale in South Africa.  The clinics provide primary healthcare services at an affordable price to under-served communities in South Africa. The fee-based service model enables sustainability and the empowerment of black women through the use of a franchised business model. Unjani’s clinics are made in South Africa from converted second hand shipping containers. Critical to the success of each location is the selection of the nurse and the clinic location. Nurses are selected from the communities they serve. Unjani provides back-end support such as logistics, supply chain, pricing and supplier services, as well as training and mentoring to ensure that each nurse has the necessary tools to own and operate a sustainable business. ·       Task-shifting

·       Community nurses

·       Social franchise

9. VisionSpring 

(42 countries in Africa, Asia, and the Americas)


Source: Literature

VisionSpring has leveraged its partnership with existing organizations, such as BRAC, to expand its reach in other countries. While in South America VisionSpring has adopted a hub-and-spoke model using its own stores as its main distribution channels and a variety of local partners, in Bangladesh VisionSpring leverages the national distribution capacity of a single partner – the Bangladesh Rural Advancement Committee (BRAC). This partnership enables VisionSpring to take advantage of BRACs’ vast network as a distribution platform. VisionSpring uses a “business in a bag” model to generate revenue that enables it to provide eye screening for the poor. The organization also uses shared distribution channels to expand its reach in 43 countries. VisionSpring uses a Vision Entrepreneur (VE) distribution model: this involves training and empowering local people, mostly women, to conduct basic eye exams in low-resource settings and to sell low-cost, durable reading glasses. One pair, with a case and cleaning cloth, costs from US$2.50 to $4.00. VisionSpring employs a retail component to its business in India through both stand-alone optical shops and shops located within partner hospitals and surgical centers. These optical shops serve base-of-the-pyramid customers by providing comprehensive eye exams and selling affordable prescription, reading and sunglasses. ·           Hub-and-spoke model

·           Vision Entrepreneurs

·           “Business-in-a-bag” model

10. Ziquitza Healthcare Limited

(India)


Source: Literature

Ziquitza Healthcare Limited offers “white labelling” opportunities, which enables private hospitals to brand Ziquitza ambulances. While the hospitals receive publicity and visibility through branded Ziquitza vehicles, Ziquitza in return is able to mobilize the financial resources it needs to subsidize its core operations, which focus on emergency transport for the poor. In sum, Ziquitza has established a range of revenue streams that allow it to remain socially inclusive and financially sustainable.


Ziquitza is built on two models for emergency transportation: Dial 1298, a fully private service, and Dial 108, a public service supported by state governments. For its 1298 model, Ziquitza operates a private ambulance service in Mumbai, Kerala, Bihar, and Punjab that charges wealthier patients more to be transported to private hospitals, using that revenue to cross subsidize its discounted or free service to lower-income patients. Through the 1298 program, Ziquitza operates a network of fully equipped Advanced and Basic Life Support Ambulances across two states in India. 1298’s business model uses a sliding price scale driven by a patient’s ability to pay, which is determined by the kind of hospital to which patients choose to be taken. · Cross-subsidization

·        Tiered-pricing strategy

·        Narrow offering

Revenue generation

Table 2 lists nine common value chain steps for health services delivery: 1) financing, 2) infrastructure and set-up, 3) obtaining real-estate, 4) registration and permits, 5) recruitment, 6) supply chain management, 7) identifying clients, 8) marketing and branding, and 9) delivery.


Table 2. Nine Value Chain Integration Steps For Health Services Organizations
1. Financing Obtaining financial capital necessary to deliver the product or service.
2. Infrastructure and set-up Obtaining physical infrastructure (e.g., clinic) needed to deliver the health product or service
3. Real estate Obtaining the land from which the organization can operate in order to deliver a product or service
4. Registration and permits Obtaining necessary registration and permits (e.g., ministry of health permits) to provide a health service
5. Recruitment Hiring administrative and clinical personnel
6. Supply chain management Management sourcing of necessary supplies (e.g., medical supplies)
7. Identifying clients Identifying relevant customers
8. Marketing and branding Promoting the product or service
9. Delivery Providing the product or service to the target customers

Mechanisms for a VCI Strategy

Identifying mutual dependency with partners

An underlying tenet of VCI strategy is that organizations should not try to do everything themselves, especially activities where other actors in the ecosystem have superior skills and positions (Porter, 1985; Mitchell, 2014). Capron and Mitchell (2013) highlight that strategic challenges lie not only in identifying which resources are needed, but how to obtain resources. The organizations in our sample developed alliances with partners at different stages of their value chains (Table 1). Resource-limited health services organizations that are effective at identifying relevant mutual dependencies can often borrow critical resources from partners in order to pursue expansion goals. Kramer and Pfitzer (2016), for example, note: “The first large-scale program to diagnose and treat HIV/AIDS in South Africa was introduced by the global mining company Anglo American to protect its workforce and reduce absenteeism.” In 2016, Anglo American formed an alliance with UNAIDS to support ProTest HIV, a global initiative that encourages people to be tested for HIV. Research demonstrates that scaling global health delivery requires support from a range of partners, including governments, bilateral and multilateral aid agencies, and the private sector (Bhattacharyya et al., 2010). Examples from our study offer powerful insights.
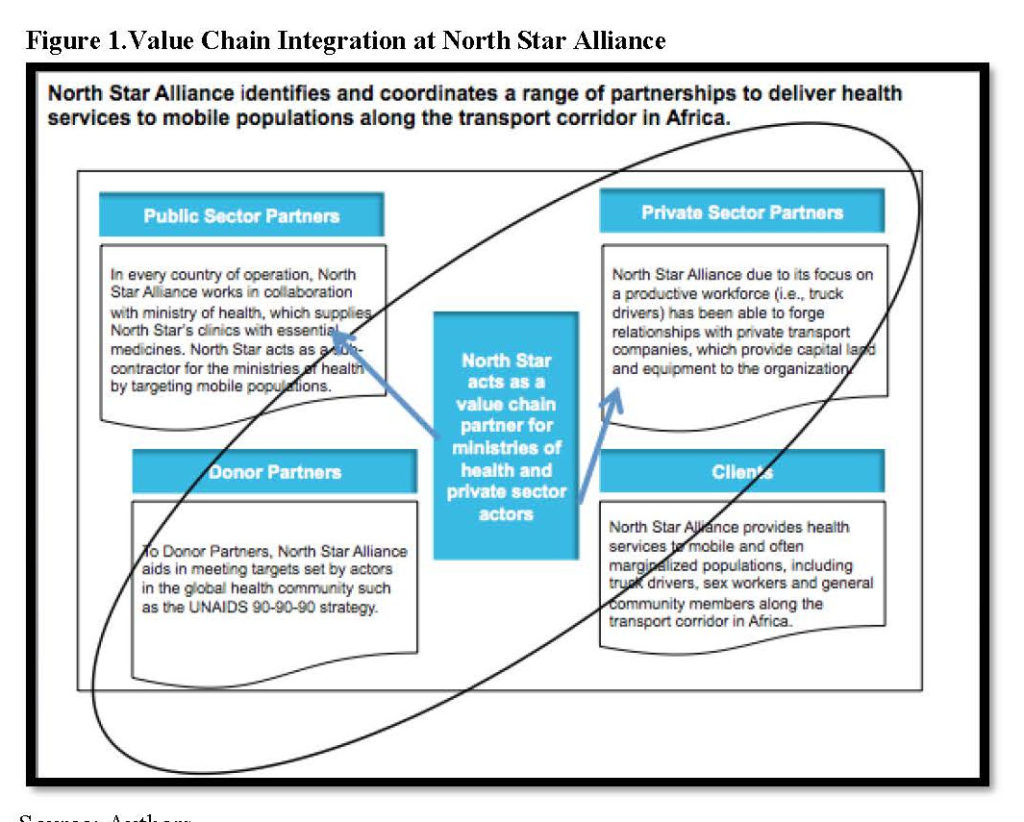
North Star Alliance

North Star Alliance in Sub-Saharan Africa has used value chain partners predominantly in steps one, three, four, six, and seven of the value chain. North Star’s value chain requires that the organization acquire land, set up clinic infrastructure, maintain medical stock supply in order to provide healthcare delivery to truck drivers and sex workers. As a non-profit health services organization, North Star has developed alliances with different types of actors in order to obtain tangible and intangible resources it needs to deliver healthcare to mobile populations along transport corridors in several African countries. When it launched its operations, North Star received significant public support from the humanitarian, government, and private sectors. The impact of the HIV/AIDS crisis on a productive workforce of truck drivers enabled North Star to leverage support from potential allies such as the United Nations World Food Programme (UNWFP) and partners in the commercial sector such as the global courier company TNT Express. These partnerships allowed North Star to obtain the financial resources needed in the first stage of the value chain to establish a network of 36 Roadside Wellness Centres in ten countries.

Health services organizations that can align goals throughout their partnerships often can expand their resource base. In Kenya, as Figure 1 depicts, North Star Alliance has been able to formulate an alliance, along step three of its value chain, to procure free land for all eight of its clinics from the Kenya National Highway Authority (KENHA). While many entrepreneurs bid for the same land, North Star reached an agreement to set up its clinics along the transport corridor and write-off rent – a significant cost.  KENHA, due to its contracts with investment banks, must provide HIV/AIDS services to its contract employees, who are highway construction workers. A manager from KENHA told us that “Because of our agreements with the investment banks, there is a clause that we have to provide HIV services to our workers. We don’t have the capability to do this on our own. We had a hard time finding an NGO that provides HIV services to immigrant workers on contract along the highway. North Star is the only organization we know of. North Star is helping us.”

Unjani Clinics

Unjani Clinics is a social franchise that has established nurse owned and operated clinics for the underserved in South Africa. Unjani is the corporate social responsibility arm of a pharmaceutical company, Imperial Health Sciences. The Unjani Clinic model contributes to strengthening South Africa’s health system and creating employment under the national Black Economic Empowerment (BEE) program. The BEE Codes of Good Practice compel large companies to spend three percent of their net profit to develop small and medium enterprises with a majority black shareholding – two percent for businesses within their corporate supply chain and one percent to help grow other businesses (Gordon Institute of Business Science, 2016). Mutual dependency between Unjani and this South African government initiative in turn helped Imperial Health Sciences position itself to attract government tenders (step one in the value chain) for its core business operations.

Leveraging shared distribution channels

Leveraging shared distribution channels offers a powerful means of benefiting from mutual dependency. Within the value chain, an important stage is setting up infrastructure to establish clinics (step two). Procuring real estate to set up operations can be costly for social enterprises targeting the base of the pyramid. One means through which organizations in our sample have managed to reduce or write-off set-up costs is by leveraging shared distribution channels.

Lifenet International

Lifenet’s conversion franchise model largely dispenses with staffing and focuses on managing existing providers in the healthcare delivery value chain in Burundi, Uganda, and the Democratic Republic of the Congo. Lifenet originally piloted a model in which nurses would do outreach in the communities to deliver primary care. During the pilot phase, Lifenet realized that existing church-run medical centers not only already provided healthcare to Burundi’s rural poor, but also had significant buy-in and trust from the community. Rather than create a parallel system, Lifenet abandoned the nurse-led model and developed a franchise system to bring existing providers into the Lifenet network. This enabled the providers to increase the value of their primary care delivery to the rural poor. Lifenet’s franchise model includes nurse training, management training, growth financing, and pharmaceutical supply.
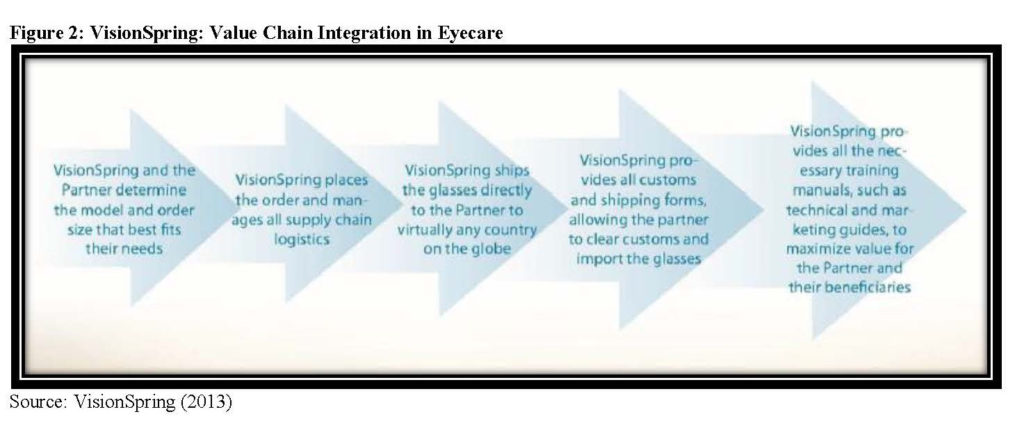
VisionSpring

VisionSpring partners even more intensively than Lifenet to supply eyeglasses to partners via an existing distribution system’s existing client base in countries throughout the world. In Bangladesh, VisionSpring has leveraged the national distribution capacity of the Bangladesh Rural Advancement Committee (BRAC). VisionSpring uses BRAC’s existing sales force, which includes approximately 80,000 women who sell baskets of health-related goods such as Band-Aids and Aspirin  (Hassey & Kassalow, 2014). By partnering with BRAC, VisionSpring achieved rapid scale and reduced its own training and administrative costs. In South Africa, VisionSpring partnered with Unjani Clinics (Center for Health Market Innovations, 2013). While Unjani’s patients are able to access primary care services at the clinics, vision screening was problematic as the Unjani network did not want to offer the screening without offering clients the ability to purchase the glasses at the point of care. VisionSpring places orders for eyeglasses for its partners and manages all supply chain logistics (VisionSpring, 2013). VisionSpring has found a sustainable specialized position in healthcare delivery and is coordinating a focused piece of the healthcare delivery value chain through extensive partnerships.

These examples illustrate how social enterprises have been able to leverage resources from a range of partners in order to fulfil their core mission of health services delivery at the base of the pyramid. The ability to draw upon existing infrastructure and distribution channels has enabled these social enterprises to significantly reduce their start-up and ongoing costs and simultaneously expand their reach. As the examples illustrate, value chain integration requires health services organizations to be deliberate in reaching disparate types of partners that are needed along stages of their value chains from financing, setting up a clinic, and health service delivery.


Simply creating and managing partnerships is not enough for a successful VCI strategy. In addition, the lead organizations benefit from enabling strategies in the form of developing an efficiency core (Wong, Zlotkin, Ho, & Perumal, 2014) and gaining strength in four key types of management skills.

Enabling Strategy 1: Developing an Efficiency Core

The global health literature highlights standardization and simplicity as necessary ingredients for scaling interventions (Cooley & Kohl, 2006; Simmons, Fajans, & Ghiron, 2009). The notion of the efficiency core refers to the standardized part of a model that can be replicated with minimal modification to fit local contexts (Wong et al., 2014). Each of our cases has an identifiable efficiency core, as Table 1 summarizes.

  • North Star Alliance: North Star has an efficiency core consisting of a blue-box shipping container that provides the office, together with a lean staffing model comprised of five individuals: clinical officer, HIV testing counselor, site coordinator, receptionist, and security guard.
  • Unjani Clinics: Unjani has an efficiency core consisting of a shipping container clinic owned and operated by a nurse from in the local community. Unjani trains nurses in entrepreneurship and business management.
  • VisionSpring: VisionSpring has an efficiency core consisting of Vision Entrepreneurs who use a “Business-in-a-Bag” approach to operate micro franchises, traveling from village to village to conduct vision camps, check eyesight, and sell glasses through door-to-door sales (Hassey & Kassalow, 2014).
  • Riders For Health: Riders’ efficiency core is a fleet management system. The system involves managing health workers’ motorcycles, conducting regular preventive maintenance, and training workers (Business, 2014). Riders developed a replication team that can introduce their system in any country or any project of any size. For example, the team replicated the Riders system in less than two months in Liberia during the Ebola crisis.
  • Jacaranda Health: Jacaranda uses a standardized model targeted on maternity care for its chain of clinics in Kenya.

In addition to creating an efficiency core as part of pursuing a VCI strategy, organizations need strong management capabilities in order to create value for hard-to-reach and last mile populations at the base of the pyramid.

Enabling Strategy 2: Four Types of Management Capabilities

Four types of management capabilities support the VCI strategies in our organizations. The first three categories are supply-side factors: developing financing strategies, driving quality, and investing in strong supply chain management. The fourth category emphasizes the demand-side factor of building strong client relationships. Table 3 offers examples.

Table 3. Four Types of Necessary Management Capabilities
Management capabilities Examples
1.       Supply-side: Developing financing strategies Ubuntu Afya Kiosks: Ubuntu Afya operates medical centers in Kenya that are co-owned by communities organized into cooperative societies. The community groups develop business enterprises that yield income to cross-subsidizes the costs of providing Maternal and Neonatal Health (MNH) services. Examples of income-generating activities include soft drink depots, safe water sales, motorbike taxi services, and mobile money pay stations. The medical centers are run by clinical officers and Community Health Volunteers that have a stake in the enterprise.
2.       Supply-side: Driving quality Penda Health: Penda has developed a system whereby a mystery patient is sent to each Penda clinic every week to identify risks that may undermine the delivery of quality care. A clinic receives one demerit score per identified risk and the goal is to achieve a score under ten per month. While Penda’s clinics are run by nurses the organization has developed a Medical Advisory Board whereby physicians conduct chart review of nurses’ charts. Physicians audit ten per cent of the charts per week; where there are gaps in care, physicians provide support to the nurses to ensure clinical quality.
3.       Supply-side: Investing in strong supply chain management Lifenet: Operating in Burundi, the Democratic Republic of the Congo, and Uganda, management training comprises a key component of Lifenet’s efficiency core. By linking rural partner health centers with local and regional wholesalers, which deliver medicines directly to health centers, Lifenet has removed bottlenecks in the medical supply chain. Prior to launching the program, Lifenet discovered health center nurses were often purchasing medicines themselves: spending days traveling to the capital cities by public transportation in order to buy whatever was in stock at whatever price and quality available, before making the long return journey to their health centers.
4.       Demand-side: Building strong client relationships Operation ASHA: Patient convenience, community mobilization, and comprehensive counselling form core components of Operation ASHA’s offering. By establishing centers where there is significant foot traffic of base-of-the-pyramid consumers, Operation ASHA is able to address many of the critical demand side factors that prohibit lower-income consumers from seeking and adhering to TB treatment, such as transportation and time lost due to travelling to and from clinics.

Supply side: Develop financing strategies

A crucial stage of any value chain is the financing stage, which involves the ability of an organization to fund core operations in a scalable manner (Chandy, Hosono, Kharas, & Linn, 2013). Several of the organizations use fee-for-service models, commonly with consultation fees plus additional fees for medicines and lab services. However, fee-for-service models can face strong challenges. Jacaranda Health, which launched its operations in 2011, runs a fee-for-service model in two maternity clinics in Kenya. The CEO of Jacaranda notes: “Hospitals are high-fixed cost ventures. We still haven’t broken even. We’re almost there and we hope to do so by this December.” Beyond fee-for-service, several organizations use complementary financing models that support free or subsidized services. The following examples focus on the first step of the value chain, where developing a sustainable financing strategy is in integral component of an organization’s value chain.

Penda Health: Fee for service

Penda Health has adopted a fee-for-service model for its chain of primary care clinics in Kenya. Penda’s co-founder notes: “When we first started operations in 2012 it took us years and years to break even. Now if we set up a clinic we can break even in six to eight months.” Penda’s financing strategy involves finding a client base amongst populations that have the ability to pay, such as factory workers and university students.

Penda partners with schools and factories to drive high volumes to their clinics. For example, Penda partnered with the Management University of Africa (MUA) to support a university-sponsored capitated health insurance scheme for students and staff at MUA. The on-campus clinic at MUA caters to 800 students and staff who have employer-sponsored insurance. Penda also partnered with the Masaai Flowers Factory to provide health services to factory workers, using a post-paid model. Under this model, the factory workers do not pay out-of-pocket at the point of service. Instead, Penda invoices Masaai Flowers at the end of each month and the company deducts the healthcare costs from the employees’ pay cheques. Penda is currently expanding its post-paid model to attract other large employers.

Unjani Clinics: Social franchises

In South Africa, Unjani’s fee-based service model enables sustainability and the empowerment of black women through franchised businesses. The ownership model has a built in incentive whereby the professional nurse increases her ownership share annually, based on a franchise agreement with Imperial Health Sciences Limited. The nurse initially pays about US$790 as a commitment fee, which covers the cost of management training in areas such as marketing, standard operating procedures, bookkeeping, record keeping, IT skills, and Unjani systems. When Unjani began in 2010 the nurses were paid a full salary, as Imperial was not convinced the nurses had an appetite for financial risk (Gordon Institute for Health Sciences, 2016). Once the pilot phase was over, however, the model was structured such that as a clinic breaks even, the extra profit becomes the nurse’s salary. Imperial also provides working capital. Each Unjani clinic receives working capital of $900 a month for the first 8 months, then $600 per month for the next 8 months, and finally $300 for the next eight months. The contribution helps the clinic to set up and to build up a client base.

Ziquitza Healthcare Limited: Complementary revenue

Ziquitza Healthcare operates an ambulance service in India. Ziquitza’s business model uses a sliding price scale driven by a patient’s ability to pay, which is determined by the kind of hospital to which patients choose to be taken (public or private). Ziquitiza generates complementary revenue from private hospitals that advertise their services on Ziquitza ambulances (Center for Health Market Innovations, 2016).

Supply side: Drive quality

Driving quality refers to all nine steps of the value chain. As social enterprises expand in size, managers face challenges to maintain quality along each stage. Growth requires robust monitoring to ensure that quality control mechanisms are adhered to by each franchise or clinic.

Penda Health’s eight clinics in Kenya have systematically found ways to compete on quality. Penda has developed a system whereby a mystery patient visits each Penda clinic every week to identify risks that may undermine the delivery of quality care. A clinic receives one demerit score per identified risk – the goal is to achieve under ten demerits per month. Penda’s co-founder told us that “clinics that perform above average are given a bonus.”

In addition, Penda has created a Medical Advisory Board. Physicians who are members of the Medical Advisory Board review nurses’ charts, auditing ten percent of the charts per week. Where there are gaps in care, physicians provide the nurses with advice about clinical quality. Penda’s co-founder reports that where there is clustering of errors in a particular category, the nurses receive refresher training. Penda further surveys its clients to understand whether clients are satisfied with the care they receive at the clinic.           

Supply side: Invest in strong supply chain management

Supply chain management, step six, is a key component of value chain integration. The supply chain is focused on conveying products and services from a beginning point to an end point. Supply chain management involves bulk storage and transportation (Feller, Shunk, & Callarman, 2006).

Healthy Entrepreneurs

Health Entrepreneurs deploys a last-mile distribution model to deliver affordable and reliable health products and services to the poorest families in rural areas. Healthy Entrepreneurs has created its own end-to-end distribution chains. Through a network of trained micro-entrepreneurs who operate pharmacies and health facilities, the organization manages an end-to-end value chain of reliable products and practical health information. In order to prevent stock outs, Healthy Entrepreneurs delivers products directly to the entrepreneurs via local depots (Center for Health Market Innovations, 2016).

Lifenet International

By linking rural partner health centers with local and regional wholesalers that deliver medicines directly to the centers, Lifenet has removed bottlenecks in the medical supply chain. Prior to launching the program, nurses were often purchasing medicines themselves: spending days traveling to cities by public transportation in order to buy whatever was in stock at whatever price and quality available, before making the long return journey to their health centers. By developing supplier relationships with local and regional wholesalers, Lifenet’s health centers avoid stock-outs, manage debt, and are financially viable, ensuring their sustainability.

Demand side: Build strong client relationships

While healthcare organizations face temptations to focus on supply side factors, the last stage of a social enterprises’ value chain is often the delivery of a healthcare service. Research reveals that simply providing a needed health service often is not enough (Wong et al., 2014). Koh, Hedge, & Karamchandani (2014) note that some markets offer “pull” products, which most target customers readily demand, such as microfinance loans to credit-starved households at much lower interest rates than money lenders.

In contrast, health is commonly a “push” product. Consumers “do not readily perceive the need for these [push] products as they are unaware of the problem, solution, or both. Often, even if they are aware of the problem, they are unable to easily try out the new solution to understand its value proposition, leading them to make do with established, inferior solutions” (Koh et al., 2014: 23). For social enterprises providing health services to lower-income populations, addressing the last stage of the value chain, which centers on the demand side, is key to driving scale and viability.

North Star

While North Star establishes its container clinics along the transport corridor, interviews with managers, clinic staff, and clients revealed that despite the proximity of the clinics to the truck-stop parking lots, it was often difficult for drivers to leave their trucks in order to seek care. A truck driver parked at the border of Kenya and Tanzania told us: “If my turn boy [assistant] is not here and I leave, in 15 minutes some of my fuel is taken and cargo stolen.” Another truck driver told us: “We are tracked by GPS by our companies. If I go off one road, we get a call from the company.”

Recognizing the difficulty for truck drivers to access its clinics, North Star developed an outreach strategy. Each week, HIV testing counsellors visit truck drivers during their breaks or while they park overnight at a border crossing. A HIV testing counsellor in Salgaa, Kenya notes: “most of the time we need to do outreach and do HIV tests in the truck drivers’ cabins. Most of them will not come to the clinic.” North Star notes that its clinic teams along the transportation corridors must conduct regular behaviour change and communication sessions in nearby communities in order to meet their target volumes, typically aiming for 25-30 clients per day per clinic.

Operation ASHA

By establishing tuberculosis clinics where there is significant foot traffic by base of the pyramid consumers, Operation ASHA address many of the critical demand side factors that prohibit people from seeking and adhering to TB treatment, such as transportation and time travelling to and from clinics. Patient convenience, community mobilization, and comprehensive counselling form core elements of Operation ASHA’s services (Center for Health Market Innovations, 2016). Providing convenience for customers in accessing TB treatment is a crucial aspect of Operation ASHA’s model given that promoting adherence to TB is often challenging (Makanjuola, Taddese and Booth, 2016).

These two examples highlight the point that, for social enterprises targeting lower-income consumers, it is often necessary to adjust offering to meet patient demand in order to achieve goals of the last stage of the value chain, which focuses on the delivery of a health product or service. The Operation Asha example illustrates how adapting services to the needs and interests of local populations is critical for scaling success. The North Star case emphasizes that targeting different types of mobile populations from truck drivers and sex workers requires understanding local realities and constraints.

Despite the successes, health services organizations also face major issues with VCI strategies. Below we discuss cases from our sample in which organizations confronted scaling challenges.

Pitfalls in Value Chain Integration

Failure to create effective partnerships for key resources can constrain an organization’s expansion goals.

Penda Health

In Kenya, Penda sought to expand its presence in Machakos, near Nairobi. While factories in the area were keen to have Penda offer its services to their employees, the partnerships fell through because Penda could not find an appropriate location for a clinic. Penda told us: “…we thought we had secured the perfect location for partnering with many of the factories in that area, but illegal actions by the landlords there caught us off-guard and, after a protracted struggle, we withdrew from this location.” Penda further noted: “We learned that finding a location, is very, very hard, so you should start with a location and then find the community partners nearby. Or, have the community partner give you space.” This example illustrates how external actors can undermine expansion efforts. Penda secured a partnership to attract a paying clientele, but was unable to realize the gains from this partnership because it could not identify partners at another stage of its value chain, procuring real estate.

North Star

Attracting paying clients forms a key value chain stage for most of our cases. In Kenya, North Star Alliance learned it is not always possible to exploit revenue-generating opportunities due to scale barriers that lie outside the boundaries of the organization. North Star has developed partnerships with several transport companies, many of which were willing to provide contracts for North Star to conduct annual medical check-ups for their long-haul truck drivers. A manager from Roy Hauliers, which manages a fleet of 250 long-haul truck drivers, told us: “we wanted to give North Star this business so they could do the medical check-ups of our drivers.” North Star was keen to take advantage of the opportunity. However, its clinics are staffed by clinical officers or nurses, but the Ministry of Health guidelines stipulated that check-ups require a doctor. The inability to manage regulatory barriers in North Star’s ecosystem limited its ability to create an alternative revenue stream.

Conclusion

This study offers suggestive analysis of how private sector ventures that target the base of the pyramid in health services delivery use value chain integration strategy. We argue that adopting VCI strategy combined with enabling strategies of an efficiency core and four types of management capabilities helps social enterprises increase their scale.

The ability of health services organizations to draw resources from disparate partnerships with government and private sector actors along different stages of their value chains is central to scaling success. Partnerships along a venture’s value chain are critical precisely because many of the scale barriers lie outside the boundaries of social enterprises. Our research emphasizes why VCI strategy and the enabling strategies of efficiency core and management skills matter for scaling health services delivery to the base of the pyramid.

The study has limitations that require additional research. Our sample is relevant, but small. We omit some value chain partnerships that we were not able to derive from published data and interviews.  Further research comparing organizations that adopted a VCI strategy to those that did not would yield valuable insights. Moreover, inquiry is needed on how social enterprises coordinate their value chain partnerships.

The study offers insights on how social enterprises pursue value chain integration. By using VCI strategy as a practical framework, our research illustrates how and why the broader ecosystem matters for scaling success. The core point is that partners not directly involved in an organization’s core mission can advance or thwart long term success. Hence, global health organizations need to pay close attention to value chain integration strategy and its enabling activities.


References

  1. Acumen Fund. Ziquitza Healthcare Limited. https://www.healthyentrepreneurs.nl/our-concept/. Accessed August 10, 2017.
  2. Adner R. Match your innovation strategy to your innovation ecosystem. Harvard Business Review. 2006;84(4):98-107;148.
  3. Bhattacharyya O, Khor S, McGahan A, Dunne D, Daar A, Singer P. Innovative health services delivery models in low-and-middle-income countries: what can we learn from the private sector? Health Research Policy and Systems. 2010;8(24):1-11.
  4. Stanford Graduate School of Business. Riders for Health: Prospective Trial Results from Southern Province Zambia. https://www.gsb.stanford.edu/sites/gsb/files/files-fpp/22766/research-briefing-riders-for-health.pdf. Published October 2014. Accessed January 15, 2018.
  5. Capron L, Mitchell W. (2013). Build, borrow, or buy: Solving the growth dilemma: Boston, MA; Harvard Business Press: 2012.
  6. Chandy L, Hosono A, Kharas H, Linn J. Getting to scale: how to bring development solutions to millions of poor people. Washington, D.C.; Brookings Institution Press: 2013.
  7. Cooley L, Kohl R. Management Systems International. Scaling up from vision to large scale change: a management framework for practitioners. http://www.msiworldwide.com/wp-content/uploads/MSI-Scaling-Up-Framework-2nd-Edition.pdf. 2012.
  8. Feller A, Shunk D, Callarman T. Value chains versus supply chains. http://www.stephbti.ac.in/notes/33171-value-chain-vs-supply-chain.pdf. BPTrends. March 2006.
  9. Hassey K, Kassalow JS. Stanford Social Innovation Review. VisionSpring Aims to Provide Eyeglasses to Millions. Stanford Social Innovation Review. https://ssir.org/articles/entry/visionspring_aims_to_provide_eyeglasses_to_millions. Published May 29, 2014. Accessed January 1, 2018.
  10. Healthy Entrepreneurs. Our Concept. https://www.healthyentrepreneurs.nl/our-concept/. Accessed October 16, 2017.
  11. Healthy Entrepreneurs. Healthy Entrepreneurs. http://healthmarketinnovations.org/program/healthy-entrepreneurs. Accessed on October 20, 2017.
  12. Health Innovations. 3 Lessons from Partnering with Factories in Kenya. http://www.pendahealth.com/index.php/component/easyblog/entry/3-lessons-from-partnering-with-factories-in-kenya?Itemid=435. Accessed July 15, 2017.
  13. Jacaranda Health. Jacaranda’s Model.https://jacarandahealth.org/maternity-in-east-africa/jacarandas-model/. Accessed on July 10, 2017.
  14. Kim JY, Farmer P, and Porter ME. Redefining global health-care delivery. Lancet. 2013;382:1060-1069.
  15. Koh H, Hedge N, Karamchandani A. The Rockefeller Foundation. Beyond the Pioneer: Getting Inclusive Industries to Scale. https://assets.rockefellerfoundation.org/app/uploads/20140508153451/Beyond-the-Pioneer-Report.pdf. Published April 2014. Accessed Janaury 1, 2018.
  16. Kramer MR, Pfitzer MW. The ecosystem of shared value. Harvard Business Review. 2016;94(10):80-89.
  17. Lifenet International. The Model. http://www.lninternational.org/what-we-do/model/. Accessed from July 10, 2017.
  18. Makanjuola T, Taddese HB, Booth A. Factors Associated with Adherence to Treatment with Isoniazid for the Prevention of Tuberculosis amongst People Living with HIV/AIDS: A Systematic Review of Qualitative Data. PLoS One. 2014;9(2): e87166.
  19. Mangham LJ, Hanson K. Scaling up in international health: what are the key issues? Health Policy and Planning. 2010;25(2):85-96.
  20. Mitchell W. Why Apple’s product magic continues to amaze–skills of the world’s# 1 value chain integrator. Strategy & Leadership. 2014;42(6):17-28.
  21. Operation Asha. Tubercolosis. http://www.opasha.org/our-work/our-operation/. Accessed July 13, 2017.
  22. Porter ME. Competitive advantage: creating and sustaining superior performance. New York, NY: FreePress; 1985.
  23. Porter ME, Teisberg EO. Redefining health care: creating value-based competition on results. Boston, MA: Harvard Business School Press; 2006.
  24. Simmons R, Fajans P, Ghiron L (Eds.). Scaling up health services delivery: from pilot innovations to policies and programmes. Geneva: World Health Organization; 2009.
  25. Sutherland M, Krige K. .Unjani “clinics in a container”: social franchising in South Africa. Emerald Emerging Markets Case Studies. 2017. https://doi.org/10.1108/EEMCS-06-2016-0151.
  26. Unjani Clinics. Unjani Clincs. http://healthmarketinnovations.org/program/unjani-clinics. Accessed September 20, 2017.
  27. VisionSpring. VisionSpring’s Distribution Channels. http://visionspring.org/distribution-channels/. Accessed September 13, 2017.
  28. Wong J, Zlotkin S, Ho C, Perumal N. Stanford Social Innovation Review. Replicating Parts, not the Whole to Scale. Stanford Social Innovation Review. https://ssir.org/articles/entry/replicating_parts_not_the_whole_to_scale. Published August 7, 2014. Accessed January 1, 2018.
  29. Yamey G. What are the barriers to scaling up health interventions in low and middle income countries? A qualitative study of academic leaders in implementation science. Globalization and Health. 2012;8(11).

Websites

  1. Acumen Fund. (2017, August 10). Ziquitza Healthcare Limited. Retrieved from: https://www.healthyentrepreneurs.nl/our-concept/
  2. Healthy Entrepreneurs. (2017, October 16). Our Concept. Retrieved from: https://www.healthyentrepreneurs.nl/our-concept/
  3. Health Entrepreneurs. (2017, October 20). Healthy Entrepreneurs. Retrieved from: http://healthmarketinnovations.org/program/healthy-entrepreneurs
  4. Health Innovations. (2017, July 15). 3 Lessons from Partnering with Factories in Kenya. Retrieved from: http://www.pendahealth.com/index.php/component/easyblog/entry/3-lessons-from-partnering-with-factories-in-kenya?Itemid=435
  5. Jacaranda Health. (2017, July 10). Jacaranda’s Model. Retrieved from: https://jacarandahealth.org/maternity-in-east-africa/jacarandas-model/
  6. Lifenet International. (2017, July 10). The Model. Retrieved from: http://www.lninternational.org/what-we-do/model/
  7. Operation Asha. (2017, July 13). Tubercolosis. Retrieved from: http://www.opasha.org/our-work/our-operation/
  8. Unjani Clinics. (2017, September 20). Unjani Clincs. Retreived from: http://healthmarketinnovations.org/program/unjani-clinics
  9. VisionSpring. (2017, September 13). VisionSpring’s Distribution Channels. Retrieved from: http://visionspring.org/distribution-channels/


Provider Satisfaction with Telehealth: Exploring Variation Across Structural and Demographic Factors

Sumate Permwonguswa, Assumption University, Thailand; Chadi Hajar, Paul Cook, Breanna Wong, Megan Mccarthy, Jiban Khuntia, Errol Biggs, University of Colorado Denver

Contact: Sumate Permwonguswa, Sumateprm@msme.au.edu

Abstract

What is the message?

Empowerment and satisfaction of physicians are two key challenges to telehealth adoption. The survey found that telehealth is most empowering and satisfying for hospital-based providers, particularly in urban settings. Satisfaction varies with several demographic factors including gender, structural distance, and age.

What is the evidence?

Survey of 31 respondents from hospitals, providers, clinics, and physician offices in the Denver area.

Submitted: December 18, 2017. Accepted after review: March 6, 2018

Cite as: Sumate Permwonguswa, Chadi Hajar, Paul Cook, Breanna Wong, Megan Mccarthy, Jiban Khuntia, Errol Biggs. Provider Empowerment and Satisfaction with Telehealth: Exploring Variation across Structural and Demographic Factors. Health Management Policy and Innovation, Volume 3, Issue 1.

Introduction

The lack of timely access to care is a constant criticism of healthcare in the United States and other countries.1, 2 For example, often a patient may be admitted to an emergency unit and needs to be seen by his or her primary care physician but the physician may not be available. Similarly, a psychiatrist may be too busy to attend to a patient when he or she has had a traumatic experience or a panic attack. Beyond these examples, there are significant populations living in rural areas which lack convenient access to healthcare.

Critically, in the current healthcare models, doctors often do not feel that they are participative or a key element of the patient’s treatment process, unless it is invoked through the institutional models. 3, 4 For instance, a patient may be seen by any doctor in a hospital or any specialist in a clinic, as needed by the common procedure terminology based diagnosis or a disease identification process. The concept of doctors who wish to “treat my own patient”, or patients to feel as though “I need to see my own doctor” is often diluted in current healthcare institutional models.

Telehealth is emerging as a plausible solution to some of the access issues in the current healthcare system. Telehealth refers to remote clinical services provided to patients by physicians or health providers through telecommunication technology (i.e., video chat, telephone), which may or may not involve medical intervention. 5 Telehealth gives health care providers the capability to assess, diagnose, and treat patients in remote locations.

Market wise, significant growth in the telehealth industry is predicted in the next few years. The use of telecommunication technology enables patients in remote locations to receive care and medical expertise efficiently, in real time, and without travel. Broadly, telehealth is evolving as a critical component of the healthcare crisis solution, and has the potential to remarkably impact various problems within our current healthcare system: access to care, cost-effective delivery, and distribution of limited providers.

Irrespective of the perceived potential for telehealth in healthcare delivery, widespread adoption is still lacking. Only 42% of hospitals in the United States have adopted telehealth; most of them are teaching hospitals and are members of a larger health system. 6 Some suggest that factors such as reimbursement and license issues are reasons for lack of adoption, while others allude to the issues relevant to providers use, expected results, and social influence. 7, 8 Amongst other challenges, clinicians’ acceptance and promoting engagement in health maintenance and health care in a telehealth-enabled environment have been touted as major challenges for widespread adoption of telehealth by providers. 9, 10

Understanding when clinicians accept or do not accept telehealth is a particularly important issue. It is important to explore whether providers believe that telehealth is helping them in any significant manner. Motivated providers can lead and influence others to use telehealth.

This study considers provider empowerment and satisfaction in order to explore telehealth adoption, and explores how these two factors vary across structural context (e.g., hospital vs. non-hospital including clinics and office), hospital settings (urban vs. rural), the structural distance of the doctor/provider in the organization, and the providers’ demographics (e.g., age and gender). Section 2 provides the theoretical approach to the study.  Section 3 provides details on the survey conducted. Section 4 provides the results; the core finding is that telehealth is most empowering and satisfying for hospital-based providers, particularly in urban settings, while satisfaction varies with several demographic factors including gender, structural distance, and age. Section 5 concludes with insights from the study.

Provider Empowerment and Satisfaction in Telehealth Context

Empowerment, as a broad concept, refers to a process by which individuals, groups, or organizations gain control over matters that are of interest to them. 11 Researchers have suggested that empowerment is effective in dealing with job- or work-related outcomes,12 improving employee satisfaction, 13 and providing discretion over work for those who feel powerless. 14 Hence, doctor empowerment is a capacity-building process either in the self-practice or in the practicing hospital.  Empowered doctors would take more responsibilities, and would have greater influence and control over their patients’ health management process.

Studies suggest that doctor satisfaction is related to quality of care 15, 16 and patient satisfaction. 17 Doctor satisfaction refers to the physician’s feeling in terms of satisfaction in their practice. 16 When a doctor is dissatisfied with the practice, the quality of care from that doctor can deteriorate and he or she is likely to miss appointments and affect patient satisfaction. 18

The relevance of provider empowerment and satisfaction in the telehealth context stems from two sources. First, telehealth helps healthcare providers reduce costs while increasing quality of care. 5 Patients can be taken care of more efficiently using telehealth. For example, patients can stay home, avoiding the waste of time spent on a long-distance commute. Second, if providers do not feel satisfied, they are less comfortable using telehealth to diagnose and treat their patients.15 Thus, provider empowerment is an essential point in the loop of patient care through telehealth.

We expect that the feeling of empowerment and satisfaction will vary across different contextual and demographic factors. We noted key contextual factors above. We focus on the issues of hospital and non-hospital (clinic, office) setting, urban and rural setting, the structural distance of the doctor/provider in the organization, and the providers’ demographics (age and gender).

Telehealth demand and support in the hospital vs. non-hospital setting vary. Use of telehealth in a hospital itself may be supported by a set of staff, and may have other support services. Such support may not be available in a physician’s office or independent clinic. However, hospitals may have other criteria such as scheduling the equipment beforehand, or dependency on other departments to use the telehealth equipment. A physician’s office or clinic may be more independent while making telehealth use decisions. A doctor may have to be in a situation to simply switch on the equipment and begin talking to a patient in the office. However, in an office environment, the use of telehealth may not be warranted, unless the office or clinic is operating with a set of other providers as a part of the network.

A widely discussed value proposition for telehealth use is for remote settings in rural areas.  However, contrary to this foreseen opportunity, telehealth is not being adopted as rapidly as anticipated in rural areas. 19 Possible reasons may be the sustenance of the telehealth equipment, support, or availability of required bandwidth. On the contrary, these issues are well taken care of in an urban setting. In addition, telehealth has high potential to reduce patient travel, bridging the care gap across two urban locations and availability of resources to remote locations in odd hours (e.g., a psychiatrist connecting to a remote location from a main hospital during the night for a suicidal case). Thus, it is imperative to explore the differences in empowerment and satisfaction across urban and rural areas.

A third factor we explore is the position of the doctor in the organization, and we coin this as the ‘structural distance’. Existing literature suggests that structural distance influences decision-making and independence in practice. 20, 21 Higher distance might suggest lack of  support or lack of team work; but it also suggests that the doctor’s position in the care delivery setting is quite unique and independent. 20 Decisions taken in an independent and unique position in care delivery influences the feeling of ‘ownership’ or ‘responsibility’ for the patients. In other words, higher structural distance and subsequent independence in care delivery is an aspect of feeling that ‘I am treating my own patient’—and thus, is expected to influence empowerment and satisfaction better than doctors with lower structural distance in their respective organizations.

Finally, as suggested in literature, the scope of self-efficacy regarding any health information technology use is dependent on the demographic factors. We expect this to be consistent regarding empowerment and satisfaction with telemedicine, and thus, explore how it varies across male and female providers, and across different age groups.

Survey and Analysis

We used a primary data collection method, and existing construct operationalization from prior studies. The items were adapted to the context of this study. In the questionnaire, all the items are measured on a seven-point Likert scale, except the age, gender, and contextual questions.

The key variables–empowerment and satisfaction–were measured using three and five measurement items respectively. These measurement items were used in prior literature and have been proven for reliability and construct validity.22, 23, 24, 25 Similarly, the structural distance orientation was measured using five items that were used and verified for reliability and validity in prior literature. 20

We developed our sample frame by exploring hospitals, providers, clinics and physician offices in the Denver area. Usable data was collected from 31 respondents using telehealth in their healthcare organizations.

The analysis mainly consists of t-test comparisons and ANOVA for empowerment and satisfaction measures across other variables. We present the results both empirically and graphically in figures 1 and 2. Our key findings are summarized and discussed in the next section.

Figure 1: Comparisons of Empowerment and Satisfaction with Telehealth amongst Different Factors


Figure 2: Empowerment and Satisfaction of Telehealth Providers Differentiated by Age


Discussion

First, we found that hospital-based use of telehealth is highly empowering and satisfying for providers (Figure 1 exhibit a). Plausibly, providers and doctors in a hospital setting do not have to pull the equipment and plug it in. They have a support system and other infrastructure which lead to a better appreciation of the utility of telehealth compared to non-hospital based providers in an office or clinic setting.

Second, by urban-rural setting differentiation, we found that urban area users have higher empowerment and satisfaction scores than rural providers (Figure 1 exhibit b). Possibly, as noted earlier, rural providers are still not leveraging much from telehealth, regardless of the widely-hyped potential in telehealth for rural populations. In addition, rural providers may have concerns, issues and challenges such as bandwidth and internet access round the clock for telehealth use. However, urban providers can better appreciate the value proposition of telehealth, leading to higher empowerment and satisfaction scores. Undoubtedly, more than the ‘remote access’ value proposition of the telehealth, the ‘just-in-time’ or ‘just-in-place’ care delivery provisions through telehealth are becoming highly beneficial to urban doctors.

Several demographic factors are relevant. Males feel better about telehealth use (Figure 1 exhibit c).  This may be related to the self-efficacy variations with technology use suggested in early literature. 22 Providers with higher structural distance are more empowered and satisfied with telehealth (Figure 1 exhibit d). Finally, the age group of 41-50 is more empowered and satisfied with telehealth use (Figure 2).  This could be explained by differences that come with age and years of experience such as an increased satisfaction and desire to treat patients just-in-time or increased independence. Overall, providers with more independence are enjoying telehealth more.

An explanation for the age effect could be that with higher age and experience, perhaps the satisfaction or feeling to treat a patient just-in-time is higher.  This means lone-wolves are enjoying telehealth more. Obviously, independence and uniqueness in practice is a solid explanation for this finding.

In conclusion, empowerment and satisfaction are two key challenges to telehealth adoption.  Variance across these two dimensions may help explain the variance in telehealth adoption. Our study establishes and demonstrated this variance across hospital settings, demographics and structural distance of providers. Future studies may explore the nuanced impact of these variations on telehealth adoption and performance.

References

  1. Currie, W. L. 2009. Integrating Healthcare. W.L. Currie and D. Finnegan (eds.). Integrating Healthcare with Information and Communications Technology. Oxford: Radcliffe Publishing; 2009:3-34.
  2. Mays GP, Smith SA, Ingram RC, Racster LJ, Lamberth CD, Lovely ES. Public Health Delivery Systems: Evidence, Uncertainty, and Emerging Research Needs. American Journal of Preventive Medicine. 2009;36(3):256-265.
  3. Marmor T, Oberlander J, White J. The Obama Administration’s Options for Health Care Cost Control: Hope Versus Reality. Annals of Internal Medicine 2009;150(7):485-489.
  4. Romanow D, Cho S, Straub DW. Riding the Wave: Past Trends and Future Directions for Health It Research. MIS Quarterly. 2012;36(3):iii-x.
  5. McLean S, Protti D, Sheikh A. Telehealthcare for Long Term Conditions. British Medical Journal. 2011;342:d120.
  6. Kahn JM. 2015. Virtual visits—confronting the challenges of telemedicine. New England Journal of Medicine. 2015;372(18):1684-1685.
  7. Kruse CS, Karem P, Shifflett K, Vegi L, Ravi K, Brooks M. Evaluating Barriers to Adopting Telemedicine Worldwide: A Systematic Review. Journal of Telemedicine and Telecare. 2016;24(1):4-12.
  8. Lim JH, Stratopoulos TC, Wirjanto TS. Sustainability of a Firm’s Reputation for Information Technology Capability: The Role of Senior It Executives. Journal of Management Information Systems. 2013;30(1):57-96.
  9. Bartz CC, Hardiker N. Promoting Engagement in Health Maintenance and Health Care in a Telehealth-Enabled Environment. W. O’Donohue, L. James and C. Snipes (eds.). Practical Strategies and Tools to Promote Treatment Engagement. Cham: Springer International Publishing; 2017:91-104.
  10. Wade VA, Eliott JA, Hiller JE. Clinician Acceptance Is the Key Factor for Sustainable Telehealth Services. Qualitative Health Research. 2014;24(5):682-694.
  11. Zimmerman, M. Psychological Empowerment: Issues and Illustrations. American Journal of Community Psychology. 1995;23(5):581-599.
  12. Liao H, Toya K, Lepak DP, Hong Y. Do They See Eye to Eye? Management and Employee Perspectives of High-Performance Work Systems and Influence Processes on Service Quality. Journal of Applied Psychology. 2009;94(2):371.
  13. Hui MK, Au K, Fock H. Empowerment Effects across Cultures. Journal of International Business Studies. 2004;35(1):46-60.
  14. Kelley SW, Longfellow T, Malehorn J. Organizational Determinants of Service Employees’ Exercise of Routine, Creative, and Deviant Discretion. Journal of Retailing. 1996;72(2):135-157.
  15. Allen T, Whittaker W, Sutton M. Does the Proportion of Pay Linked to Performance Affect the Job Satisfaction of General Practitioners?. Social Science & Medicine. 2017;173:9-17.
  16. Richardson JE, Kern LM, Silver M, Jung HY, Kaushal R. Physician Satisfaction in Practices That Transformed into Patient-Centered Medical Homes: A Statewide Study in New York. American Journal of Medical Quality. 2016;31(4):331-336.
  17. Haas JS, Cook EF, Puopolo AL, Burstin HR, Cleary PD, Brennan TA. Is the Professional Satisfaction of General Internists Associated with Patient Satisfaction?. Journal of General Internal Medicine. 2000;15(2):122-128.
  18. DiMatteo MR, Sherbourne CD, Hays RD, Ordway L, Kravitz RL, McGlynn EA, et al. Physicians’ Characteristics Influence Patients’ Adherence to Medical Treatment: Results from the Medical Outcomes Study. Health Psychology 1993;12(2):93.
  19. Martin AB, Probst JC, Shah K, Chen Z, Garr D. Differences in Readiness between Rural Hospitals and Primary Care Providers for Telemedicine Adoption and Implementation: Findings from a Statewide Telemedicine Survey. The Journal of Rural Health. 2012;28(1):8-15.
  20. Avolio BJ, Zhu W, Koh W, Bhatia P. Transformational Leadership and Organizational Commitment: Mediating Role of Psychological Empowerment and Moderating Role of Structural Distance. Journal of Organizational Behavior. 2004;25(8):951-968.
  21. Liu SM, Liao JQ. Transformational Leadership and Speaking Up: Power Distance and Structural Distance as Moderators. Social Behavior and Personality: An International Journal. 2013;41(10):1747-1756.
  22. Deng X, Khuntia J, Ghosh K. Psychological Empowerment of Patients with Chronic Diseases: The Role of Digital Integration. Paper presented at: The 34th International Conference on Information Systems; 2013; Milan, Italy. http://aisel.aisnet.org/cgi/viewcontent.cgi?article=1051&context=icis2013. Accessed September 15, 2017.
  23. Estrada CA, Isen AM, Young MJ. Positive Affect Improves Creative Problem Solving and Influences Reported Source of Practice Satisfaction in Physicians. Motivation and Emotion. 1994;18(4):285-299.
  24. Hadley J, Mitchell JM, Sulmasy DP, Bloche MG. Perceived Financial Incentives, HMO Market Penetration, and Physicians’ Practice Styles and Satisfaction. Health Services Research. 1999;34(1):307-321.
  25. Linzer M, Konrad TR, Douglas J, McMurray JE, Pathman DE, Williams ES, et al. Managed Care, Time Pressure, and Physician Job Satisfaction: Results from the Physician Worklife Study. Journal of General Internal Medicine 2000;15(7):441-450.