Stephen Salant, University of Michigan
Contact: ssalant@umich.edu
Abstract
What is the message? Prices of brand-name pharmaceuticals in the United States exceed prices that governments in other countries have negotiated for the same drugs, which in turn exceed their marginal production costs. Meanwhile, drug manufacturers spend millions of dollars warning American consumers that prescription drugs imported from other high-income countries are unsafe. Such safety warnings are unjustified. They deter personal arbitrage and enlarge the differential between drug prices at home and abroad.
What is the evidence? Random sampling of pharmaceuticals imported online from pharmacies registered in other high-income countries confirms their safety. The relatively small fraction of Americans taking advantage of the enormous savings such imports would provide is evidence of the deterrence effect of such safety warnings.
Timeline: Submitted: Submitted: June 10, 2023; accepted after review Sept. 1, 2023.
Cite as: Stephen Salant. 2023. Arbitrage Deterrence: A Theory of International Drug Pricing. Health Management, Policy and Innovation (www.HMPI.org), Volume 8, Issue 2.
Introduction
Four prominent features of the international pharmaceutical market are widely recognized: (1) Americans pay much more than Europeans and others for the same brand-name drugs; (2) drug prices abroad result from bargaining between drug manufacturers and foreign governments; (3) even the lower foreign prices vastly exceed the marginal costs of production; and (4) drug manufacturers spend millions of dollars warning consumers that imported prescription drugs are unsafe. We discuss each of these stylized facts in turn. The first three require little discussion.
First, the domestic price of specific pharmaceuticals strictly exceeds the foreign price. According to a RAND study (Mulcahy et al. 2021), the average price of brand-name drugs in the United States is approximately 3.5 times the average price of those same drugs abroad. Even when the secret rebates and discounts manufacturers routinely offer their customers are taken into account, domestic prices are considerably higher than their foreign counterparts (House Ways and Means Committee Staff 2019).
Second, other high-income countries negotiate with manufacturers over the prices they charge. As the Council of Economic Advisers (2018) notes, “Most OECD nations employ price controls in an attempt to constrain the cost of novel biopharmaceutical products, e.g. through cost-effectiveness or reference pricing policies.”
Third, even the lower prices in Canada and Western Europe are far higher than the marginal cost of production—sometimes hundreds of times larger. For example, no price in Western Europe for a 12-week course of Sovaldi, one of several drugs to treat the hepatitis C virus (HCV), is below $40,000. And yet “a recent study estimated the cost of production of sofosbuvir [Sovaldi] to be U.S. $68-$136 for a 12-week course of treatment based on the same manufacturing methods used in the large-scale generic production of HIV/AIDS medicines (Hill et al. 2014), and its findings have not been challenged” (Iyengar et al. 2016). Other direct action antiviral (DAA) treatments for HCV (Epclusa, Harvoni, Mavyret, etc.) have similar costs of production (Hill et al. 2014).
The fourth stylized fact requires more discussion. Through their trade organization (the Pharmaceutical Research and Manufacturers of America, or PhRMA) and through “non-profit” organizations such as Partnership for Safe Medicines (PSM) which misleadingly appear to be independent, drug companies have spent millions of dollars warning that imported pharmaceuticals are dangerous because they may be counterfeits. Counterfeit pharmaceuticals are undeniably dangerous. But the actions of the manufacturers and PhRMA, often taken by the “independent” organizations they fund, make clear that consumer protection is a pretext; the real goal of the manufacturers is to protect the lucrative U.S. market from arbitrageurs acquiring the same goods from other high-income countries at a fraction of the price. Raising doubts about the safety of imported drugs follows a plan developed by a PR firm, Edelman, which PhRMA had retained. According to the Wall Street Journal (WSJ 2003), Edelman concluded on the basis of focus groups of people without drug-insurance coverage that safety, not legality, was their central concern when deciding whether to import their prescription drugs to save money. In response, PhRMA paid their “independent” organizations millions of dollars to publicize the dangers of drug importation. For example, according to Bloomberg (2019), PSM received $7.3 million in 2019 alone for this purpose. One such organization was the consulting firm of the former FBI Director Louis Freeh. Freeh reported that imports would “open a new, unregulated pipeline into the United States” despite the fact that none of the 16 states then proposing drug importation plans would have allowed imports from unregulated online pharmacies.1 Another such organization was the National Sheriffs Association. Basing their conclusions on Freeh’s report, sheriffs began appearing in hundreds of ads in the summer of 2019 imploring “the country’s leaders to reject proposals to import cheaper prescription drugs from other countries.” Robocalls in Florida even denounced a proposed state law claiming (without the slightest basis) that it “would legalize importing prescription drugs from China, which has a long history of producing counterfeit medications. . . ” As the Republican state representative who introduced Florida’s drug importation bill noted, it was “a good, old-fashioned scare campaign. Their real fear is this could have a significant impact on the profit margins of drug companies.”
In fact, importation from Canada will have only a minor effect on the profitability of the U.S. market since the population of Canada is 11.5% that of the United States. But the combined population of the other high-income countries with tightly regulated prescription drug markets is comparable to our own, and drug imports from them would devastate the drug companies’ most lucrative market. Such imports could be purchased by prescription holders themselves online or, in the rare circumstances when travel is feasible, in person.
Alternatively, prescription drugs could be imported by large commercial enterprises like Amazon, Costco, Sam’s Club, CVS, Walgreens, Rite Aid and sold to holders of prescriptions in person or online. All of these enterprises currently sell in the U.S. online (as well as in person). There is no reason to think importation from regulated outlets licensed in high-income countries are less safe than prescription drugs purchased in the U.S. As Michael Law, holder of the Canada Research Chair in Access to Medicines dryly observed: “People aren’t dying in the streets of Canada from unsafe medications” (Bloomberg 2019). They aren’t dying in the streets of the U.K., France, Germany, Switzerland, Australia, New Zealand, and Japan, either. In reality, the FDA has never reported a death or adverse reaction suffered by any patient in the U.S. who has personally filled his valid prescription online or in person from a pharmacy licensed in another high-income country.
Finally, if drug manufacturers were genuinely concerned about the safety of imports, they would not have sought to eradicate an organization like PharmacyChecker.com, whose mission includes protecting consumers from counterfeit drugs by identifying pharmacies licensed in high-income countries from which they can safely fill their prescriptions at a lower cost.2 Groups like PSM would instead either have financially supported such private certification organizations or would have advocated that their role be taken over by a government agency like the FDA.3 In summary, the fourth stylized fact is that drug manufacturers annually spend millions of dollars blurring the distinction between dangerous counterfeit drugs and safe drugs sold by pharmacies licensed in other high-income countries.4
Every model previously proposed to analyze the international drug market is inconsistent with at least one prominent feature of this market. For instance, Berndt (2002, 2007), Danzon (1997) and others regard the international pharmaceutical market as an example of third-degree price discrimination (Robinson 1933). While this model predicts prices in the two markets will differ, with the lower price exceeding the marginal cost of production, it assumes that prices in the foreign market are set by the monopolist without any negotiation.5 Moreover, these models of price discrimination ignore the massive investments manufacturers make in order to deter arbitrage. Hence, these models violate stylized facts (2) and (4).
Pecorino (2002) was the first to recognize that the foreign price is the result of bargaining. He assumes that a single manufacturer sells in the U.S. market at the monopoly price and in the foreign market at a price determined by the Nash bargaining model. Pecorino considers a regime where there is neither actual nor threatened arbitrage. Hence, there is no linkage between the two markets. The manufacturer always sells at the monopoly price in the U.S. If the foreign government has some bargaining power, the manufacturer sells at a strictly lower, negotiated price in the foreign market; unless the foreign government has all the bargaining power, the negotiated foreign price will exceed the constant marginal cost of production. Thus, Pecorino’s model is consistent with the first three stylized facts. However, it cannot explain stylized fact (4). Why spend millions of dollars to deter imports if there is no threat of imports?
Like Pecorino (2002), Egan and Philipson (2013) envision government bargaining down prices. They emphasize that paying for R&D through drug prices is costly to each country but the innovations that may result benefit all countries. Hence, there is a public goods problem and free-riding limits aggregate spending on R&D: “a small European country has no access-innovation trade-off in its pricing; it will have low reimbursements because it does not affect world returns and sees the same innovations regardless of its reimbursement policy.” Hence, it will bargain the price down close to the marginal cost of production: “the smaller the share of world demand and supply a country makes up, the less that government will mark up prices above cost to promote innovation.” Egan and Philipson’s theory takes no account of firm behavior. In neglecting firm behavior, they imply that firms will accept any price—as long as it is above their short-run marginal cost.
Egan and Philipson also take no account of arbitrageur behavior. Since the implied price differentials under their theory may be enormous, they presumably assume that arbitrage can never occur regardless of prices. In that case, there should be no spending by firms to raise the cost of consumer arbitrage. Thus, their theory violates stylized facts (3) and (4).
Like Egan and Philipson (2013), the Council of Economic Advisors (2018) discusses a case where the manufacturers and foreign governments negotiate over the foreign price but again there is no threat of arbitrage. Unlike Pecorino (2002), the Council assumes the foreign government faces \(n \geq 1\) manufacturers and has all the bargaining power; it is as if the government simultaneously proposes a price to these \(n\) manufacturers on a take-it-or-leave basis: “. . . in price negotiations with manufacturers, foreign governments with centralized pricing exploit the fact that once a drug is already produced, the firm is always better off selling at a price above the marginal cost of production and making a profit, regardless of how small, than not selling at all. Thus, the foreign government can insist on a price that covers the marginal production cost—but not the far greater sunk costs from years of research and development—and firms will continue to sell to that country” (CEA 2018, 15; 141 emphasis added).6 The prediction that the foreign price must equal marginal cost conflicts with stylized fact (3). As with Pecorino (2002), this model is also inconsistent with stylized fact (4) since there is no need to spend massively to deter arbitrage when there is no threat of arbitrage.
The situation where there is a single manufacturer and the foreign negotiator has all the bargaining power is a special case of both the Council’s and Pecorino’s models. Both predict a foreign price equal to the marginal cost of production. But imagine what would really happen if producers of drugs to cure hepatitis C sold them for $65,000 per cure (their current price) in the U.S. market and for $140 (marginal cost) in the market of other high-income countries. Since the market of the other high-income countries, taken as a group, is so large, arbitrage into the U.S. would occur on a massive scale. Demand at the $65,000 price would plummet, creating an incentive for the manufacturers to narrow the price differential between the two markets below what these models predict.7
Ganslandt and Maskus (2004) were the first to recognize that pricing to deter arbitrage might be advantageous to a manufacturer. They sketch a model where a single manufacturer with zero marginal cost can sell the same product in the foreign market at a price cap set exogenously and in the home market at a price of its choosing. If the difference between the two prices strictly exceeds an exogenous threshold, arbitrage is “accommodated” and if the price difference is no larger than that threshold, arbitrage is deterred. In their model, the foreign price cap is exogenous, conflicting with stylized fact (2). There is also no spending to scare consumers, a violation of stylized fact (4).
The contribution of the current paper is to provide a tractable model of the international pharmaceutical market for some therapeutic class of drugs (blood thinners, hypertension drugs, hepatitis C direct action antivirals, etc.) consistent with all four prominent characteristics of that market. The model combines the feature of arbitrage deterrence sketched in Ganslandt and Maskus (2004) with the bargaining model outlined in CEA (2018). In particular, we assume that if the difference between the high U.S. retail price and the low foreign retail price is sufficiently great, massive arbitrage would occur. We maintain all of the other assumptions of the Council. In particular, we continue to assume that a single negotiator bargains with \(n \geq 1\) manufacturers on behalf of all the foreign governments and that it proposes the price it is willing to pay on a take-it-or-leave-it basis. In this way, we show how a single change in assumption alters the prediction of the Council.
It is common to consider the two extremes: either arbitrage is illegal, the markets are unconnected, and the domestic and foreign prices are independent of each other; or arbitrage is legal, the markets are perfectly connected, and the domestic and foreign prices coincide.8 However, there is a neglected intermediate case where importing prescription drugs is illegal, but nonetheless the markets are connected. Banning pharmaceutical imports does not eliminate importation; it merely makes engaging in it more costly. Massive arbitrage would still occur if the price difference were sufficiently great. Our formulation permits consideration not only of the two extremes but also of this intermediate case where the threat of arbitrage leads manufacturers to reject a negotiated foreign price any closer to the marginal cost of production.
In the equilibrium of this intermediate case, the difference in prices that emerges is just small enough to deter massive arbitrage. Only inframarginal buyers with unusually low thresholds would still purchase from foreign pharmacies. Recent empirical findings (Hong et al. 2020) are consistent with this prediction: “The findings suggest that patients are not using prescription purchases outside the U.S. to meet their medication needs.” In particular, according to this study based on 61,238 adults taking prescription medicines, a mere 1.5% of U.S. adults purchasing prescription medications bought them abroad to save money.9 Hence, the pharmaceutical industry’s intensive (and expensive) campaign to scare and confuse potential importers has succeeded. It has deterred the 98.5% of U.S. purchasers from reaping the huge savings available had they filled their prescriptions at the same licensed pharmacies that patients in other high-income countries routinely utilize to treat the same illnesses. A welfare implication of the situation modelled should be emphasized. Policies that benefit U.S. consumers do not do so by stimulating more arbitrage. The benefits arise instead because these policies motivate profit-maximizing manufacturers to lower domestic prices to deter arbitrage.10
It is important to distinguish two kinds of arbitrage that can be triggered if price differences between markets are sufficiently large: (1) personal arbitrage by patients seeking the least expensive cure for their illness and (2) commercial arbitrage by firms that buy and then resell whatever quantity of cures maximizes their profits. While both forms of arbitrage are illegal, personal arbitrage for own use has never been prosecuted. On the other hand, the law against commercial arbitrage is strictly enforced.
That may change. Bills have been proposed to legalize both kinds of arbitrage: “The Safe and Affordable Drugs from Canada Act of 2021” (S. 259), introduced by Senator Klobuchar on February 4, 2021 focuses on personal imports from Canada. It removes the discretion the FDA currently has to intercept personal imports from Canada. It explicitly requires that such imports be allowed if the dispensing pharmacy is licensed in Canada and provides the medication using a valid prescription from a physician licensed in any U.S. State.
“The Affordable and Safe Prescription Drug Importation Act” (S.920), introduced by Senator Sanders on March 23, 2021, is more sweeping. It allows individuals to use a licensed foreign pharmacy in any country to fill a U.S.-issued prescription for personal use (up to a 90-day supply), requires HHS to issue regulations that permit commercial importation from Canada and, at HHS’s discretion after a two year delay, to permit commercial importation from the OECD and other countries. Finally it imposes criminal penalties for online websites that sell counterfeit drugs or dispense drugs without a required prescription. Thus, in future years the importing may be done by Amazon Pharmacy or Costco.11
We proceed as follows. In Section 2, we introduce our model of personal importation, show that it has a unique subgame-perfect equilibrium, and that despite our assumption that the foreign negotiator has all the bargaining power, he is unable to negotiate the price down to the marginal cost of production. In Section 3, we show how the same framework can be used to determine domestic and foreign prices if the threat comes instead from commercial arbitrage. Section 4 concludes the paper.
Personal Arbitrage
Personal arbitrage typically occurs when a patient with a valid U.S. prescription orders online from a pharmacy which may be as close as Canada or as far away as New Zealand. Many foreign pharmacies receiving a prescription from an American patient routinely fill the order with the version of that drug approved in their own country. In countries where pharmacists are required to receive a prescription from a local doctor, the current practice is for the local doctor to review the U.S. prescription and the patient history and write a new prescription (“cosigning”) for the foreign version of the medication. Although importing prescription drugs into the United States for own use is technically illegal, no one has ever been prosecuted for this “crime,” which is victimless.
Although it is less common than online purchasing (Levitt, 2015), some patients have traveled to a foreign country such as Canada or a member of the EU, filled their prescriptions, and returned home.12 Enforcement then seems even more problematic since a patient can always disguise the drug purchased abroad by putting it in empty bottles (either from old prescriptions or over-the-counter medications). Even if the authorities were capable of stopping personal arbitrage, it seems unwise politically to separate a grandmother from the only medication she can afford to treat her cancer.
We hypothesize that if patients with valid prescriptions could save enough money by purchasing from foreign pharmacies instead of from American pharmacies, there would be massive personal arbitrage. We denote the threshold difference in retail prices as \(\Delta\). Like Ganslandt and Maskus (2004), we assume this threshold is exogenous.13
Let \(p^{U}\) denote the price the manufacturers charge wholesalers in the United States and \(p^{N}\) denote the price they charge wholesalers for the same medication abroad. Let \(\tau_{w}>1\) denote the exogenous markup of wholesalers, so that they charge local pharmacies at home and abroad \(\tau_{w} p^{U}\) and \(\tau_{w}p^{N}\), respectively. Let \(\tau \geq \tau_{w}\) denote the exogenous combined markup of wholesalers and retailers at home and abroad, so that the retail prices are, respectively, \(\tau p^{U}\) and \(\tau p^{N}\). We assume that massive personal arbitrage will occur if \(\tau(p^{U}-p^{N})>\Delta\) and none (apart from inframarginal imports) will occur if \(\tau(p^{U}-p^{N})\leq \Delta\).
The U.S. government can lower \(\Delta\) exogenously by scaling down misleading FDA warnings about the riskiness of taking medications routinely dispensed by licensed pharmacies in other high income countries; legalizing personal arbitrage would have similar effects, since it would reassure U.S. consumers about the safety of prescriptions filled at such pharmacies.
We consider \(n \geq 1\) manufacturers, each producing one therapeutically equivalent, branded drug (such as the DAAs to cure hepatitis C, the vaccines to prevent Covid-19, blood thinners, hypertension drugs, etc.) at zero marginal cost and selling them at a market-determined price in the United States and at a negotiated price ceiling in the EU and Canada. The cap is set in the following game between the \(n\) manufacturers and the negotiator. At the time of this bargaining, the R&D cost for developing the drug is a sunk cost.
Description of the Bargaining Game of Perfect Information
In this subsection, we describe the price negotiations between the agent representing the foreign governments and the \(n\) manufacturers. Since none of the bargaining games in the literature seemed appropriate for our purposes, we constructed a tractable noncooperative bargaining game.14 The subgame-perfect equilibrium of this game is unique, intuitive, and amenable to graphical comparative-static analysis.15
We envision the following game. A single negotiator specifies a discounted price \(p^{N}\) per cure at which to purchase medication for each of the (exogenous) \(Q^{N}\) sufferers of a specific malady (such as hepatitis C).16 The negotiator proposes this price sequentially to each of the \(n \geq 1\) drug manufacturers. If \(k\) of them accept his proposal, he orders \(Q^{N}/k\) from each of them. Those rejecting the negotiator’s proposal produce and sell only in the unnegotiated (U.S.) market. Those accepting it sell not only in the U.S. market but also in the foreign market. In the next subsection, we deduce the unique subgame-perfect equilibrium of this bargaining game.17
Intuitively, manufacturers benefit if they accept the negotiator’s proposal since each manufacturer can then sell in the foreign market a drug that is costless to produce. On the other hand, every manufacturer also incurs a cost in the U.S. market if any of them accepts the negotiator’s proposal because of actual or potential arbitrage. As a simplification, we assume that if arbitrage were to occur, all \(Q^N\) cures obtained by the foreign negotiator would flow into the U.S. We relax this assumption at the end of the section.
If \(Q^{N}\) were small relative to the size of the U.S. market, importation would be insignificant and the manufacturers would accommodate arbitrage by playing Cournot using a demand curve shifted inward slightly by the negligible amount \(Q^{N}\). That is, manufacturers would sell in the U.S. market to the vast majority of patients lacking the good fortune to have acquired the \(Q^{N}\) imports. However, since pharmaceuticals would be imported not only from Canada but from all the other OECD countries, \(Q^{N}\) is large relative to the U.S. market and manufacturers would find arbitrage deterrence more profitable than accommodation.18 Hence, the consequence of any manufacturer accepting the negotiator’s proposal is a retail price in the U.S. market of at most \(\Delta\) more than the retail price abroad.
Given the extremely low marginal costs of production for most drugs (recall the costs reported in Section 1), we assume that producing additional cures is costless.19 In addition, we assume that the drugs in this therapeutic class are perfect substitutes and therefore sell at the same price. Throughout, we assume that domestic retail demand, denoted \(D(\cdot)\), depends on the retail price \(p=\tau p^{U}\) and satisfies the following conditions: (1) \(D(0)\) is finite, (2) \(pD(p)\) is strictly concave and achieves a maximum at \(p^{*}>\Delta>0\), and (3) there is a unique Cournot equilibrium in the game where the \(n\) manufacturers sell simultaneously in the U.S. market and earn \(p^{Cournot}/\tau=p^{U}\) per cure.
Table 1. Payoffs to manufacturer i
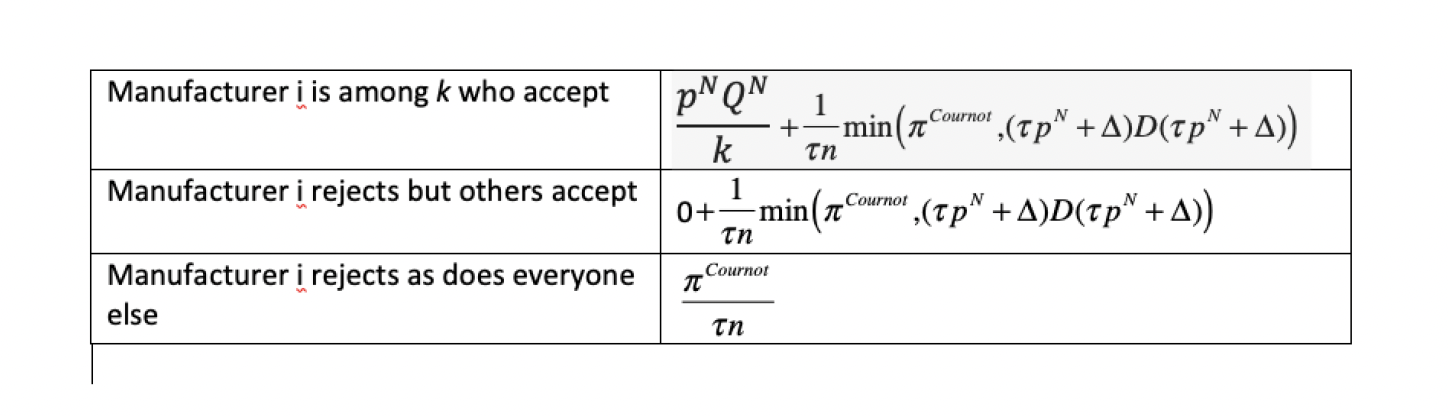
The negotiator approaches each manufacturer in sequence and proposes to pay \(p^{N}\) per cure for \(\frac{Q^{N}}{k}\) cures, where \(k=1, \ldots, n\) is the number of manufacturers that ultimately accept. After the last manufacturer makes his decision, payoffs in the bargaining game are collected. The payoffs result from the subsequent simultaneous sales by the \(n\) manufacturers.
If every manufacturer rejects the negotiator’s proposal, then each of the n manufacturers sells only in the U.S. market and receives an equal share of Cournot retail profits deflated by the markup factor (\(\tau\)). If \(k \geq 1\) manufacturers accept the negotiator’s proposal but \(\tau p^{N}+\Delta > p^{Cournot}\), then each of those accepting the proposal earns \(p^{N}Q^{N}/k\) in the foreign market while those rejecting it earn nothing there. The U.S. retail price is \(p^{Cournot}\), which is insufficient to compensate arbitrageurs given the high cost (\(\tau p^{N}+\Delta\)) of acquiring foreign drugs. No arbitrage occurs. Every manufacturer therefore again earns in the U.S. market an equal share of Cournot profits deflated by the markup factor (\(\tau\)).
If \(\tau p^{N}+\Delta<p^{Cournot}\) and at least one of manufacturers accepts the negotiator’s proposal (\(k \geq 1\)), then each of the \(k\) manufacturers earns \(p^{N}Q^{N}/k\) in the foreign market while the \(n-k\) others earn nothing in that market. In the U.S. market, however, a price of \(p^{Cournot}\) would attract massive arbitrage. To deter it, limit pricing occurs instead. Each manufacturer sells enough more than its Cournot output in the U.S. market that the U.S. retail price (\(\tau p^{U}\)) drops to \(\tau p^{N}+\Delta\). No manufacturer would unilaterally sell less than \(D(\tau p^{N}+\Delta)/n\), under a weak condition insuring that arbitrage deterrence occurs in equilibrium. Nor would any manufacturer unilaterally sell more than this quantity since, with every firm producing an output exceeding the Cournot level, selling more would drive the U.S. retail price further away from the revenue-maximizing level. Hence, if any manufacturer accepts the proposal, the retail price in the U.S. market would be \(\tau p^{N}+\Delta\), but no importing would occur.
In Table 1, we list for any proposed \(p^{N}\) the payoffs manufacturer i would receive in this bargaining game. These payoffs depend not only on his accept-reject decision but on those of the \(n-1\) other manufacturers.
The Unique Subgame-Perfect Equilibrium in the Bargaining Game
We now consider how each manufacturer in the sequence would respond to any proposed \(p^{N}\). Each manufacturer in the sequence would find himself in one of two situations: either (1) some firm earlier in the sequence had already accepted the negotiator’s proposed price \(p^{N}\) or (2) no previous manufacturer had accepted the proposed price. We work backwards, considering first the optimal choice of the final manufacturer in the sequence.
We consider two cases. In the first case, the proposed price satisfies:
\[p^{N}Q^{N}+\frac{(\tau p^{N}+\Delta)D(\tau p^{N}+\Delta)}{\tau n}>\frac{\pi^{Cournot}}{\tau n}\] (1)
If someone previously had accepted the proposal, the final manufacturer would accept as well. For, even if he rejected the proposal, there would still be \(Q^{N}\) cures that would 338 flood the U.S. market unless arbitrage was deterred. By accepting and selling in the foreign 339 market, he would earn revenue additional to his domestic sales.
If no one had previously accepted, the final manufacturer would strictly prefer to accept. For by being the only manufacturer to accept, he would earn \(p^{N}Q^{N}\) in the foreign market plus \(\frac{(\tau p^{N}+\Delta)D(\tau p^{N}+\Delta)}{\tau n}\) in the domestic market, which according to inequality (9) strictly exceeds \(\pi^{Cournot}/\tau n\), the revenue he would earn if he rejected the negotiator’s proposal. So the final manufacturer would accept such a proposal even if no firm prior to him had accepted it.
Turning now to the optimal decision of the penultimate manufacturer, he would accept the proposal if any previous manufacturer had accepted; for, there would then be the arbitrage threat of the \(Q^{N}\) cures in the foreign market whether he accepted or rejected the proposal, and he would strictly increase his revenue by also selling in the foreign market. If no previous manufacturer had accepted the proposal, the penultimate manufacturer would anticipate that if he rejected it as well, the final manufacturer would nonetheless accept it since that is his best reply in that situation. Thus, the penultimate manufacturer recognizes that there would be \(Q^{N}\) cures in the foreign market to be deterred from flooding the U.S. market regardless of his decision; he accepts and strictly increases his revenue by \(p^{N}Q^{N}\) / 2 since he would divide the foreign market with the final manufacturer.
Any previous manufacturer would behave in the same way. If someone had previously accepted, he would accept to get some share of the foreign market. If no one had previously accepted and he also rejected, he would anticipate that every subsequent manufacturer would best-reply by accepting the negotiator’s proposal. Hence, he would anticipate that regardless of what he did the \(Q^{N}\) cures would still loom over the U.S. market and that by accepting he would get an additional \(p^{N}Q^{N}/(1+z)\) in revenue, where \(z\) is the number of manufacturers who move after him.
Suppose instead the proposed \(p^{N}\) satisfies the following inequality:
\[p^{N}Q^{N}+\frac{(\tau p^{N}+\Delta)D(\tau p^{N}+\Delta)}{\tau n}<\frac{\pi^{Cournot}}{\tau n}\] (2)
As before, the final manufacturer and every predecessor would accept the proposed price if any previous manufacturer had previously accepted it. Suppose, however, that the final manufacturer observed that no one had previously accepted the proposed price. If he accepted it, inequality (2) indicates that he would be strictly worse off than if he joined his predecessors in rejecting the proposal and competed only in the U.S. market; for if none of the \(n\) manufacturers sells in the foreign market, there would be no need to deter arbitrage and he would earn his share of Cournot profits deflated by the markup \(\tau\). Now consider the penultimate manufacturer. If he observed that no one had previously accepted the negotiator’s proposal, then—anticipating that the final manufacturer would reject it if he did, he would reject \(p^{N}\) as being too low. Indeed, every prior manufacturer would be in the same position. If he rejected the proposal, every subsequent manufacturer would do so as well and there would be no threat of imports flooding the U.S. market. The \(n\) firms would each get a share of the Cournot profits in the U.S. market.
\[p^{N}Q^{N}+\frac{(\tau p^{N}+\Delta)D(\tau p^{N}+\Delta)}{\tau n}=\frac{\pi^{Cournot}(n)}{\tau n}\] (3)
Since the foreign negotiator wants to purchase \(Q^{N}\) cures at the lowest price, he would propose a price just above \(\bf{p}^{N}\). In the play of the game, every manufacturer accepts proposal \({\bf p}^{N}\), and each firm receives \(1/n^{th}\) of the additional \(Q^{N}\) sales. The retail price in the U.S. market falls to \(\tau p^{U}=\tau p^{N}+\Delta\), just low enough to deter arbitrage. The \(n\) manufacturers sell \(Q^{N}\) cures in the negotiated market and \(D(\tau {\bf p}^{N}+\Delta)\) in the unnegotiated market.
If \(n=1\), the right-hand side of equation (2.3) is the monopoly profit the firm would receive if it sold only in the U.S. market and the left-hand side is the profit it would receive from selling to wholesalers at price \(p^{N}\) in the foreign market and at price \(p^{N}+\Delta/\tau\) in the U.S. market, the highest price it can charge without triggering arbitrage. The equality of the two sides indicates that the foreign negotiator drives the foreign price (\(p^{N}\)) down so that the monopolist earns no more profit selling in both markets than it would receive selling only in the U.S. market. If \(n>1\), the payoff on the right-hand side is the profit per firm every firm would earn if it sold only in the U.S. market. As for the left-hand side, it is what any one firm conjectures it would earn if it broke ranks with the other \(n-1\) firms and accepted the negotiator’s proposal of \(p^{N}\) instead of rejecting it. The equality of the two sides indicates that the foreign negotiator bargains the price down as far as he can; it would be in the self-interest of each manufacturer to reject his price proposal if it were any lower.20
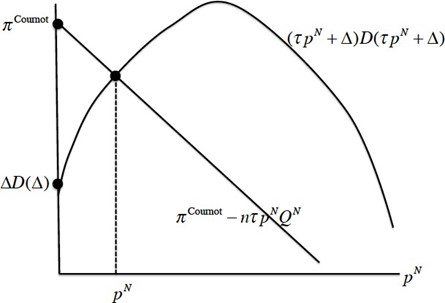
It is helpful to rearrange equation (3) as follows:
\[(\tau p^{N}+\Delta)D(\tau p^{N}+\Delta)=\pi^{Cournot}(n)-\tau np^{N}Q^{N}\] (4)
The right-hand side is a decreasing linear function of \(p^{N}\) with vertical intercept \(\pi^{\mbox{ Cournot }}(n)\) and slope \(-\tau nQ^{N}<0\). The left-hand side is a strictly concave function with vertical intercept \(\Delta D(\Delta) \geq 0\). Given our assumptions about the function \(D(\cdot)\), domestic total retail revenue \((\tau p^{N}+\Delta)D(\tau p^{N}+\Delta)\) is strictly increasing at \(p^{N}=0\).
Since Cournot profit is strictly smaller than monopoly profit (for \(n=2,\ldots\)), the vertical intercept of the line is strictly smaller than the peak of the concave profit function. There are two possible cases. In the first case, \(\Delta \leq p^{Cournot}\), the domestic and foreign markets are “connected” and \({\bf p}^{U}={\bf p}^{N}+\Delta/\tau\); in the second case, \(\Delta > p^{Cournot}\), the two markets are “unconnected” and \(p^{N}=0\) (marginal cost) while \({\bf p}^{U}=p^{Cournot}/\tau\). The first case (respectively, the second case) arises if the vertical intercept of the single-peaked function lies below (resp. above) the vertical intercept of the downward-sloping line. In the two cases,
\[{\bf p}^{U}=\min \left({\bf p}^{N}+\Delta/\tau, p^{Cournot}\right/\tau)\]In the connected case, the horizontal component of the point of intersection is the manufacturer’s foreign price (\({\bf p}^{N}\)), and the vertical component is the total retail revenue in 402 the domestic market. In the unconnected case, the negotiated manufacturer’s price abroad equals the marginal production cost (assumed, for simplicity, to be zero), and the retail 404 price in the U.S. market is the Cournot price. We depict the determination of \({\bf p}^{N}\) in Figure (1):
Figure 1. Determination of the foreign price when there is a threat of personal arbitrage.
In deriving the equilibrium, we assumed as a simplification that if the price differential were large enough to make personal arbitrage attractive, all of the \(Q^{N}\) cures sold in the foreign market would be imported into the U.S. We conclude this section by showing that such an extreme assumption is not necessary for arbitrage deterrence to occur in the equilibrium.
Suppose some firm unilaterally deviated from the proposed arbitrage deterrence equilibrium, by reducing his sales in the domestic market and driving the price up to \(p^{U}>{\bf p}^{N}+\Delta/\tau\). Suppose that as a result, there were only \(\theta Q^{N}\) cures imported for own use, where \(\theta \in (0,1)\). This unilateral deviation would not affect the deviator’s revenue in the foreign market. He would still sell \(Q^{N}/n\) cures at the price \(\tau {\bf p}^{N}:\; \theta Q^{N}/n\) to Americans importing for own use and \((1-\theta)Q^{N}/n\) to foreigners. However, the unilateral deviation would change the deviator’s revenue in the domestic market by:
\[p^{U}\left(D(\tau p^{U})-\frac{n-1}{n}D(\tau {\bf p}^{N}+\Delta)-\theta Q^{N}\right)-\frac{(\tau {\bf p}^{N}+\Delta)}{\tau n}D(\tau {\bf p}^{N}+\Delta)\] (5)
where \(p^{U} \geq {\bf p}^{N}+\Delta/\tau\).
The second term in (5) is the revenue the deviator receives in the equilibrium from sales in the U.S. market. The first term is the revenue the deviator would get from unilaterally reducing his U.S. sales enough to drive the price up to \(p^{U}\). The second factor of the first term is the amount he would have to sell to accomplish this price increase—the aggregate demand in the U.S. minus the sum of personal imports and the sales from the \(n-1\) non-deviators, conjectured to be unchanged.
If the foreign country was small (e.g. Monaco) or θ was small, \(\theta Q^{N}\) would be negligible and (2.5) reduces to zero when \(p^{U}={\bf p}^{N}+\Delta/\tau\). Since in the equilibrium, every firm is selling more than his Cournot output, even a marginal output contraction by the deviator would make his deviation strictly profitable. In this case, no equilibrium with arbitrage deterrence can exist. On the other hand, if \(\theta Q^{N}\) were sufficiently large, the unchanged sales in the U.S. of the \(n-1\) rivals plus the large personal imports (\(\theta Q^{N}\)) of the Americans might virtually satisfy U.S. market demand at \({\bf p}^{N}+\Delta/\tau\). In that case, the deviator’s sales would be meager and his unilateral deviation would be massively unprofitable. Consider any \(Q^{N}\) large enough that when \(\theta=1\), the most profitable deviation results in a strict loss. Since the deviator’s revenue in the domestic market from his most profitable deviation is continuous in \(\theta\), his deviation will also result in a strict loss for any \(\theta \in (\theta^{*},1)\) where \(\theta^{*}\) is the unique root of the maximized value of the expression in (5).21
Commercial Arbitrage
We have postponed discussion of commercial importation until now because (1) the analysis parallels that of personal arbitrage and (2) the ban on commercial importation is currently strictly enforced.
Since importers must pay a foreign wholesaler as much as local pharmacies pay it, importers must pay the wholesaler \(\tau_{w}p^{N}\) per unit. Assume the exogenous per-unit cost of importing is the same for all importers and denote it \(\Delta^{c}\). Since the ban against commercial importation is currently strictly enforced, \(\Delta^{c}\) is high (\(\Delta^{c}>>\Delta\)). But it will drop precipitously (\(\Delta^{c}<<\Delta\)) if Senator Sanders bill or a similar one becomes law.
There are three types of commercial importers: (1) dispensers like Amazon, CVS, or Costco which sell to U.S. prescription holders; (2) U.S. wholesalers which sell to U.S. pharmacies; and (3) U.S. arbitrageurs which sell to U.S. wholesalers. If the importer is a dispenser, it earns a per-unit profit of \(\tau p^{U}-\tau p^{N}-\Delta^{c}\). If the importer is a U.S. wholesaler, it earns a per-unit profit of \(\tau_{w}p^{U}-\tau_{w} p^{N}-\Delta^{c}\). If the importer is an arbitrageur, it earns a per-unit profit of \(p^{U}-\tau_{w}p^{N}-\Delta^{c}\). Since \(\tau>\tau_{w}>1\), the largest per-unit profit would be earned by the dispensers. Hence, if the dispensers are deterred, so too will the other two types of commercial importers.
To summarize, commercial importation is deterred if and only if:
\[\tau p^{U}\leq \tau_{w}p^{N}+\Delta^{c}\] (6)
Previously, it was shown that personal importation is deterred if and only if:
\[\tau p^{U} \leq \tau p^{N}+\Delta\] (7)
We also concluded that the retail price in the U.S. will be no higher with an arbitrage threat than without one:
\[\tau p^{U} \leq p^{Cournot}\] (8)
Finally, the foreign negotiator’s offer will be accepted if and only if:
\[np^{N}Q^{N}+p^{U}D(\tau p^{U}) \geq \frac{\pi^{Cournot}}{\tau}\] (9)
The lowest price the foreign negotiator can secure must be acceptable to the firms but without triggering either type of arbitrage.
In Figure 2, the foreign manufacturers’ price is on the horizontal axis and the U.S. manufacturers’ price is on the vertical axis. The personal arbitrage constraint is depicted as a line sloping upward at 45 degrees with a vertical intercept of \(\Delta/\tau\); the commercial arbitrage constraint is depicted as a line sloping upward at a flatter slope (\(\tau_{w}/\tau <1\)) with vertical intercept \(\Delta^{c}/\tau\). No arbitrage occurs if the two manufacturers’ prices (\(p^{N}, p^{U}\)) lie on or below both arbitrage constraints. In addition, the manufacturers’ price in the U.S. cannot exceed \(p^{Cournot}/\tau\). Hence, \(p^{U}\) must satisfy \(p^{U} \leq \min({p^{Cournot}; p^{N}+\Delta/\tau; \frac{\tau_{w}}{\tau} p^{N}+\Delta^{c}/\tau})\). Finally, the negotiator will restrict his attention to prices that are above the downward-sloping line since only they will be accepted. Such price satisfy inequality (9).

Figure 2. Even though the foreign negotiator has all the bargaining power, he cannot bargain the price down to marginal cost since proposals resulting in commercial or personal arbitrage are unacceptable to the firms.
In Figure 2, the shaded set of manufacturer prices (\(p^{N},p^{U}\)) defined by the intersection of the four inequalities is labeled the “Feasible Set.” In constructing the diagram, we have assumed that commercial arbitrage has been legalized and so \(\Delta^{c}<\Delta\). As a result, the commercial arbitrage boundary lies below the personal arbitrage boundary—the reverse of what is currently the case. To avoid clutter, the foreign negotiator’s field of indifference curves is not depicted. However, each curve is a vertical line and lines further to the left are preferred by the foreign negotiator since he prefers to pay less for them \(Q^{N}\) cures that he procures. The optimal choice of \(p^{N}\) occurs at the intersection of the downward-sloping line and the lower of the two upward-sloping lines. Since we have assumed that commercial importation has been legalized, its constraint is the relevant one. Before legalization of commercial arbitrage, the personal arbitrage constraint would have been the relevant one and the best choice of \(p^{N}\) would have been lower and \(p^{U}\) would have been higher.
Any foreign price proposed by the negotiator strictly to the left of the downward-sloping locus would be rejected; any proposed price on it or to its right would be accepted. If the markets are connected, the equilibrium negotiated price is the smallest \(p^{N}\) that (1) deters massive arbitrage but (2) is acceptable to the manufacturers. This occurs where the downward-sloping line intersects the lower upward-sloping line.
Policies that shift the downward-sloping locus against an unchanged upward-sloping locus will result in the manufacturers’ U.S. price and negotiated foreign price changing in the same direction. For example, increases in \(Q^{N}\) will lower both the foreign price and the domestic price.22
Policies that shift the upward-sloping locus against an unchanged downward-sloping locus will result in the U.S. price and the negotiated foreign price changing in opposite directions. For example, lowering \(\min(\Delta, \Delta^{c})\) would raise the manufacturers’ foreign price and lower the manufacturers’ U.S. price.
We can express revenue per firm (denoted \(R\)) in terms of exogenous variables and \(p^{N}\).
\[R=\frac{pQ^{N}}{n}+\frac{p^{U}D(\tau p^{U})}{n}\] (10)
At the optimum, (9) will hold as an equality. Substituting the equality into (10), we conclude:23
\[R=\frac{\pi^{Cournot}}{n\tau}-\frac{(n-1)}{n}p^{N}Q^{N}\] (11)
If \(\min(\Delta, \Delta^{c})\) decreases and consequently the foreign price increases, equation (11) implies that manufacturer revenue and hence variable profit will decrease.
Conclusion
In this paper, we identified four stylized facts about the international market in branded pharmaceuticals that seem undeniable. We then showed that no model in the literature explains these facts, and we constructed a new model consistent with them.
Central to this explanation is the effect on manufacturer pricing of the threat of massive personal arbitrage. Legislation is being considered which will lower the cost of importing whether for own use or for commercial resale. If enacted into law, this legislation will reduce U.S. drug prices and will lower the variable profits of pharmaceutical manufacturers. As has been emphasized by Egan and Philipson (2013), CEA (2018), Danzon (1997) and others, these profits are used in part to fund the massive fixed cost of drug innovation. The induced decrease in profits may, therefore, reduce innovation. However, the evidence that welfare will decline as a result is ambiguous. Lakadawalla (2018), in his thorough survey of the empirical work on this issue, concluded: “We have stressed the uncertainty surrounding the normative analysis of innovation investment. The question of whether innovation is too high or too low is a first-order—perhaps the first-order— policy question in the economics of the pharmaceutical industry. Yet, economists have not produced a definitive answer.”
If welfare turns out to decline because of reduced R&D in this industry, subsidizing innovation can restore the rate of innovation to its previous level. To me, asking sick people to finance drug innovation, which is of value not only at home but abroad, is ethically indefensible. The burden falls heaviest on sick Americans since our prices are by far the highest. People currently in good health should shoulder more of the burden. Increased subsidization, financed by general taxes at home and abroad is, in my view, a step in the right direction.
Funding: This research was funded by the Michigan Institute of Teaching and Research (MITRE).
Acknowledgments: Jim Adams stimulated my interest in this topic, and I am indebted to him for many useful discussions. I also wish to thank Yuan Chen, Yichuan Wang, and Haozhu Wang for their valuable research assistance and Rabah Amir, Andrew Daughety, Gérard Gaudet, Stephen LeRoy, Joshua Linn, Joseph Newhouse, Yesim Orhun, Charles Phelps, Jennifer Reinganum, Anna Schmidt, and Jon Sonstelie for comments on earlier drafts. I am indebted to Gabriel Levitt for clarifying the mechanics of personal arbitrage and for his continuing encouragement. I am particularly grateful to Mingyuan Zhang for his research assistance and to Marius Schwartz for his extensive comments on a previous draft.
Conflicts of Interest: The author declares no conflict of interest. MITRE had no role in (1) the design of the study, (2) the writing of the manuscript, or (3) the decision to publish the results.
Footnotes
1 All the quotations in this paragraph are from the investigative report in Bloomberg (2019).
2 For a discussion of the tactics used by “a network of other groups closely aligned with U.S. pharmaceutical companies. . . to drive PharmacyChecker off the Internet” see Stoltz 2019.
3 The FDA could undoubtedly scale up the surveillance and certification function performed by Pharmacy- Checker.com. Bate et al. (NBER 2013) established that drugs purchased from foreign pharmacies certified safe by PharmacyChecker.com are just as safe as drugs purchased from domestic, brick-and-mortar pharmacies. To detect counterfeits, Bate et al. (NBER 2013) used Raman spectrometry (Witkowski 2005), one of the techniques the FDA uses to distinguish bona fide medicine from counterfeits and adulterated pharmaceutical products.
4 Although PhRMA’s annual lobbying expenditures were $63 million in 2015, the most recent full year for which data are available, annual payments to patient advocacy groups was at least 80% higher! While some of these groups advocate for patients suffering from particular diseases, others “effectively supplement the work lobbyists perform, providing patients to testify on Capitol Hill and organizing letter-writing and social media campaigns that are beneficial to pharmaceutical companies. . . Notably, such groups have been silent or slow to complain about high or escalating prices, a prime concern of patients” (Kopp et al. 2018).
5 Malueg and Schwartz (1994) analyze third-degree price discrimination by a monopolist. Their motivation differed from mine since they were motivated by parallel imports to the U.S. from very low income countries.
6 The academic literature (Grossman and Lai 2008, 386 and Figure 1) also predicts that when re-imports are illegal, governments imposing price controls will bargain down to the marginal cost of production under the plausible assumption that these countries are not too sizable compared with the region that innovates.
7 What would happen in this situation? Our model predicts the arbitrage-deterring pair of prices which would emerge in the two markets for Pecorino’s special case of a single manufacturer as well as for the Council’s more general case of multiple manufacturers.
8 Pecorino calls these the “No Reimports Regime” (NR) and the “Reimport Regime,” respectively. These are essentially the same two extremes on which Grossman and Lai (2008) focus in their valuable article on parallel trade.
9 The study goes on to document the socioeconomic and demographic characteristics of these inframarginal buyers. Many of these outliers are desperately poor or lacking in insurance. We assume that they would continue buy abroad even if the price differential marginally narrowed.
10 The Congressional Budget Office (CBO 2004) concluded that policies to reduce the exogenous threshold, such as legalizing arbitrage or reducing misleading safety warnings, would confer little benefit on U.S. consumers. In reaching this conclusion, CBO disregarded potential reductions in domestic drug prices and confined its estimate of benefits to increases in imports from the European Union and Canada. Under this approach, CBO would have disregarded the policy-induced price changes in our model and, since these are accompanied by no changes in pharmaceutical imports, would have erroneously concluded that no policy change affects consumers.
11 The threat of imports from all OECD countries is vastly more important since they have a population which is 35 times that of Canada.
12 In a signed letter to the New York Times, a rheumatologist observed that “a patient could fly first class to Paris, stay at the Ritz, dine at a top Michelin restaurant, buy a one-year supply of Humira [a rheumatoid arthritis drug] at local prices in France, fly back home and finish with enough profit to hire a registered nurse to administer the injection every two weeks” (Hanauer 2019).
13 If the arbitrage threshold is a strictly increasing but kinked function of the spending of the manufacturers and PhRMA, then the associated marginal cost of increasing that threshold will have vertical segments. We assume that any policy interventions leave the threshold unchanged at the same vertical segment. We denote the threshold \(\Delta\). The threshold is endogenized in Salant (2023).
14 The Nash Bargaining Solution, the Kalai-Smorodinsky Solution, Harsanyi’s Utilitarian Solution, Rawls’ Equal Increments Solution, etc. are cooperative; the most attractive noncooperative one (Rubinstein 1982) would limit us to a single manufacturer; generalizations of Rubinstein to \(n \geq 1\) manufacturers have multiple subgame- perfect equilibria (see Suh and Wen and the references therein); and, although the model of Horn and Wolinsky (1988) has \(n\geq 1\) manufacturers, each government negotiator is required to bargain exclusively with one exogenously designated manufacturer and is therefore unsuitable for our application.
15 We conduct an illustrative analysis when discussing Figure 2. For a more systematic comparative-static analysis, see Salant (2021).
16 Kyle et al. (2008) emphasize that in many European countries, regulations leave pharmacies and patients with no incentive to purchase cheaper offerings. Given that they are so insulated from prices, we assume that \(Q^{N}\) is completely insensitive to price.
17 In footnote 20, we show that the same equilibrium arises if the manufacturers respond to the negotiator’s proposal simultaneously instead of sequentially.
18 See the discussion at the end of the section.
19 Ganslandt and Maskus (2004) make the same assumption.
20 To be precise, if the \(n\) manufacturers respond simultaneously instead of sequentially to the negotiator’s proposal, there are two equilibria. There is a degenerate equilibrium where everyone accepts a proposed \(p^{N}\) no matter how low it is. Rejecting the proposal unilaterally does not alter the need for arbitrage deterrence and merely reduces a manufacturer’s own revenue by \(p^{N}Q^{N}/n\). This equilibrium has no counterpart in the subgame-perfect equilibrium of the sequential game. The more plausible equilibrium in the simultaneous- move game is the counterpart of the subgame-perfect equilibrium in the sequential game. It is an equilibrium in the simultaneous-move game for everyone to reject the proposed price \({\bf p}^{N}\) defined implicitly by inequality (2). For, each manufacturer would receive the payoff on the right-hand side of this inequality whereas if one player unilaterally deviated by accepting the proposal, he would receive the profit on the left-hand side. If \(p^{N}\) is reduced, the left-hand side is even smaller while the right-hand side does not change. Hence, rejecting the proposal remains an equilibrium for any proposed price lower than \({\bf p}^{N}\) . If the proposed price instead satisfies inequality (9), however, this unilateral deviation is strictly profitable and rejection is no longer an equilibrium. What is the equilibrium in this case? Any proposed price higher than \({\bf p}^{N}\) will be accepted by the \(n\) manufacturers; for, if any manufacturer unilaterally rejected the proposal, he would lose \(p^{N}Q^{N}/n\) revenue from the foreign market. Hence, to obtain \(Q^{N}\) cures at the lowest price, the negotiator would propose a price marginally above \({\bf p}^{N}\) and every manufacturer would accept the proposal. None of the \(Q^{N}\) sold in the foreign market would be imported back to the U.S.
21 The envelope theorem implies that the maximized value of (5) strictly decreases in \(\theta\); hence the root \(\theta^{*}\) is unique.
22 If (9) holds as an equality, any increase in \(Q^{N}\) would, for a fixed \(p^{N}\) , raise the first term and necessitate a reduction in the second term in order to preserve the equality. This in turn requires lowering \(p^{U}\).
23 The revenue formula we derive holds whichever upward-sloping arbitrage constraint is binding since the derivation does not involve either of these constraints; it relies only on the definition of revenue and the equation for the downward-sloping line. Note that when \(n=1\) and the Cournot oligopoly reduces to a monopoly, (11) reduces to \(\pi^{Cournot}/\tau\).
References
Bate, R., G.Z. Jin, and A. Mathur. 2013. “In Whom We Trust: The Role of Certification Agencies in Online Drug Markets.” NBER Working Paper 17955. Cambridge, MA: National Bureau of Economic Research.
Berndt, E. 2002. “Pharmaceuticals in U.S. Health Care: Determinants of Quantity and Price.” Journal of Economic Perspectives 16 (4): 45-66.
Berndt, E. 2007. “A Primer on the Economics of the Re-importation of Prescription Drugs.” Managerial and Decision Economics 28: 415-
Bloomberg. 2019. “Sheriffs’ Ads Slammed Drug Imports, and Big Pharma Helped Pay the Tab.”October 23. Accessed at https://www.bloomberg.com/news/features/2019-10-23/big-pharma-helped-fund-sheriffs-ad-blitz-against-drug-imports
CBO (Congressional Budget Office). 2004. “Would Prescription Drug Importation Reduce U.S. Drug Spending? ” Economic and Budget Issue Brief. Washington, DC: CBO.
CEA (Council of Economic Advisers). 2018. “Reforming Biopharmaceutical Pricing at Home and Abroad.” Washington, DC: Government Printing Office.
Danzon, P. 1997. “Price Discrimination for Pharmaceuticals: Welfare Effects in the U.S. and the EU.” International Journal of the Economics of Business 4 (3): 301-321.
Egan, M. and T. Philipson. 2013. “International Health Economics.” NBER Working Paper 19280.
Ganslandt, M. and K. Maskus. 2004. “Parallel Imports and the Pricing of Pharmaceutical Products: Evidence from the European Union.” Journal of Health Economics 23:1035-1057.
Grossman, Gene M., and Edwin L.-C. Lai. 2008. “Parallel Imports and Price Controls.” RAND Journal of Economics 39 (2): 378-402.
Hanauer, L. 2019. “Anger over Drug Prices in the U.S.” New York Times, March 2: A20.
Hill, A., S. Khoo, J. Fortunak, B. Simmons, and N. Ford. 2014. “Minimum Costs for Producing Hepatitis C Direct-Acting Antivirals for Use in Large-Scale Treatment Access Programs in Developing Countries.” Clinical Infectious Diseases 58 (7): 928-936.
Hong Y.R., J.M. Hincapie-Castillo, Z. Xie, R. Segal, and A.G. Mainous. 2020 “Socioeconomic and Demographic Characteristics of U.S. Adults Who Purchase Prescription Drugsfrom Other Countries.” JAMA Network Open, June 24; 3(6): e208968. doi:10.1001/jamanetworkopen.2020.8968: p.1-12.
Horn, H. and A. Wolinsky. 1988. “Bilateral Monopolies and the Incentives for Merger.” The Rand Journal, Autumn, 19 (3): 409-419.
House Ways and Means Committee. 2019. “A Painful Pill to Swallow: U.S. vs International Prescription Drug Prices.” September.
Iyengar, S., K. Tay-Teo, S. Vogler, P. Beyer, S. Wiktor, K. de Joncheere, and S. Hill. 2016. “Prices, Costs, and Affordability of New Medicines for Hepatitis C in 30 Countries: An Economic Analysis.” PLOS Medicine 13 (5): 1-22.
Kopp, E., S. Lupkin, and E. Lucas. 2018.“Patient Advocacy Groups Take in Millions from Drugmakers. Is there a Payback?”Kaiser Health News. April 6. Accessed at https://khn.org/news/patient-advocacy-groups-take-in-millions-from-drugmakers-is-there-a-payback
Kyle, M., J. Allsbrook., and K. Schulman. 2008. “Does Re-importation Reduce Price Differences for Prescription Drugs? Lessons from the European Union.” Health Services Research 43 (4): 1308-1324.
Lakdawalla, D.. 2018. “Economics of the Pharmaceutical Industry.” Journal of Economic Literature 56 (2): 397-449.
Levitt, G. 2015. “Online Pharmacies, Personal Drug Importation and Public Health: Ill-Considered Enforcement Prevents Access to Safe and Affordable Medication.” Prepared for the Senate Committee on Health, Education, Labor and Pensions and the House Committee on Energy and Commerce.
Malueg, D., and M. Schwartz. 1994. “Parallel Imports, Demand Dispersion, and International Price Discrimination ” Journal of International Economics 37: 167-195.
Mulcahy, A., C. Whaley, M. Tebeka, D. Schwam, N. Edenfield, and A. Becerra-Ornelas. 2021. “International Prescription Drug Price Comparisons: Current Empirical Estimates and Comparisons to Previous Studies.” Rand Research Report RR2956.
Pecorino, P. 2002. “Should the U.S. Allow Prescription Drug Reimports from Canada?” Journal of Health Economics 21: 699-708.
Robinson, J. 1933.“Economics of Imperfect Competition.” London: Macmillan.
Rubinstein, A. 1982. “Perfect Equilibrium in a Bargaining Model.”Econometrica, 50:97-110.
Salant, S. 2021. “Arbitrage Deterrence: A Theory of International Drug Pricing.” RFF Working Paper 21-07.
Salant, S. 2023. “Spending and Pricing by a Monopolist to Deter Arbitrage.” Working Paper.
Shepherd, J. 2018. “Consolidation and Innovation in the Pharmaceutical Industry: The Role of Mergers and Acquisitions in the Current Innovation Ecosystem.” Journal of Health Care Law and Policy 21 (1): article 2.
Stoltz, M. 2019. “Suit Against Pharmacy Groups Uses Antitrust as a Weapon Against Unaccountable Online Censorship. ”Electronic Frontier Foundation. September 3.
Suh, S and Wen Quan. 2003. “Multi-Agent Bilateral Bargaining and the Nash Bargaining Solution” Journal of Mathematical Economics, Elsevier, vol. 42(1), pages 61-73.
Wall Street Journal. 2003. “Drug Companies Cry ‘Danger’ Over Imports.” September 22. Accessed at https://www.wsj.com/articles/SB106418061476794700.
Witkowski, Mark R. 2005. “The Use of Raman Spectroscopy in the Detection of Counterfeit and Adulterated Pharmaceutical Products.” American Pharmaceutical Review 8 (1): 645 56-62.