Blair D. Gifford, University of Colorado Denver
Contact: Blair.Gifford@ucdenver.edu
Abstract
What is the message? Voluntary hospitals in the Chicago area responded quickly to the influenza epidemic that appeared in September 1918 and quickly surged to a high number of contagious patients. The active response reinforced the original community service orientation that led to the quick proliferation of hospitals at the turn of the 20th century and crystallized what it meant to be a voluntary hospital.
What is the evidence? Extensive archival evidence from multiple sources.
Timeline: Submitted October 25, 2020; accepted after review: December 10, 2020.
Cite as: Blair D. Gifford. 2021. Chicago Hospitals Response to the 1918 Influenza Pandemic: Legitimating Their Identity as Community Institutions. Health Management, Policy and Innovation (HMPI.org), Volume 6, Issue 1, Winter 2021.
Dedication: This paper is dedicated as a memorial to my grandmother, Rita Demarest Gifford. Rita lived in the Kenwood neighborhood (University of Chicago) on the southside of Chicago. As a young newlywed in her 20s, Rita succumbed to the second wave of the influenza epidemic in 1919. She was pregnant at the time.
U.S. Hospitals Were Gaining Credibility When the 1918 Influenza Epidemic Began
Hospitals were just starting to gain the public’s trust for medical efficacy at the turn of the nineteenth century. With support from poor and wealthy alike, hospitals started to consider how they might combine a charitable tradition with the medical advances that brought top doctors and paying patients to their doors. It was during this early period of increasing appreciation and use of hospitals that the 1918 influenza epidemic suddenly struck and brought an overwhelming surge of patients who needed hospital care.
The number of influenza cases in Chicago began to increase and become noticed in early September, 1918. By late September, it was clear that an epidemic was at hand. Public health officials scrambled to find ways to lessen contagion in public spaces. At its height, during an eight-week period from late September until mid-November, there were two thousand plus new cases of influenza and pneumonia each day. These cases resulted in over five hundred deaths a day in Chicago at the peak of the epidemic.
This research will first provide a social-historical context of the burgeoning hospital industry in Chicago at the turn of the nineteenth century. This history is not just about hospitals. It is also about immigration and community change; how various religions went about providing a health safety net for their members; and, how doctors influenced the development of hospitals into their professional workshop in the 1910s. Given these various influences, the paper will describe how hospitals, during a moment of crisis, responded to heightened need in an effort to maintain their legitimacy as community institutions.
Urbanization, Immigration and the Growth of Hospitals at the Turn of the Twentieth Century
The first census of hospitals in the U.S. was done in 1873. It listed only 178 hospitals nationwide, and of these, most were long-term care institutions, many of which were state and private asylums for the insane (1). However, hospitals were just beginning to move to the forefront with the ongoing urbanization and immigration of the period. From 1870 to 1890 the population of Chicago quadrupled from 300,000 to 1.1 million, and by 1890, 78% of the population were foreign born or children of foreign born. By 1910, the population reached almost 2.2 million, with continued growth to 2.7 million by 1920.
The growing population faced many medical needs. In response to the multi-cultural growth, smaller charitable hospitals were built throughout Chicago’s communities to accommodate the special needs of the various religious and ethnic populations. As part of this evolution, a hospital could be a place of comfort to various beliefs, customs, languages, and races, as well as a site of medical care.
Many working-class Chicagoans endured economic uncertainty and hardship. Unemployment always seemed to be lurking around the next corner, and family illness or an unexpected death could shatter an already fragile existence. Foreign-born populations shied away from most public charity because there was a deep distrust of public assistance (2). In the “old country” there was no such thing as public relief, and they did not expect it or look for it in America. Other forms of charity were still too close to home and could be found with the community setting. But medical care was different. It represented a new and exciting world, and, as such, accepting medical charity was less of a humbling experience and more of a new society that lay beyond the confines of family and community (3).
The science of charity was an attempt to distinguish among those who were in a temporary state of poverty or made dependent by diseases and disability from those who took advantage of charity and would arguably become dependent on charity. Charity hospital patients, although poor and often immigrants, were perceived to be morally redeemable and medically curable. While patients at the large public hospitals were generally terminal or not seen to be “worthy” due to diseases like alcoholism, insanity and venereal diseases (4).
Hospitals in the 1910s: The New Medical Workshop
The introduction of aseptic medicine, anesthesia, and x-ray technologies in the 1890s and clinical labs and early 1900s greatly enhanced the capabilities of hospital-based care. Physicians took advantage of these medical science advances and began to open small, proprietary hospitals, usually with a strong surgical orientation. Ethnic, foreign-born physicians, who had been discriminately excluded from other hospital staffs, were often the enterprising forces behind these hospitals. As a result, a variety of hospitals developed. Hospitals were often started by religious groups, communities, individual doctors and even companies such as railroads. Cities and factories provided a population base to support new health care institutions, and the establishment of a hospital became the goal of every civic-minded community (5, 6).
In view of the government’s expanding role in providing medical care, the availability of free care in many hospitals and dispensaries, and competition from irregular physicians (7), American physicians grew increasingly concerned about their financial status. Medical journals across the country published editorials bemoaning the low income of doctors, which they sometimes estimated to be as low as $500 or $750 a year, scarcely more than that earned by manual laborers (8). In 1913, the Judicial Council of the American Medical Association reported “that hardly more than 10 percent of the physicians in the United States are able to earn a comfortable income” (9). Although further evidence indicates that the medical profession was probably not as badly off as it imagined (7), concerns about income shaped physicians’ views of charitable care. As more and more workers, unable to afford private physicians, but otherwise self -sufficient, turned to charitable inpatient care and dispensaries, the medical profession grew increasingly suspicious that hospitals and dispensaries were treating for free patients who were fully capable of paying.
Medical practitioners also became increasingly upset with the lack of regulation and standards in the industry. Anybody, it seemed, could get a medical degree and practice at hospitals which ranged radically in terms of quality care. To protect itself, the medical profession was instrumental in working with the Carnegie Foundation to research the condition of medical schools in the U.S. The resulting Flexner Report led to closure of almost half of the medical schools in the U.S. and the standardization of medical education in the others. These actions and others indicated that the medical professional, itself aglow in the light of a medical science ethos, was beginning to redefine medical care away from a charitable orientation (4).
The Development of Voluntary Hospitals: Growing Emphasis on Medical Science
In the early 1900s, private hospitals in the United States had begun to move away from a primary charitable orientation to become “voluntary.” At the time, the use of voluntary to describe a hospital meant that it had developed a dual mission of charity and medical science. Voluntary hospitals did not want to break away from their charitable, community-oriented past. However, they needed extra resources to maintain the continuance of their charitable mission. With the excitement of new medical capabilities, hospitals began to embrace a medical science orientation, too. Such an orientation was the new modernism of the day. This new dual orientation allowed voluntary hospitals to maintain community support while increasing revenues (10, 11).
By attracting talented doctors, hospitals were able to gain an increasing number of paying patients especially shorter-term medical and surgical patients. By keeping a charitable orientation, hospitals were able to gain donations from their communities of support and patients to afford the care of those who were less financially able, but worthy. Hospitals had clearly become needed community and medical institutions. As such, the growth in the number of hospitals was exceptional. By 1910, there were almost five thousand hospitals in the U.S., and the ratio of hospital beds per person was equivalent to what it is today.
The dual orientation of voluntary hospitals even became a foundation for some government hospitals. In 1910, Cook County Hospital’s accounted for almost a quarter of all hospital beds and its $642,000 of expenses accounted for about a quarter of general care hospital expenses in Chicago. As a governmental hospital, Cook County provided much charitable care, but it also was a hospital of great distinction for the medical care that it provided. Indeed, it was quite an honor to be a physician with admitting privileges at Cook County Hospital. lso, the hospital served as a primary source for residencies for recent medical college graduates.
Members of the medical profession in Chicago felt that some patients should not be admitted to Cook County because they had financial means, but still tried to receive free services. In 1911, a County Agent was installed in the hospital to examine the financial circumstances of all applicants for admission. These efforts led to restricted admission to those “needing and entitled to service” and led to hospital attendance “materially below would it would have been with a wide-open policy. (12).
Voluntary Hospitals Limit Care for Contagious Disease Patients
The increasing prominence of technology and the physicians who employed these impressive new tools expressed itself in another particularly tenacious way. Voluntary hospitals maintained a charitable mission, advanced a medical science orientation, but were starting to move away from admitting chronic patients, including those with contagious diseases. Such patients would have to seek services at governmental hospitals. As a result, patients at public hospitals started to be seen as wards of the state and generally terminal. That is, they were not seen to be “worthy” due to socially-framed diseases like alcoholism, insanity, and sexually transmitted diseases such as syphilis and gonorrhea, as well as contagious diseases like tuberculosis.
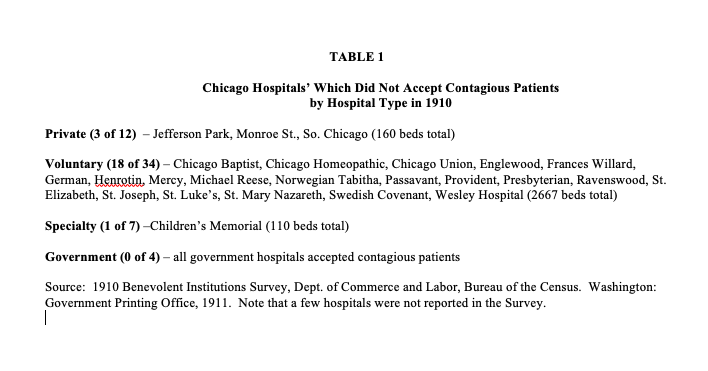
Whether to admit contagious patients or not was a difficult decision for voluntary hospitals to consider. A 1910 survey by the US Government of Benevolent institutions indicated that many voluntary hospitals in Chicago had moved away from admitting contagious diseases (13). As Table 1 shows, over one-half of voluntary hospitals maintained a non-contagious admittance policy, including all the Catholic hospitals and the Jewish hospital and many prominent protestant hospitals.
By contrast, a line was drawn at Cook County Hospital. It had been acting much like a voluntary hospital, but when it came to admitting contagious patients, it needed to be true to its public and government orientation. Yet, it should be pointed out that since Cook County was almost always filled, they probably re-directed many contagious patients to nearby governmental contagious disease facilities (12).
The 1918 Influenza Epidemic in Chicago
The exceptional virulence of the influenza strain of 1918 first became apparent during August outbreaks in Africa, Europe, and North America. No other modern strain of influenza led so frequently to deadly pneumonia. Unlike the 2020 Coronavirus pandemic, younger adults were very susceptible to succumbing to the 1918 influenza as general good health seemed to provide no defense against the virus. Further, the continued wartime mobilization of soldiers and civilians created optimal conditions for the spread of the highly contagious virus. Global fatalities exceeded twenty million and may have approached forty million. In the U.S., influenza and pneumonia deaths exceeded half a million (14).
In Chicago, city health officials became alarmed about a marked rise in deaths in the suburbs to the north. On September 21st, Chicago had its first recorded death due to the acute respiratory problems that the virus presented. By September 30th, there were at least 260 known cases of the influenza virus (15).
This surge led the Health Commission, Dr. John Robertson, to order patient isolation at the large and renowned Cook County Hospital. Military officers, at nearby Great Lakes Naval Training Station, instituted isolation and quarantine controls for those who became sick. All 50,000 sailors on hand were to be given daily nose and throat sprays. Overall, 1000 men were soon put in isolation, another 4,000 sailors were put under quarantine, and liberty leave was canceled for all (16, 17).
On October 11th, the new and quickly formed Illinois Influenza Advisory Commission banned public dancing and public funerals (18). At this point, the spread of the flu had gone parabolic reaching upwards of 2,000 cases and 500 deaths a day. On October 15th, city leaders closed theaters and night schools. Churches and schools were left off the closure list, but clergy were asked to shorten services and students were beginning to not show up for classes. Mischievous students even took to sniffing pepper in order to induce a coughing or sneezing fit, knowing that the school health officer would send them home for a week. On October 16th, the Commissioner ordered that all non-essential public gatherings be banned and that social distancing be practiced. However, exceptions were made for saloons and restaurants so people had a place to go for meals (19).
Doctors and nurses worked around the clock while citizens were trying to understand and cope with the crisis. Morris Fishbein, a prominent Chicago doctor who later became the editor of the Journal of the American Medical Association, wrote in his memoirs that most Chicago physicians visited some “sixty to ninety patients each day” at the height of the epidemic (20).
It was a dangerous time to be a health professional. For example, prominent physician, Harold Dwyer, died suddenly on October 21st. He had worked “incessantly” at Chicago’s public Contagious Disease Hospital since the beginning of the epidemic (21).
Little could be done. Physicians and nurses were generally unable to do much besides isolating influenza patients in large ventilated wards and trying to make them comfortable. In mid-October, a new vaccine serum, made from the blood of influenza-pneumonia convalescents collected at Chicago’s hospitals and known as the Rosnow formula, was made available, but it ultimately showed no effect (19). The front page of the Journal of the American Medical Association stated as much. “Unfortunately we as yet have no specific serum or other specific means for the cure of influenza, and no specific vaccine or vaccines for its prevention…the physician must not allow himself to be led into making more promises than the facts warrant (21).” Besides collecting blood for serum, surgical cases were stopped at hospitals and emergency beds were set up in hallways. Hospitals also promised to make many of the beds free. (22)
By late October, new case reports indicated that the epidemic might be on the decline.
With danger seemingly passing, the Chicago Tribune newspaper started putting pressure on the health commissioner to loosen all restrictions. The editors sarcastically called the Commissioner “his highness” and “his eminence,” and wrote: “outside of the fact that you mustn’t cough, sneeze, expectorate, or osculate, mustn’t smoke on street cars or elevated trains, can not visit sick friends and must continue to observe food and fuel regulations and keep up your installment payments on Liberty bonds, you can get up tomorrow and do as you please” (23). At first, the Health Commissioner did not budge from his strict and unprecedented position, but as cases dwindled he allowed all restrictions to subside on November 16 (24), before subsequent waves of cases reoccurred in 1919 and 1920.
Overall, more than fourteen thousand Chicagoans, in a city of almost 2.7 million, died of influenza or pneumonia between mid-September of 1918 and March of 1919. During this period, the weekly death rate leaped from 10.8 per thousand to 63 per thousand at its height in late October (i.e., one in 16 people). During the critical period of the crisis – September 22 to November 16 – the Department of Health received reports of 37,921 influenza cases and 13,109 pneumonia cases. Of all these cases, there were about 8,500 deaths, an almost 17% rate of death for those who fell ill in an eight week period at the height of the epidemic (25). Officials acknowledged, however, that sickness was far more widespread than their statistics indicated, and that thousands of cases went unreported (16).
Database of Chicago’s Hospitals, 1910 to 1920
Trying to determine how hospitals responded to an influenza epidemic over 100 years ago requires archival work, especially since many of the 1910 and 1920 hospitals in Chicago no longer exist. Hospital survey data were collected from the U.S. Bureau of the Census, Survey of Benevolent Institutions (13), American and Canadian Hospitals (26), the Chicago Medical Society, Blue Book (bi-annually 1905 through 1953) (27), the History of Medicine and Surgery: Physicians and Surgeons in Chicago (28), the Annual Survey of Hospitals (American Hospital Association) (29), and Medicine in Chicago, 1850-1950 (30). Using all sources available, the author’s dataset is more complete than any of the individual sources listed above.
Voluntary hospitals were determined by the extent to which a hospital provided charity care or not. It was decided to use a 5% cut off level for charity patients. That is, those hospitals which provided 5% or more of charity care were labeled “voluntary,” while those below 5% were labeled “proprietary.” Note that almost all voluntary hospitals were well above the cut-off level in a range of 15 to 35 or even 50%, while those categorized as proprietary generally offered no charitable care at all (Gifford, 1993). Historical data was collected from annual reports at the few archives of hospitals still available in Chicago in late 1980s and early 1990s, including: St. Elizabeth, Presbyterian, Englewood, Michael Reese, Lutheran Deaconess, Cook County, Passavant, and German/Grant Hospitals, Cook County, Isolation Hospital.
Chicago Hospital Census, 1910 and 1920
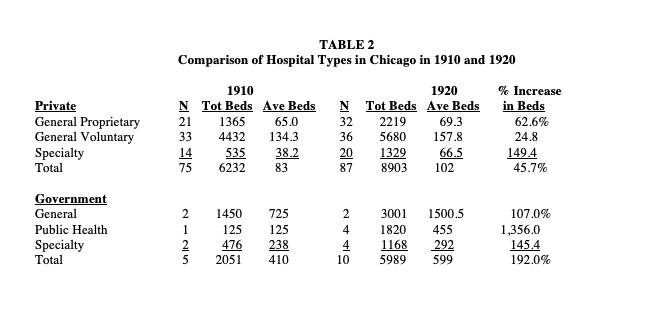
As the gathered data indicate (Table 1), there was a large increase in the capacity of Chicago hospitals in the 1910s as measured by hospital beds. Voluntary hospitals increased their bed capacity by almost 25%, which is line with the population growth of Chicago in the 1910s. Proprietary and private specialty hospitals increased their capacity at a faster rate, but their overall total number of beds was relatively low. The increased capacity of specialty hospitals – both private and public – is probably best explained by the increasing number of births that had moved away from being done privately at home and into hospitals (6).
What is especially clear from Table 2 is that the government hospital capacity had increased dramatically by 1920. That is, the number of public health hospitals in Chicago increased fourfold (1 to 4) and the bed capacity of these hospitals increased well over 1000% (125 to 1820 beds by 1920). When the influenza epidemic arrived government hospitals re-purposed buildings with temporary beds and quickly built public health hospitals to handle the surge in patients and for injured troops coming back home from the conclusion of World War 1. (Note that more American troops died from the influenza epidemic [58,000] than died from battling in the war [53,000], which ended on November 11, 1918, during the pandemic.) For example, Cook County Hospital doubled its bed size from 1350 to 2700 by 1920, but the hospital was almost always filled so it might not have been able to do much extra for the influenza epidemic surge. This would have put even more pressure on quickly making public health beds available in the fall of 1918.
Voluntary Hospitals Respond to Heightened Community Need to Care for Contagious Patients
The influenza epidemic put a severe strain on the capacity of all hospitals. When looking at Table 2, it appears that since many voluntary hospitals had a non-contagious patient policy that this group of hospitals might not have done as much as other hospital types to help handle the surge of patients that appeared at hospitals during the influenza epidemic. However, a closer look at archival data from individual voluntary hospitals provides a different story. That is, although many voluntary hospitals reported that they would not receive non-contagious patients in 1910, many of them reversed this decision and did take contagious patients during the 1918 influenza epidemic. Seven of the eight voluntary hospitals described below clearly opened their doors and, in a few cases, were heroic in their response to providing care for contagious patients.
Catholic hospitals. Despite increasing the size of their outpatient capacity, St. Elizabeth’s Hospital had trouble meeting patient demand during the epidemic: “It can readily be seen by the casual observer that the amount of space supplied by the present building is not sufficient to care for the ever increasing number of patients, who apply for admission. . . at times the institution was taxed to its capacity and compelled to turn patients away (32). Such comments illustrate how the hospital did the best that it could at the time.
Mercy Hospital, the large Catholic teaching hospital on the near south side of Chicago, had its “most difficult nursing assignment for a six to eight month period” during the 1918 Influenza epidemic. Beds were put throughout the hospitals corridors to handle the surge in cases and nurses had to deal with “the sight of flushed patients, with foam forming on the their lips, dying before they could be admitted.” Gordon reported that for prevention purposes, many nurses drank “an ounce of whiskey each day before breakfast.” Amazingly, no Mercy nurses contacted the virus. (33).
Protestant hospitals. The large protestant teaching hospitals in Chicago – Wesley, St. Luke’s and Presbyterian – all were accustomed to providing high levels of charitable care (34). For example, at Presbyterian, 69% of 121,249 patient days in 1917 were free or part-pay, and in 1920, 66% of 134,620 patient days were free or part-pay. Smaller protestant hospitals also provided charitable days of care, but at lower levels. For example, 12% of 17,838 patient days Lutheran Deaconess Hospital were “charitable” in 1910. This increased to 14% of 29,008 patient days in 1919. (35)
In at least some cases, protestant hospitals’ responses to the influenza epidemic was heroic. Passavant Hospital, a medium size hospital on the near north side of Chicago’s downtown business district, stated the following in their 1918 annual report: “All the physical parts of the hospital were overtaxed…that there should be a deficit – and that, a large one – will be no surprise…all epidemic patients were admitted, irrespective of their ability to pay.” (36)
Jewish hospitals. Michael Reese, on the near south side, was the main Jewish hospital in Chicago until Mt. Sinai started operations on the southwest side in 1919. Michael Reese had a strong scientific medicine orientation and was the home to many of Chicago’s Jewish doctors. Both Michael Reese and Mt. Sinai provided very high levels of charitable care. United Hebrew Charities provided significant funding to Michael Reese and Mt. Sinai to cover the costs of charitable patients. As a result, the hospitals provided significant charitable care. (37)
Community hospitals. Grant Hospital, which had just changed its name from German Hospital in light of the fight against Germany in World War 1, increased its percentage of free days to almost 30% in 1918. This compares with 24% in 1914 and 13% in 1909. (38). At Englewood Hospital, the percent of charity patients increased to over 15% in 1919 in comparison to less than 10% in 1912. In Englewood’s case, such an increase in charitable costs was especially difficult since the hospital had no endowment money from which to cover the costs of charitable care. (39)
Government hospitals. Except for Cook County Hospital and the Isolation hospital, archival records could not be located for most government hospitals in Chicago during the 1910s. During the 1910s, Cook County moderately increased admissions from 26,791 in 1910 to 27,095 in 1915 and uptick to 29,418 patient admits in 1918 and back to 26,626 patients in 1920. (40) Presumably, some patients were instructed to go to other public hospital facilities that were quickly set up for the epidemic. For example, admissions at the relatively small Isolation hospital (i.e., contagious diseases) increased from 75 in 1916 to 423 in 1918 and then decreased to 190 in 1920. (41)
Discussion
An influenza epidemic suddenly appeared in the Chicago area in September 1918 and quickly surged to a high number of contagious patients. Although there was little effective care that could be provided outside of comfort and isolation, hospitals had to quickly make a difficult choice. Should they turn back to their community foundation or stand aside as medical science institutions for non-contagious patients?
As archival data indicate, voluntary hospitals in Chicago chose to manage the surge of patients from their neighborhoods. In some cases, their efforts were heroic. Physicians and nurses worked extended hours and hospitals did what they could to provide extra beds for the surge of neighbors that came to their doors. As is noted in archives of Passavant Hospital, “all epidemic patients were admitted, irrespective of their ability to pay.” Although these hospitals might have seen their admittance of poorer, contagious patients as a short-term issue, there is little evidence of this in the archives. Voluntary hospitals continued to provide community-based care during the subsequent waves of the influenza epidemic that occurred in 1919 and 1920. Indeed, well beyond the influenza epidemic, there is additional evidence that voluntary hospitals were heroic in providing for their communities during the Depression years (31).
The active response by Passavant and other voluntary hospitals to the 1918 influenza epidemic served to re-inforce the original community service orientation that led to the quick proliferation of hospitals at the turn of the 20th century. In effect, the epidemic crystallized what it meant to be a voluntary hospital. This identity included the capacity to choose their primary function while maintaining their institutional legitimacy as a community institution (42).
References
1. Toner, J.M. 1873. “Statistics of Regular Medical Associations and Hospitals of the United States,” Journal of the American Medical Association, 24: 314
2. Vogel, M.J. 1980. The Invention of the Modern Hospital: Boston 1870 to 1930. University of Chicago Press.
3. Rosner, D. 1982. “Health Care for the “Truly Needy”: Nineteenth-Century Origins of the Concept,” Millbank Memorial Fund Quarterly, 60 (#3): 355-85.
4. Rosenberg, C.E. 1987. The Care of Strangers: Rise of the American Hospital System. New York: Basic Books.
5. Starr, P. 1982. The Social Transformation of American Medicine. New York: Basic Books.
6. Stevens, R. 1984. In Sickness and in Wealth: American Hospitals in the Twentieth Century. New York: Basic Books.
7. Numbers, R. 1978. Almost Persuaded. Baltimore: Johns Hopkins University Press.
8. Van Sickle, F.J. 1916. “Social Insurance Against Accidents.” Journal of Sociological Medicine, Vol. 17: 292.
9. Report of the Judicial Council. 1913. American Medical Association, Chicago.
10. Klarman, H.A. 1963. Hospital Care in New York City: The Roles of Voluntary and Municipal Hospitals. New York: Columbia University Press.
11. Rosner, D. 1988. “Heterogeneity and Uniformity: Historical Perspectives on the Voluntary Hospital.” Pp. 87-126 in In Sickness and in Health: The Mission of the Voluntary Health Care Institutions, edited by J. David Seay and Bruce C. Vladeck. New York: McGraw-Hill.
12. Cook County Commissioners. 1926-27. “Proceedings of the Board of Commissioners.” Chicago: Cook County.
13. U.S. Bureau of the Census. 1904 and 1910. Survey of Benevolent Institutions. Washington D.C.: Government Printing Office.
14. Patterson, K.D. and Pyle, G.F. 1991 “The Geography and Mortality of the 1918 Influenza Pandemic,” Bulletin of the History of Medicine, 65, #1 (Spring): 4-22.
15. Chicago Tribune. 1918. “Grip Shuts off Jackie Liberty at Great Lakes.” September 20.
16. Ruth, D.E. 1991. “Don’t Shake–Salute!” Chicago History, XIX, #3-4 (Fall, 1990 & Winter, 1991): 4-23.
17. Chicago Tribune. 1918. “You Can’t Smoke on Street Cars till Flu End” and “Influenza Shuts All Chicago.” October 13.
18. Chicago Tribune. 1918. “Churches Open, But Influenza Reduced Crowds.” October 21.
19. Chicago Tribune. 1918. “Flue Epidemic Passing; Death Rate Declines.” October 26.
20. Fishbein, M. 1969. Morris Fishbein, MD: An Autobiography. New York: Doubleday.
21. Journal of the American Medical Association. 1918. “Serums and Vaccines in Influenza” Page 1408, Editorial. October 26.
22. Chicago Tribune. 1918. “Chicago Gets Vaccine to Aid in “Flue” Fight.” October 21.
23. Chicago Tribune. 1918. “Wouldst Dance? Then Snooze as J. Dill Snoozes.” November 2.
24. Chicago Tribune. 2014. “Flashback 1918: Influenza Epidemic Struck Hard, Fast.” R. Grossman, October 18.
25. Robertson, J.D. 1919. Report and Handbook of the Department of Health of the City of Chicago for the Years 1911 to 1918 Inclusive. City of Chicago.
26. Fifield, J.C. 1933. American and Canadian Hospitals. Chicago: American Hospital Association.
27. Chicago Medical Society. 1905-1953. Blue Book. Bulletin of the Chicago Medical Society.
28. Chicago Medical Society. 1922. History of Medicine and Surgery: Physicians and Surgeons in Chicago. Chicago: Biographical Publishing Co.
29. American Hospital Association. Annual Survey of Hospitals. Chicago: American Hospital Association (1920-90).
30. Bonner, T. 1957. Medicine in Chicago, 1850-1950. Madison, WI: The American History Research Center.
31. Gifford, BD. 1993. Community and Organizational Change: The Development of Chicago’s General Care Hospitals from 1910 to 1960. PhD dissertation (sociology). U. of Chicago.
32. Sisters of Poor Handmaids of Jesus Christ. 1920. Annual Report, St. Elizabeth’s Hospitals, Notre Dame University archives.
33. Gordon, S. 1985. No Service To Small: Mercy Hospital. Random Books, Chicago.
34. Bowman, J. 1987. Good Medicine: The First 150 Years of Rush-Presbyterian-St. Luke’s Medical Center. Chicago: Chicago Review Press.
35. Lutheran Deaconess Hospitals Archives, Park Ridge, Illinois.
36. Passavant Hospital Archives, Northwestern University.
37. Gifford, BD. 1991. Conversation with Michael Turnoff and Dr. Peter Friedman, Jewish Foundation of Chicago, February 2.
38. Grant Hospital Archives, Chicago.
39. Englewood Hospital Archives, Chicago.
40. Cook County Hospital Archives, Chicago.
41. Sisters of Poor Handmaids of Jesus Christ. 1920. Annual Report, Isolation Hospital – Chicago, Notre Dame University archives.
42. Friedland, R. and Alford, R. 1990. “Bringing Society Back In: Symbols, Practices, and Institutional Contradictions,” Pp. 232-66 in The New Institutionalism in Organizational Analysis edited by Woodrow Powell and Paul DiMaggio. Chicago: University of Chicago Press.