HMPI

Innovation in the Public Sector: The Costa Rican Primary Healthcare Model

Andrea Prado, Associate Professor, INCAE Business School; Priscilla Rodríguez, MBA, Senior Researcher, INCAE Business School; Alvaro Salas, MD, Professor, University of Costa Rica, Former President, Caja Costarricense de Seguro Social

Contact: Andrea Prado andrea.prado@incae.edu

Abstract

What is the message?

This case explores the key antecedents and development of the Costa Rican primary health model.

What is the evidence?

Costa Rican health indicators are comparable to those in OECD countries.  A life expectancy of 79.9 years and a primary-level coverage of more than 90 percent can be used to demonstrate the success of the country’s primary healthcare model.

Submitted: October 2, 2019; accepted after review October 23, 2019.

Cite as: Andrea Prado, Priscilla Rodríguez, Alvaro Salas. 2019. Innovation in the Public Sector: The Costa Rican Primary Healthcare Model. Health Management Policy and Innovation, Volume 4, Issue 2.

Overview

The Caja Costarricense de Seguro Social (CCSS) is the most important healthcare provider in Costa Rica.  In 2019, it received the United Nations Public Service Award for the implementation of its digital medical records, known as EDUS, in 100 percent of its facilities.2 EDUS is the latest in a series of healthcare innovations—many of them at the organizational level—encouraged by the Costa Rican government.  Organizational innovations, often more than technological improvements, are responsible for dramatic cost reductions and value creation.3 Thus, scholars are strongly promoting health policies that encourage various types of organizational innovations.4

This case reviews the Costa Rican public healthcare system, particularly its innovative primary health care model that was launched in 1994.  We discuss key antecedents and public policy decisions that allowed the EBAIS (Equipos de Atención Básica en Salud) model to become a successful organizational innovation.5,6 We analyze this model’s financial structure, as well as some of its main outcomes to date.  The paper concludes by identifying takeaways for achieving high-quality universal health coverage, established as a priority among the United Nations Sustainable Development Goals for 2030.

The Evolution of Healthcare in Costa Rica

Current status

Costa Rica is a small country in Central America (51,100 sq. km) with a 2018 population of approximately five million.  The country has a strong democratic tradition and abolished its army in 1948.  Although Costa Rica is a middle-income country (about $16,900 GDP per capita in 2019), its social outcomes are comparable to those in high-income countries.1 For instance, Costa Rica has the second-highest life expectancy (79.9 years) in the Western Hemisphere—even longer than in the USA7.  Maternal mortality (27 per 100,000 live births) and infant mortality (7.6 per 1,000 live births) rates are low compared to other Latin American countries and have been consistently decreasing for more than two decades.7

The country has broad-based access to healthcare services. In 2018, over 93 percent of the population had access to primary healthcare. It ranked high on the Healthcare Access and Quality index compared to nearby countries8 and was in the top ten percent in effective primary healthcare coverage among low- and middle-income countries.  By 2019, even Costa Ricans in the lowest income quintiles could access full medical services at very low cost.9 The country achieved these results despite spending less on healthcare—per capita and as a percentage of GDP—than the world average.7

Only a few decades ago, Costa Rica exhibited poor health indicators.  As recently as 1970, the infant mortality rate was 61.5 per 1,000 live births, and life expectancy was 65 years.10 The road to improvement needed to overcome barriers arising from economic conditions, both international and national, as well as political opposition from multiple interest groups.

Despite the challenges, the country achieved strong improvements, starting in the 1970s and continuing through the 1980s. In 1978, Costa Rica was praised at the Alma-Ata Declaration meeting for its achievements in primary healthcare.  The Ministry of Health and the CCSS carried out policies that promoted organizational innovation. These polices, which were implemented consistently by multiple government parties through different time periods, led to health indicators comparable to those in developed countries.

Historical initiatives: 1920s to 1970s

The Ministry and Caja have long histories. The Ministry of Health was founded in 1922 with the responsibility for public health and provision of basic primary healthcare.11 The CCSS, was founded in 1941 to provide health and pension benefits to manual laborers and white-collar workers living in urban areas.

The evolving role of the CCSS is particularly important. The agency started with no services of its own, so outsourced them to the hospitals owned by the Junta de Protección Social, the national lottery organization that financed the Ministry of Health.  At that time, only a small part of the population had access to health care, and the poor rural areas were badly neglected. During the first two to three decades after its creation, the CCSS was in a consolidation period as it sought to address this major gap.  While it was attempting to extend its coverage to spouses and dependent children, the CCSS faced numerous challenges, including resistance by interest groups such as medical associations as well as political turbulence arising from the birth of the social democratic movement and armed intervention in 1948.10,12

The 1970s then provided a base of strong political commitment through two governments led by the social democratic party. This period was marked by a strong public investment in health, reaching seven percent of GDP.10 In 1973, the CCSS assumed control over the facilities of the Ministry of Health, including first-line health service establishments that provided users with their first contact points for healthcare. In doing so, the CCSS became the sole delivery institution of public hospital care, with 29 facilities around the country.13

The Ministry of Health, by contrast, focused on primary healthcare, including prevention of disease and promotion of health, now emphasizing rural areas and marginal communities. This transformation of the Ministry of Health as the leader in community health programs during the 1970s provided the building blocks of the country’s primary healthcare model developed in the 1990s. Moreover, some public health leaders consider this organizational innovation in Costa Rica as an antecedent of the policy that the World Health Organization (WHO) promoted worldwide, known as “Health for All by 2000.”10

Community health programs during the 1960s and 1970s

Several programs launched in the 1960s provided a basis for these improvements in health access in rural communities. Even before the 1960s, the Rockefeller Foundation supported efforts to implement community health programs, including antiparasitic and antimalarial campaigns. In addition, mobile assistance units and Health and Development Committees led by community members were financed by the Alliance for Progress, an initiative of U.S. President John F. Kennedy to promote economic, political, and social development in Latin America during the 1960s.10

Mobile assistance units in Costa Rica consisted of teams—a doctor, a nurse auxiliary, a sanitary inspector, and a driver—that visited rural towns on a monthly basis and provided free health consultations and educational talks to the inhabitants. Before leaving town, the doctor would meet with the community’s Health and Development Committee for a discussion of conditions that affected the residents’ health, such as water quality, waste and excrement management, and access to roads. Some of these discussions led to improvements. For instance, some communities organized to build an aqueduct as a result of these meetings.  Health indicators showed a clear improvement during this initiative, and the Ministry gathered valuable household census data from the field visits. However, the program was short-lived; the mobile assistance units declined when international funding dried up.

The antimalarial program, by contrast, lasted longer and reached greater scale. The program expanded across the country during the 1960s.  Then, due to its success in eradicating malaria, the program ended at the beginning of the 1970s.

The end of the antimalarial program left time availability among Ministry employees, who had been responsible for applying the pesticide dicophane (DDT) throughout the country.  Despite strong resistance from health professionals in multiple institutions, the Ministry converted these workers into community health promoters by training them to deliver preventive health actions.10 For instance, both doctors’ and nurses’ professional colleges strongly opposed this proposal, arguing that only their trained members should be entitled to provide health services. Politically, however, the supporters of this proposal viewed it as a key complement to broad-based Social Security programs.

A financing law approved in 1974 that charged a five-percent tax on all payrolls allowed the government to massively extend the rural and community health programs.  As much as 60 percent of the revenues generated were assigned to social initiatives such as child nutrition programs, clean drinking water, social housing, and immunization campaigns.

For instance, the Ministry created the CEN (Centros de Educación y Nutrición), CINAI (Centros Infantiles de Nutrición y Atención Integral) and CENCE (Centros de Educación y Nutrición y Comedor Escolar), a network of facilities that offered child care and protection services for children under age 13, for eight to 12 hours per day. In these facilities, children and pregnant women received free food and education.  The Ministry delivered its health services through two types of centers: sanitary units around the country focused on parasitosis and maternal care, while health posts were small stations served by communitarian health assistants; there were no medical professionals at these posts. The assistants’ main duties were to provide preventive medicine and health education in communities with fewer than 2,000 inhabitants.10 Ill patients who arrived at health posts with complex diseases were referred to health centers for treatment.  These centers belonged to the CCSS and offered their services through doctors, medical auxiliaries, nurses, and other professionals, such as dentists.

Daniel Oduber, the country’s president from 1974 to 1978, would say regarding government social investment: “Where health goes, everything else follows.”  The rural health program’s coverage increased from 11 percent of the rural population with 50 health posts at the start of the program in 1973 to 60 percent with 301 posts in 1983.10

The gains during the 1970s were highly visible. Participants in the World Health Organization International Conference on Primary Health Care in September 1978 praised the Costa Rican rural and communitarian program.  The Costa Rican representatives at the conference shared data showing that the country had achieved two years earlier (i.e., 1976) the goals that WHO had proposed for all members to reach by year 2000.14 The Ministry’s efforts through this program, as well as the legal restructuring to extend the coverage—outside of urban areas and to the non-working population—had resulted in the universalization of the health system.  It was an exceptional achievement.10 By the end of the 1970s, in the entire western hemisphere, only Canada and Cuba had achieved the goal of universal health services.

Crisis: Mid-1970s to mid-1980s

Most of the social initiatives coordinated by the Ministry of Health and responsible for the results in terms of health indicators were financed by payroll taxes. In the late 1970s and early 1980s, Costa Rica found itself in an economic crisis generated by three main forces.  First, a world crisis at that time had its largest effect on poor countries.  Second, a new government came into power, with no clear vision or leadership for the health sector.  Third, a neoliberal ideology took hold in the country.10 The net effect of these factors was that the Ministry discontinued its efforts to strengthen the rural and community health program, due mainly to budgetary limitations. The program’s annual budget went from 9.5 percent of GDP in 1976 to a 2.4 percent in 1986.10 The cutbacks in the program resulted in low public satisfaction and reduced quality of care.

The CCSS also faced one of its worst crises in the late 1970s and early 1980s.  In 1979, it exhibited its first deficit.  Between 1978 and 1982, despite maintaining the same infrastructure, the CCSS hired 40 percent more personnel.  The growth in employment increased the financial deficit, even as the CCSS continued to offer essentially the same services.  The losses led to the creation of the country’s Development Plan for 1982-1986. This plan emphasized the need to consolidate a National Health System that avoided duplicate efforts by the Ministry of Health and the CCSS. As a result, substantial improvements took hold over the next decade.

From dividing to combining responsibilities: Late 1980s and early 1990s

By the end of the 1980s, the division of responsibilities seemed to be working. The CCSS focused mainly on curative care and rehabilitation, while the Ministry focused on prevention of disease and promotion of health.  Even with the Ministry and CCSS focusing on different aspects of healthcare, important challenges remained. There was still duplication in the processes and inefficiencies within and between the institutions. In addition, pressure from international organizations pointed towards reducing the size of public employment, such as the Ministry’s payroll.  Thus, in 1994, Costa Rica undertook a major reform of its healthcare system by transferring the responsibilities of the Ministry to the CCSS.

The CCSS gained 2,325 new employees,6 creating challenges in dealing with bureaucratic integration processes and ideological differences across the combined agencies. Ministry officials had serious concerns about this move, arguing that public health was underrepresented in a more curative-oriented institution such as the CCSS.  Nonetheless, creating the CCSS as an integrated agency that championed both public health and preventive services contributed to an organizational innovation in the form of a new primary health care model.

This primary healthcare innovation fit perfectly into the health sector reform during the 1990s.  Two key pillars of the reform were emphasis on integrated care and strengthening the primary level of care.  Integrated attention encompassed services that provide curative care, prevent disease, rehabilitate when necessary, and promote health through lifestyles and nutrition.15 By strengthening the primary level of care, the reform sought to modernize what had proven effective in the Ministry’s program: first contact with the user, thus opening the door into the system.15

Creation of the EBAIS: 1995 and into the 2000s

The reform involved a national movement to expand health coverage. The basis of the new primary health care model was the Equipos Básicos de Atención Integral en Salud, an organizational innovation consisting of health centers with multidisciplinary teams located across the entire country.  The first EBAIS was launched 1995. Within ten years, Costa Rica had implemented a new national primary healthcare system.6

Differentiated teams

The EBAIS model is centered on the notion that prevention, promotion, curation, and rehabilitation are equally important. Each EBAIS had a multidisciplinary team consisting of at least one doctor, a nursing assistant, a technical assistant (asistente técnico de atención primaria, similar to a community health worker), a medical clerk (registros y estadísticas de la salud), and a pharmacist.6

Team members have differentiated tasks. Doctors deliver curative and preventive care, such as managing acute and chronic conditions, diagnosis and treatment. Nurses are responsible for basic clinical tasks and health counseling.  The pharmacist prescribes medication.  The technical assistant engages in health promotion and disease prevention activities; inspection of basic housing conditions and sanitation, epidemiological data collection, identification of environmental and familial behavioral risk factors and referrals to EBAIS or hospitals.Unlike the physicians and nurses, the technical assistant conducts her activities outside of the clinics, either through individual home visits or group visits in community settings such as schools, churches, and town centers.6  Finally, the medical clerk takes charge of records and statistics at the facility and is responsible for patient intake, collecting and managing patient data, and epidemiological population health surveillance.6

The CCSS assigns households to an EBAIS through a strategic geographic division of the territory, often referred to as empanelment or sectorization process.  Each facility is meant to serve approximately 5,000 people. All households are geographically empaneled in the EBAIS model, which helps to explain its high coverage rate—reaching 94 percent of the population by 2018. The sectorization process has been key to expanding the coverage of primary healthcare throughout the country.  Its success can be attributed to the fact that it went beyond assigning households to EBAIS on a map, as an office exercise.  In the field, EBAIS teams had their assigned households clearly identified (e.g., location and socioeconomical profile of their members) and performed epidemiological surveillance through home visits.  Thus, sectorization allowed the CCSS to effectively include households within the system, significantly increasing its health coverage.

Three benefits of EBAIS empanelment for users stand out: Users receive first-contact access, the ratio of patients to clinicians is manageable, and care is continuous.6 The technical assistants at the EBAIS are crucial in this process, as they visit households regularly and provide first-contact care for users. They record household data in a family file, including a risk score that determines the frequency of future home visits.6 Indeed, it is due the work of these technical assistants that the CCSS has been able gain access to each household served by a single EBAIS. By 2017, 1,042 EBAIS were providing primary-level care to the people of Costa Rica.16

System integration 

EBAIS are integrated into a network structure with the rest of the health system, which includes general and specialized hospitals and clinics. If a patient needs specialized medical attention beyond primary care—not available at the EBAIS—the CCSS has 20 regional and peripheral hospitals that provide secondary care.  These hospitals are spread across the country for geographic accessibility. Additionally, the CCSS has three general national hospitals in the capital city, which offer a third level of attention. The agency also has six specialized establishments concentrated in the central valley region that provide tertiary care.

This network structure embodies an integrated system. All national, specialized, and regional hospitals, plus the EBAIS, function as a network model that is articulated horizontally and vertically. With the multi-party integration, patients can navigate the network through a reference and counter-reference system and receive the attention required.16

Funding the EBAIS system

Costa Rica’s healthcare system aims for contributive solidarity, meaning broad-based financial support.11 CCSS health insurance is financed by a 15-percent payroll tax towards which employers, employees, and the government contribute 9.25 percent, 5.5 percent, and 0.25 percent respectively.5,17 All workers in the country, including the self-employed, are obligated to contribute.17 Contributions for unemployed people are covered by the government, drawing on taxes on luxury goods that are transferred to the CCSS to cover low-income families’ healthcare.18

Outcomes of the EBAIS reform

Achieving this universal primary healthcare system was challenging. Decisions such as merging the Ministry of Health with the CCSS and implementing the innovative EBAIS model required strong political will and commitment from the government.  The decisions also required compromises from the institutions involved to facilitate the integration and allow the new model to consolidate.

Nonetheless, looking back on the results obtained during the past five decades, the efforts led to broad-based healthcare services.  By 2012, the lowest quintile of the population, who receive only 4.7 percent of national income, received nearly 30 percent of all health expenditures, while the wealthiest quintile, generating 48 percent of the national income, received 11 percent of CCSS resources.17 Hence, in addition to system solidarity in funding, those who are less privileged benefit most from the system.

Coverage statistics are striking. From 1995 to 2001, the number of EBAIS teams increased from zero to 736 clinics, covering 80 percent of the population.19 In 2017, over 93 percent of the population had access to primary healthcare.6

Health indicators improved significantly after the 1994 reform.  As we reported earlier, life expectancy at birth increased in more than three years after 1995 to eventually reach 79.9 years in 2017, about the level of the OECD average of 80.2 years.7 Key indicators such as maternal mortality, infant mortality, and deaths from infectious diseases have also experienced continuous improvement since 1995.

Nonetheless, major challenges remain. Non-communicable chronic diseases are now the most common burden of disease among the Costa Rican population17 and are estimated to account for 83 percent of all deaths in the country.20  For instance, the incidence of deaths caused by ischemic heart disease and stroke increased by 63 percent and 78 percent, respectively, between 2007 and 2017.21  The EBAIS system offers a platform to address this challenge, by promoting preventive efforts, healthy lifestyles, and follow-up to chronic care services.

Lessons Learned

The consolidation of the Costa Rican primary healthcare system within the EBAIS, building on the history of Ministry of Health and CCSS initiatives, offers lessons for countries interested in strengthening their first level of attention to health and healthcare needs.  In discussing lessons learned, it is important to emphasize that health is both a leadership and a political issue.  None of these results would have been achieved without the commitment and determination of visionary leaders who constantly had to overcome strong resistance from multiple interest groups, including pressure from international organizations to follow the conventional wisdom of development approaches.

Three organizational features of the EBAIS model allowed it to consolidate and achieve its results. First is the multidisciplinary nature of the EBAIS teams that are trained to provide not only curative, but also preventive and promotional activities at the first point of contact with the system’s users.  Such early contact reduces costs for the system, for example, by making early diagnoses and providing users with faster access to basic services.  It is important that the EBAIS team reaches out to the assigned population through household visits and community events, rather than waiting for patients to come into the clinic.  In addition, there is high value in having a team member in charge of the data collection and analysis, which provides inputs for decision-making and for monitoring the population’s needs.

Second, the geographic empanelment feature is crucial.  Distributing primary care facilities so that all households are assigned to a facility allows the system to have a high coverage rate, thus providing access to services for almost all the population.  Some countries have tried such community assignments, though typically not at the nationally-distributed level, with broad-based inclusion of rural areas.  Other countries have empaneled households in a geographic area but more as a theoretical exercise than as an effective practice in the field.  In this regard, the role played by the technical assistant in the EBAIS model is key to reaching out to community members by collecting their epidemiological and socioeconomic data and monitoring their condition, promoting healthy behaviors, and preventing diseases, among other things.  Visiting individual homes or meeting households in community settings, instead of waiting for individuals to visit the EBAIS, often when they get sick, strengthens the effectiveness of the model’s empanelment feature.

Third, the network structure that combines hospital services with the primary level of care is critical.  Without a reference and counter-reference system, EBAIS patients would not have access to more-complex treatments at the secondary or tertiary level.  This distributed integration means that patients gain services both at the point of initial care and over the life cycle of their medical needs.

Certainly, providing high healthcare coverage generates challenges to the health system.  For instance, ensuring that all citizens have first-care access has substantially increased the volume of referrals to secondary and third-level hospitals.  In the last decade, long waiting times for specialized medical consultations or surgical procedures has negatively affected patient satisfaction and imposed administrative pressures on the institutions.  As an example, more than 40 percent of patients in need of treatment for prostatic hyperplasia in 2017 had a waiting time greater than 366 days; for cataracts, this percentage was 30 percent.  Thus, health systems seeking to strengthen their primary care systems also need to anticipate how patients can effectively navigate higher levels of medical care.  Coordinating health institutions through an effective network approach constitutes a necessary organizational innovation to support strong primary care systems.

Looking ahead, the EBAIS model is now providing a platform to address current epidemiological challenges of non-communicable diseases.  Critically, the EDUS digital records system can combine with the EBAIS, using household and individual data that are now available in a single medical record that can be accessed from anywhere in the system.  The EBAIS and EDUS, working together, have the potential to create another powerful organizational innovation in the Costa Rican healthcare system.

References

1 Social Progress Imperative (2018). Social Progress Index. Retrieved September 16th, 2019, from https://www.socialprogress.org/

2 United Nations (2019, June 21). UN recognizes public institution-led initiatives in 11 countries that are advancing Sustainable Development Goals. Retrieved September 16th, 2019, from UN: https://www.un.org/development/desa/en/

3 Richman, B., Mitchell, W., & Schulman, K. (2013). Organizational Innovation in Health Care. Health Management, Policy and Innovation, 1(3):36-44.

4 Porter, M., Teisberg, E. (2006). Redefiningh Health Care: Creating Value-Based Competition on Results. Boston, Massachusetts.: Harvard Business School Press.

5 Cuccia, L., Chadwick, J., Hassam, A., Kim, A., Sivarajan, R., & Wong, V. (2019). Costa Rica’s Health Care Reform: Impact and Success of the EBAIS model. The Prognosis, 8(1):24-35.

6 Pesec, M., Ratcliffe, H., Karlage, A., Hirschhorn, L., Gawande, A., & Bitton, A. (2017). Primary Health Care That Works: The Costa Rican Experience. Health Affairs, 36(3):531-538.

7 World Bank Group (2019). Indicators. Retrieved September 16th, 2019, from World Bank: https://data.worldbank.org/indicator

8 GBD 2015 Healthcare Access & Quality Collaborators (2017). Healthcare Access and Quality Index based on mortality from causes amenable to personal health care in 195 countries and territories, 1990–2015: a novel analysis from the Global Burden of Disease Study 2015. The Lancet, 390:231-66

9 Caja Costarricense de Seguro Social (2018). Informe de Resultados de la Evaluación de la Prestación de Servicios de Salud 2017 [Results Report of the Evaluation of the Provision of Health Services 2017]. San José: Editorial Nacional de Salud y Seguridad Social.

10 Miranda, G. (1988). La Seguridad Social y el Desarrollo en Costa Rica [Social Security and Development in Costa Rica]. San José: Caja Costarricense de Seguro Social.

11 Vargas, J. R., & Muiser, J. (2013). Promoting universal financial protection: a policy analysis of universal health coverage. Health Research Policy and Systems, 11:28.

12 Homedes, N., & Ugalde, A. (2002). Privatización de los servicios de salud: Las experiencias de Chile y Costa Rica [Privatization of health services: The experience of Chile and Costa Rica]. Gaceta Sanitaria, 16:54-62.

13 Unger, J.P., De Paepe, P., Buitron, R., & Soors, W. (2008). Costa Rica: Achievements of a heterodox health policy. American Journal of Public Health, 98(4):636-643.

14 Morgan, L. (1990). International Politics and Primary Health Care in Costa Rica. Social Science & Medicine. 30(2):211-219.

15 Salas, A. (1998). Caja Costarricense de Seguro Social: Presente y Futuro [CCSS: Present and Future]. San José: Caja Costarricense de Seguro Social.

16 Caja Costarricense de Seguro Social (2018). Memoria Institucional 2017. San José: Caja Costarricense de Seguro Social.

17 Montenegro, F. (2013). Costa Rica Case Study: primary health care achievements and challenges within the framework of the social health insurance. Washington D.C.: The World Bank.

18 Cercone, J., & Pacheco Jiménez, J. (2008). Costa Rica Good Practice in expanding health care coverage. In W. Bank, Good Practices in Health Financing: Lessons from reforms in low- and middle-income countries (pp. 183-225). Washington D.C.: The World Bank.

19 Clark, M. (2002). Health Sector Reform in Costa Rica: Reinforcing a Public System. Washington D.C.: Wilson Center

20 World Health Organization (2016). Countries: Costa Rica. Retrieved September 26th, 2019, from WHO: http://www.who.int/nmh/countries/cri_en.pdf

21 Institute for Health Metrics and Evaluation (2017). Country Profile: Costa Rica. Retrieved September 26th, 2019, from https://www.healthdata.org/

Identifying and Solving the Problem of Poor-Quality Drugs

Elizabeth Ndichu, MD, Duke Global Health Institute, Duke University School of Medicine, and Kevin Schulman, MD, Clinical Excellence Research Center, Department of Medicine, Stanford University

Contact: Elizabeth Ndichu, elizabethndichu@gmail.com

Abstract

What is the message?

Sampling retail pharmacy outlets, we were able to identify the high prevalence of poor-quality drugs (drugs that are mislabeled in terms of the amount of active medication or drugs that have high levels of impurities). We discuss potential market and regulatory solutions to addressing our findings.

What is the evidence?

We collected primary evidence on the prevalence of poor-quality medications across regions of one market. We examined factors related to the prevalence of poor-quality drugs including socioeconomic status of the neighborhood and the retail price of the product. Overall, we were struck that none of these factors were related to the prevalence of poor-quality medicines. We then explored how a range of interventions across the supply chain could help address the findings from our study.

Submitted: November 8, 2018; accepted after review: December 20, 2018.

Cite as: Elizabeth Ndichu, Kevin Schulman. 2019. Identifying and Solving the Problem Of Poor Quality Drugs. Health Management Policy and Innovation, Volume 4, Issue 2.

Introduction

Since the invention of modern medicine, the development and sale of pharmaceutical products has become widespread – and with the diffusion comes the problem of poor-quality drugs.  Although many measures have sought to curb quality problems, trade in poor-quality drugs is still rife globally. Indeed, a pandemic of poor-quality drugs threatens both international trade and the health of populations. (1)(2)(3)

What constitutes poor-quality drugs? The World Health Organization (WHO) and others use a wide range of terms, including substandard genuine products that fail to meet pharmaceutical specifications, falsely labelled products that do not contain the ingredients claimed in their packaging, falsified products that misrepresent identity or source, and counterfeit drugs with or without appropriate active pharmaceutical ingredients (APIs) that are presented in inauthentic packaging. (4) (5) In this discussion, we will use two terms: falsely labelled and substandard. Falsely labelled drugs have excessively high or low amounts of APIs, while substandard drugs have high levels of impurities. In turn, we refer to drugs that are either falsely labelled or substandard as poor-quality drugs.

The scope of the problem of poor-quality drugs transcends national borders because the manufacturing and supply chain of medical products thrives in an international market.(6) Drugs manufactured in China, India, North America, and Europe, for instance, are often distributed and consumed throughout the world.

Are false labeling and/or impurities common?

In a bid to get a better understanding of the magnitude of the problem of poor-quality drugs, we carried out an analytic study in Lagos State, the second most populous state in Nigeria(7). Our aim was to identify the prevalence of poor-quality drugs and to investigate any association with socioeconomic status or drug pricing.  With the rising number of premature deaths due to non-communicable chronic diseases, we sampled nifedipine, a drug used in the management of chronic hypertension, including management of angina, high blood pressure, Raynaud’s phenomenon, and premature labor. The drug is sold with the brand name Adalat, among others.

Using High Performance Liquid Chromatography (HPLC) in a lab at Campbell University in the U.S., we assessed the quality of drugs sold by drug stories in six Local Government Areas (LGAs) of Lagos State, Nigeria. Three of the LGAs have high socioeconomic status and three have low socioeconomic status. Within the 102 samples we collected, there were substantial issues with both false labelling and substandard quality.

False labelling: Unfortunately, false labelling was common, including 29.4% (30) of the samples. Based on the international pharmacopeia standards, the nifedipine API fell below the U.S. Food and Drug Administration (FDA) and USP lower limit of 90% in 29 cases and above the limit of 110% in one case. Of the 30 falsely labelled drugs, 56.7% (17) came from low socioeconomic status areas and 43.3% (13) from high economic status areas, showing that the issue occurs across economic classes.

Impurities: Impurities were even more common. Nifedipine nitrophenylpyridine analog impurities, which constitutes one of the two major impurities found in nifedipine tablets, exceeded the 2.0% specification in 74.5% (76) of the samples.(8)  Of the drugs with high levels of impurities, unlike the falsely labelled cases, a higher proportion 40 (52.6%) came from high socioeconomic status areas and 36 (47.4%) were from low socioeconomic status LGAs.  Again, then the issue spans economic status.

Pricing: We did not observe a difference in pricing between good and poor-quality nifedipine drug samples. Thus, it is not that the market could not support the cost of high-quality drugs. Instead, it is a market failure that consumers cannot demand high-quality products when they fill their prescriptions.

How might this affect health?

Impurities and false labelling can cause unwanted pharmacological and toxicological effects. Impurities can produce end-organ damage such as renal and liver failure. False labeling can lead to precipitated disease progression which in turn results in negative physiologic effects and treatment failure.(9) Non-communicable diseases such as hypertension are major killers in low- and middle-income countries (LMICs) – without good-quality drugs the management of these patients will be more complex and as a result, the number of deaths due to NCD’s will continue to increase. Moreover, the negative impact on health of poor-quality medicines imposes financial costs on consumers, which further reduces health seeking behavior and causes more premature deaths.(10)(11)

Fraud or poor manufacturing control?

A key question is whether the poor quality results from intentional fraud or from poor control of manufacturing. If the drugs were produced by fraudulent manufacturers, we would expect to find extremely high levels of impurities, with very low or complete lack of appropriate APIs. In our study, though, all samples had the right API, suggesting that the drugs came from legitimate manufacturers.

Clearly, we cannot rule out the possibility that fraudulent manufacturers produced some of the samples collected. Beyond visual inspection of the packaging, we were not able to measure the packaging, weigh the tablets and packets, scan packaging, or benchmark the products against original manufacturer products. Nonetheless, the most likely source of most of the problems appears to be manufacturing issues rather than intentional fraud.

What can be done and who needs to do it?

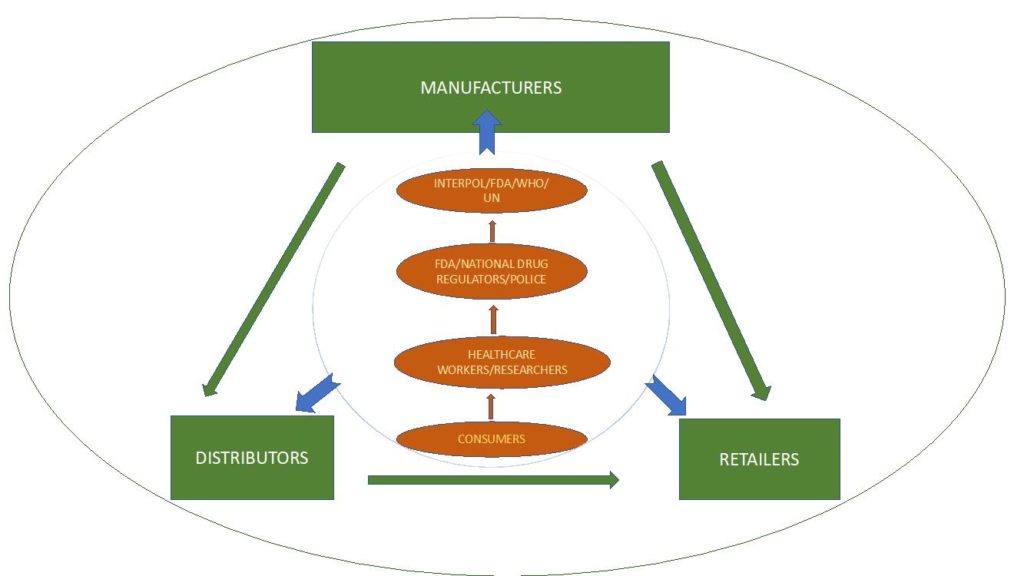
Trade in poor-quality drugs affects both traders and patients. Traders face reputational and financial risks from selling poor-quality products. Most critically, patients might follow management plans laid out by their providers only to suffer from the use of poor-quality drugs. We propose solutions to the problem of poor-quality drugs aimed at the full pharmaceutical value chain: consumers and clinicians; supply chain stakeholders including manufacturers, distributors, and retailers; and regulators.  Figure 1 below illustrates the complex regulatory environment of the pharmaceutical supply chain.

Consumers and clinicians

Our findings provide evidence that consumers and healthcare providers need to create a demand for better quality products. Although clinicians are often at the forefront of identifying poor-quality drugs in the course of their practice, empowering patients to take charge of the investigation of the pharmaceutical supply chain is a cornerstone of tackling this problem from the demand side.

The first step in engaging patients and clinicians would be to raise awareness of this issue using mass media and the medical literature. Health education on the prevalence of poor-quality drugs will aid in engaging consumers in the fight against poor-quality drugs. From investigation of drug packaging to presentation of drug samples, encouraging consumers to provide suspicious samples to specified local public health officers, clinicians, researchers, and the police would increase the capacity of preexisting regulatory bodies and create a sense of ownership among users of pharmaceutical products. Leveraging mobile phone technology can create avenues for consumers to report suspicious products to regulatory bodies responsible for drug control, local police, researchers and health care workers. Such steps will result in visible demand for better products as retailers and other stakeholders in the pharmaceutical supply chain will be aware their goods are under close investigation.

If consumers and clinicians were informed on the extent of the problem, they could demand that pharmacies certify the quality of their products which could reverberate throughout the supply chain. Local newspapers could replicate studies like ours to help drive consumer engagement. Encouraging patients and clinicians to report adverse events emanating from consumption of substandard products will also aid in dramatizing the effects of poor-quality drugs.

Supply chain stakeholders

The pharmaceutical supply chain includes manufacturers, distributors, and retailers. Each of these critical market stages can be used to provide information about drug samples from production to consumption.

Manufacturers: Manufacturers should be held accountable through public and private regulatory schemes to ensuring that the products produced meet international quality control standards. In some cases, countries can inspect facilities with their own staff. Many LMICs, though, lack the ability to carry out inspection of international or even domestic facilities. In such cases, countries can leverage inspections by the U.S. FDA, European Medicines Agency (EMA), the WHO, and others. When facilities fail such international inspections, countries that lack their own inspectors can refuse sales from those facilities until they pass the international standards.

Producers also have a proactive role. Manufacturers can work toward building common quality databases with information about their products that can be made available to other stakeholders of the pharmaceutical supply chain as well as the public. This will ensure that awareness is raised on the quality of drugs and help create a transparent trading environment. Specific to the final product, manufacturers can employ basic technical solutions such as holograms, barcodes, and scratch-off numbers that can be used to uniquely identify authentic products.(1) Such fieldable solutions on packaging have been shown to play a key role in strengthening the security of the pharmaceutical supply chain, particularly in low resource settings. Such transparency will enable manufacturers of high-quality medicines to differentiate their products (differentiation would allow manufacturers to obtain both sales and price advantages in the market).

Distributors: Similar to manufacturers, distributors carry a significant responsibility in ensuring the quality of drug products. They could conduct their own testing on products to ensure their quality before they enter the local supply chain. Again, they could do this in a way that is transparent to consumers to help drive markets away from poor quality drug products.

In turn, distributors could maintain a database of production records, which can help sustain a transparent drug distribution system. Collaborating and sharing data adds depth to the understanding of the problem of poor-quality drugs since most traders target a wide range of products from varying companies. Distributors should also work to honor domestic and international licensing requirements. Such steps will work to the benefit of honest and effective distributors, helping drive out ineffectual and dishonest firms.

Retailers: Lastly, retailers are critical in ensuring the security of the pharmaceutical supply chain. Stocking only certified products is one major way in which they could drive up the quality of medications in the market. Pharmacists could also help inform consumers of their efforts to improve the quality of products they provide — and drive up their own sales by offering higher quality products to consumers.

Like their predecessors in the supply chain, retailers should work to ensure transparency on the quality of the medicines they stock. They should also work with local authorities, researchers, and the public at large to allow easy assessment of the pharmaceutical products being traded. Retailers should also vet the distributors and manufacturers they work with as a way of creating demand for good quality medicines.

Regulatory bodies

It is crucial to ensure manufacturing processes are well regulated and monitored as a means of addressing poor quality in manufacturing (our major finding) and also as a means of addressing fraudulent products (which is a considerable concern but not the subject of our study).

At the international level, regulatory bodies should collaborate and have common guidelines to help oversee the trade of drug products. As we discussed, we found that some manufacturers can produce high-quality products at the prevailing market price. Thus, one focus from a regulatory perspective would be to encourage all manufacturers to meet the same high-quality of manufacturing. Our evidence of the feasibility of achieving this quality standard in the retail market in Lagos should be a strong incentive for regulatory enforcement.

Most poor-quality products in our study were imported into the local market. Organizations such as INTERPOL, the WHO, the U.S. FDA, United Nations Office on Drugs and Crime, and the World Customs Organization should work cohesively in combating the trade of poor quality drugs. One major distinction is between poor manufacturing quality (a civil concern) and counterfeit products (a criminal concern). The regulatory bodies with jurisdiction for these two types of poor-quality products may or may not overlap, which is a challenge. Together, however, these organizations have a mandate to raise awareness across various countries about falsely labelled and substandard products. Organizations such as the FDA Office of Criminal Investigation follow up on violations of the Food, Drug, and Cosmetic Act in the United States. Creating similar organizations globally will provide and address the scope of poor-quality drugs in the world.

At a national level, the licensing of manufacturers, distributors, and retailers should be mandatory. Regulators at the national level should provide technical support to enable drug testing in the different stages of the supply chain. Governments and private sector stakeholders should work with researchers and consumers in carrying out drug quality investigations to ensure high quality. Stakeholders in the drug supply chain in each country should collaborate with international organizations such as INTERPOL and the U.S. FDA to investigate and confiscate poor quality or counterfeit drugs.

Additionally, although not the subject of our study, tax policy may also have an impact on the availability of poor-quality products. Taxes raise the price of medicines, enticing consumers to seek drugs from unregulated markets where they are lower priced. By helping reduce prices for legitimate goods through tax reductions, governments will reduce incentives on consumers to utilize these unregulated markets.

Conclusion

Our study found a substantial proportion of falsely labelled and substandard purity drugs. However, we found good-quality drugs were available for the same price as poor-quality products. This suggests that the high-prevalence of poor-quality products is not a result of inherent limitations in manufacturing medicines at an accessible price, but more likely is due to failures of oversight throughout the pharmaceutical supply chain. The results pose clear challenges for stakeholders throughout the healthcare system, from production to consumption, to identify and drive poor quality products from the market. This study also highlights the need for collaborative efforts in the screening and analysis of pharmaceutical drug products across all levels of the pharmaceutical value chain.


Author contributions: Dr Ndichu drafted the manuscript. All authors contributed to the study design, data collection and analysis, revision of the manuscript and final approval of the manuscript.

Declaration of interests: None.

Role of the funding source: Not applicable.


References

  1. Antignac M, Diop BI, Macquart de Terline D, Bernard M, Do B, Ikama SM, et al. Fighting fake medicines: First quality evaluation of cardiac drugs in Africa. Int J Cardiol. 2017 Sep 15;243(Supplement C):523–8.
  2. Koczwara A, Dressman J. Poor-Quality and Counterfeit Drugs: A Systematic Assessment of Prevalence and Risks Based on Data Published From 2007 to 2016. J Pharm Sci. 2017 Oct 1;106(10):2921–9.
  3. International Workshop on Counterfeit Drugs (1997: Geneva S, Policies WHOD of DM and, Drugs WAP on E. Report of the international workshop on counterfeit drugs, Geneva, 26-28 November 1997. 1998 [cited 2018 Jan 12]; Available from: http://www.who.int/iris/handle/10665/64157
  4. http://www.who.int/medicines/services/counterfeit/faqs/SSFFC_FAQ_print.pdf.
  5. WHO | Substandard and Falsified (SF) Medical Products [Internet]. WHO. [cited 2018 Jan 12]. Available from: http://www.who.int/medicines/regulation/ssffc/en/
  6. Cockburn R, Newton PN, Agyarko EK, Akunyili D, White NJ. The Global Threat of Counterfeit Drugs: Why Industry and Governments Must Communicate the Dangers. PLOS Med. 2005 Mar 14;2(4):e100.
  7. http://worldpopulationreview.com/world-cities/lagos-population/.
  8. Research C for DE and. Counterfeit Medicine [Internet]. [cited 2018 Jan 12]. Available from: https://www.fda.gov/Drugs/ResourcesForYou/Consumers/BuyingUsingMedicineSafely/CounterfeitMedicine/
  9. https://www.ncbi.nlm.nih.gov/books/NBK202526/.
  10. Ogah OS, Okpechi I, Chukwuonye II, Akinyemi JO, Onwubere BJ, Falase AO, et al. Blood pressure, prevalence of hypertension and hypertension related complications in Nigerian Africans: A review. World J Cardiol. 2012 Dec 26;4(12):327–40.
  11. https://www.who.int/gho/ncd/mortality_morbidity/en/.
  12. Zou W-B, Yin L-H, Jin S-H. Advances in rapid drug detection technology. J Pharm Biomed Anal. 2018 Jan 5;147:81–8.


Generic Drugs: The Hidden Safety Value in the Drug Pricing Controversy

Will Mitchell, Anthony S. Fell Chair in New Technologies and Commercialization, Rotman School of Management, University of Toronto

Contact: Will Mitchell william.mitchell@Rotman.Utoronto.Ca 

Abstract

What is the message?

Generic and biosimilar drugs now comprise more than 90% of prescriptions and provide discipline on prices in the U.S. pharmaceutical market. Generic versions of traditional small cell pharmaceuticals have had a strong disciplining effect on drug prices. Biosimilars of biologic-based drugs are beginning to show a similar influence, although the impact of biosimilar competition has been slower in the U.S. than in Europe and other developed markets. The challenge going forward is to reinforce norms and rules of competition in the bio-pharmaceutical industry.

What is the evidence?

Assessments based on publicly available data from company reports and industry analysts.

Submitted: October 1, 2019; accepted after review October 31, 2019.

Cite as: Will Mitchell. 2019. Generic drugs: The hidden safety value in the drug pricing controversy. Health Management Policy and Innovation, Volume 4, Issue 2.

Overview

Drug prices in the U.S. are controversial yet again, providing heated talking points on all sides of the political spectrum. Yet most of the debate about drug prices focuses on less than 10% of drug prescriptions: the small share of the market held by patent-protected drugs. The vast majority of drugs that are prescribed each year – now 90% and more of prescriptions in the U.S. – are generic bio-equivalents of small cell pharma drugs or biosimilars of biologicals.[i] Yet there is limited understanding, at best, of the role that generics and biosimilars play in the U.S. pharmaceutical market.[ii]

History: Growth of generic prescriptions

Generic drugs have been available in the U.S. since the 1960s and earlier, but began to play a major role only with the passage of the Drug Price Competition and Patent Term Restoration Act, commonly known as Hatch Waxman, in 1984.[iii] Hatch Waxman extended patent life for innovator drugs while at the same time providing a regulatory pathway to gaining approval of Abbreviated New Drug Applications (ANDAs) for generic drugs. Key aspects of the act included access to data that allowed generic companies to begin to develop drugs prior to patent expiration (Bolar Provision), substituting bio‐equivalence testing for safety and efficacy testing requirements for generics, and offering 180 of market exclusivity for generic drugs that were first to file successful patent challenges (Paragraph IV provision). The changes had major impact on generic entry and, in turn, on drug revenues.

Figure 1 reports ANDA approvals in the U.S. from 1962 to 2018. From a base of 100 to 200 approvals per year in the 1970s, generic approvals grew rapidly after Hatch Waxman in 1984, subsided briefly while the generic pipeline was replenished, and then grew rapidly. In the eighteen years from 1967 to 1984, the U.S. Food and Drug Administration (FDA) approved 1,944 ANDA filings (mean 108 per year). During the next 18 years, from 1985 to 2002, 4,012 ANDAs were approved (223 per year). In the most recent 16 years, from 2003 to 2018, the rate doubled again as the FDA approved 7,764 ANDAs (485 per year). Indeed, in the past two years, approvals exceeded more than 800 ANDAs per year. This flood of data makes a simple point: generics have actively shifted from a secondary part of the pharmaceutical market to a major segment.

Figure 1. No. of U.S. Generic Approvals (ANDAs): 1966-2018

Source: U.S. FDA – https://www.accessdata.fda.gov/scripts/cder/daf/


In parallel, generic prescriptions now dominate U.S. clinical usage. In 1983, before the passage of Hatch Waxman, generic prescriptions accounted for less than 20% of the U.S. market. After Hatch Waxman, generic share grew to about 40% by the late 1990s and then more than doubled their share during the 2000s. [iv]

A major contributor to the recent growth in generic usage was the passage of the Medicare prescription drug benefit (Medicare Part D) as part of the Medicare Modernization Act of 2003. Medicare Part D expanded insurance coverage for drug usage by Medicare beneficiaries, while concurrently increasing incentives for insurance providers to place strong preferences for generics on their drug formularies. By 2018, generic usage reached at least 90% of prescriptions in the U.S.[v] Again, generics are hugely important parts of the market.

By contrast, the financial share of the market for generic drugs has grown much more slowly and, indeed, has fallen in the past five years. In 2013, generic share of revenues peaked at close to 30% of the market (when generic share of prescriptions was 86%), then fell to less than a quarter in 2017 (when generic prescription share had reached 90%).

The striking combination of many approvals, high share of prescriptions, and low share of revenues has been a safety valve for payers as prices of innovative drugs have increased.

Generic impact on branded pharma prices and revenues

Penetration of generic drugs has had a huge effect on drug prices and, in turn, on branded company revenues for individual drugs.[vi] Consider the following example.

Figure 2 depicts sales trends of Prevacid (lansoprazole) a proton pump inhibitor (PPI) for treatment of gastro-intestinal disease.[vii] Lansoprazole was developed by Takeda in Japan. In 1995, the drug was approved in the U.S. and co-marketed by Takeda Abbott Pharmaceuticals. Prevacid rapidly reached blockbuster status as sales grew to more than $3 billion per year in 2003. Then, even before Prevacid came off patent in the U.S., sales began to decline when a competing PPI, Astra Merck Incorporated’s Prilosec (omeprazole) came off patent in 2002 and its generics entered the market. In turn, when Prevacid itself came off patent in 2009 and multiple generic competitors entered the market, sales plummeted, falling to about $300 million in 2018 – 10% of peak revenue. Indirect and direct competition from generic drugs drastically deflated revenue of the branded drug.

Figure 2. Annual Sales ($ billion) Pre- and Post-Generic of Prevacid and Lupron, 1986-2018

Source: Compiled from company annual reports


Variable versus fixed costs in innovative and generic pharma

The ability of generic entry to reduce prices reflects an important fact in the costs of pharmaceutical development, production, and marketing. The fixed costs of developing many drugs are very high, commonly in the hundreds of millions of dollars from lab initiation to completion of human trials. Moreover, when failed efforts are included in the calculations, the average fixed costs of R&D projects may exceed $2.5 billion.[viii] No matter what the estimates, developing new drugs is expensive, whether done in internal labs or by purchasing another company that paid for the initial development.

Yet, in a competitive market, prices do not result from fixed costs. R&D costs are largely sunk – and no payer is interested in covering expenditure that took place in the past. Instead, for any individual drug, prices need to cover the ongoing variable costs of producing and selling the drug, which typically are much lower than allocated total costs.[ix] For major branded bio-pharmaceutical firms, the median “cost of goods sold” (the cost to produce a drug) in 2018 was 28% of sales, while “selling, general, and administrative” expenses (an indicator of marketing costs) also was 28%. These costs largely vary directly with how many units of a drug are produced and sold. And, for any individual approved drug, the variable costs are the minimum of what a company needs to cover in order to justify its sales. [x]

R&D expenditures by major pharmaceutical firms also are high, averaging about 19% of sales in 2018. Yet, again, they are sunk costs and so are not relevant for the price of an individual drug.

Even if R&D costs are not relevant for the prices of individual drugs, across a company’s portfolio of drugs in multiple markets, the firm needs to cover its fixed costs as well as its variable costs in order to survive financially. This is the safe harbor that protection from competition via intellectual property rights provides. Patents create the ability to charge more than variable costs and so seek to cover total costs, because no other firm can offer the same product while patent protection is in place.

The gap between total costs and variable costs creates opportunities for price competition by firms that have lower variable costs and do not need to cover as much R&D expenditures. Bringing generic drugs to approval does require R&D expenditure, but typically lower than branded pharma. In 2018, global generic firms had median R&D/sales of about 6%, much lower than the 19% for major branded companies. Selling, general, and administration for the generic firms was about 22%, somewhat lower than the 28% for established pharma. The lower variable costs for marketing combined with lower R&D costs to allocate across a portfolio means that generic firms can operate at lower price levels while remaining financially viable.

Table 1 compares the cost structure of major branded bio-pharma and generic pharma companies from the U.S., Europe, and Asia in 2018. The generic companies have lower selling and R&D costs as a proportion of sales. However, their lower prices lead to substantially lower return on sales (9% vs. 16%) and a higher ratio of cost of goods sold (49% vs. 28%).

Table 1. Cost structure of Major Branded Bio-Pharmaceutical and Generic Pharma Companies

Median values (2018) Branded Generic
Cost of Goods Sold (COGS) 0.28 0.49
Selling, General, & Administration (SG&A) 0.28 0.22
Research & Development (R&D) 0.19 0.06
Profitability: Return on Sales (ROS) 0.16 0.09
Number of firms in estimates # #
COGS 34 22
SG&A 32 24
R&D 32 16
ROS 34 25


The critical role of competition

Yet simply coming off-patent does not deflate a drug’s sales. Figure 2 also depicts annual revenue of the oncology drug Lupron (leuprorelin/leuprolide). Like Prevacid, Lupron, was developed by Takeda and was introduced to the U.S. market by Takeda Abbott Pharmaceuticals. Introduced in 1986, Lupron has been off patent since 2004. Nonetheless, post-patent sales revenues have been stable, both in the U.S. and globally. Sales in 2018 were at least as high as in the last year of patent protection. What is the difference between the two drugs?

Despite coming from the same source and being marketed by the same companies, Prevacid and Lupron have two major differences. First, Prevacid is primarily used in general medicine and is substitutable with other PPIs or even other gastro-intestinal treatments. Lupron, by contrast, is used in specialized oncology medicine, where prescribers are much more reluctant to switch away from a drug that they are familiar with. Payers, meanwhile, are more hesitant to press specialists such as oncologists to switch to alternative less expensive cancer drugs than they are in more general medicines such as PPIs. Hence, for a specialty drug such as Lupron, patent status is less important than prescribers’ familiarity with the drug.

Second, and relatedly, Prevacid has far more generic competitors than Lupron. Lansoprazole (generic Prevacid) has more than 25 approved ANDAs by 18 different companies. By contrast, leuprolide acetate (Lupron) has only three active approved ANDAs. The difference is not primarily that one drug is more complicated to develop and manufacture than the other. Instead, because generic firms know that prescribers will be reluctant to switch, fewer competitors enter the market. In turn, with less competition, there is less pressure on prices.

The key point is that price reductions typically result, not from losing intellectual property protection, but from gaining competitors.[xi] Generics bring prices down markedly only if multiple generic companies enter the market. Otherwise, generic producers tend to price as high as possible., typically only slightly below the ceiling provided by the original branded drug.

The lack of competition has been the issue in high-profile price increases for generics such as Turing Pharmaceutical’s price increase in 2015 from $13.50 to $750 for the antiparasitic drug Daraprim (pyrimethamine) – for which Turing was the only supplier.[xii] Again, simply being generic does not reduce prices. Pricing discipline comes from competition.

Market exclusivity for generics

One wrinkle in the revenue impact of generics arises from Hatch Waxman’s Paragraph IV. This provision provides six months of market exclusivity for companies that successfully are the first to file challenges to drug patents. The six month exclusivity is a major incentive for aggressive generic companies to seek issues with patents, such as claims of obviousness, lack of novelty, and flaws in the patent filing, particularly for large market blockbuster drugs.[xiii] Following Paragraph IV entry, prices typically decline only slightly during the first six months, while the winning challenger operates without competition from other generic producers. Prices then typically decline drastically thereafter, as additional companies enter the market.

The FDA lists more than 1,000 Paragraph IV certifications.[xiv] Many of the challenges have been successful, leading to entry of generics well before the expected expiration of the original patents. Examples include Teva’s challenge of Merck’s Fosamax (alendronic acid), Lupin’s challenge of Sanofi’s Altace (ramipril), and Sandoz’s challenge of AstraZeneca’s Atacand (candesartan), among many others.

Indeed, aggressive generic companies such as Teva highlight their Paragraph IV initiatives. In 2018, for instance, Teva’s annual report noted that about 70% of the 297 ANDAs in its pipeline had Paragraph IV status, including 107 with first-to-file standing for drugs with current annual market revenue of $74 billion.[xv]

Branded company responses to generic competition

Branded companies have responded actively to their generic competitors, with mixed success.

Many tactics to compete with or block generics have not worked

Several tactics to push back against generic competition have largely failed. Most major branded companies have entered the generic market themselves, but typically withdrawing or cutting back once they find that the two business models tend to be incompatible. Novartis’s generic subsidiary, Sandoz, is the major exception to this rule, although Sanofi, Abbott, and several other established pharma companies do continue to operate in the generic segment. Companies and related industry associations have attempted public relations campaigns claiming lack of reliability of generic drugs, with limited success. Attempts to promote federal or state legislation that would limit generic competition also typically have failed. Similarly, most efforts to claim that generics have not achieved bio-equivalence with the original drug have not taken hold. Such reactive strategies have not held back generics.

Indeed, as Figure 3 shows, by the late 1990s, median profitability of major generic companies had reached the same levels as established branded pharma. In the early 2000s, though, a gap between branded and generic pharma profitability re-emerged, with profits of established pharma trending up and generic pharma trending down.

Figure 3. Return on Sales (ROS) of Major Branded vs. Generic/Specialty Pharma Firms, 1993-2018

Source: Compiled from company annual reports

Note: The “generic/specialty” category includes companies that sell generic drugs and those that sell specialty branded pharmaceuticals because many such firms operate in both segments.


Three tactics to address generics have worked

The growing profitability gap partly reflected three proactive tactics from branded pharma companies. First, branded pharma firms now typically introduces their own “authorized generics” when they face competition from generic entrants, sometimes marketing the drugs themselves and other times licensing the rights to sell their drugs to other generic firms that have market access in the generic segment. This tactic means that the Paragraph IV winner does not have the market to itself during its 180 days of exclusivity and so faces a lower price ceiling that reduces generic profitability.

Second, branded companies appear to have become increasingly adept at stretching out the highly complex litigation concerning Paragraph IV and other patent challenges. [xvi] As a result, even if the challenges succeed, there often is relatively little of the original patent life remaining before generics enter the market.

Third, branded companies have negotiated many “pay for delay” deals with generic challengers, commonly resulting in withdrawal of the Paragraph IV filings – with no other challenger now able to achieve first-to-file status. With these deals, the generic challenger agreed to remain off the market in return for a typically undisclosed compensation. In practice, pay for delay means that prices typically remain higher longer than they might otherwise, with the originator and challenger firm sharing the benefits. Pay for delay deals are highly contentious in the U.S., with continuing debate about competing legal theories – in Europe and Canada, by contrast, courts and legislation have largely ruled out such agreements. The U.S. Federal Trade Commission has filed multiple lawsuits in attempts to block the deals.[xvii] In contrast, many branded and generic pharmaceutical companies argue that the deals remove uncertainty from the market and therefore facilitate trade.[xviii] The bottom line, though, is that the deals lead to delays in generic entry in the U.S. – with lower competition, comes higher prices of branded drugs.

Pricing and survival pressures on generics

The profitability gap in Figure 3 also reflects stronger pricing pressure from third-party payers. Faced with increasing prices of new biological drugs, payers in the U.S. and elsewhere are negotiating more demanding terms with generic firms. In practice, many payers are promoting a dual-track strategy for generics: increasing incentives to prescribe generic drugs, leading to the growing market share, while tightening generic prices when there are multiple providers, thereby leading to lower profitability in the generic sector.

Although there is high variance in estimates of the generic market size, growth in global sales of the leading firms in the generic industry has slowed. From the early 2000s to 2011, as the share of generic prescriptions grew rapidly, sales revenue of about 30 major firms grew from about $30 million to about $70 million. During the past decade, despite continued growth in prescription share, sales grew more moderately, to about $78 billion in 2018 and, in fact, have declined from $83 million in 2014.[xix] Hence, despite its dominant share of prescriptions, the generic market is a demanding competitive space, with substantially lower profits over the past decade.

In turn, the generic industry is highly dynamic in both entry and exit. Between 2002 and 2018, 485 unique firms from countries throughout the world received approval of at least one ANDA from the U.S. FDA. Few remained active for long. Of the 389 firms that had entered by 2016, 78% appear to have exited the market.[xx] Nonetheless, despite this history of exits, entry has continued – 96 first-time firms received ANDA approvals in 2017 and 2018. Barriers to entry of new generic firms remain low.

As a result, active consolidation in the form of multiple ongoing mergers and acquisitions in the sector has not led to substantial market power. The Hirschman Herfindahl Index (HHI) for the market shares bases on the global revenues of major generic competitors in 2018 was only 770, well below the 1500 level that signals concerns about market concentration.[xxi] Indeed, if we base concentration on number of U.S. ANDA approvals rather than global revenues, the ANDA-calculated HHI in 2018 was only 225. During 2018 alone, 819 ANDA approvals were granted to 183 unique firms, with 16 receiving more than ten approvals. Hence, the U.S. generic market continues to attract entry and remains competitive.

The core point here is that, even in the face of aggressive tactics by established branded pharma firms, the generic pharma industry places substantial pressure on branded pharma prices and revenues. In turn, generic pharma revenues account for a much lower share of total sales in the market than their major share of prescriptions. Quite simply, generic pharma has been a key safety valve in the pharmaceutical market.

The biological and genetic revolutions

But what of the new, expensive biological and gene-based drugs that are exploding drug budgets throughout the world? Have the new drugs constricted the generic safety valve?

The biological scientific revolution that began in the 1970s and 1980s was slow to take hold in the market. Although Genentech’s Humulin human insulin (licensed to Eli Lilly) received approval in 1982 and the same company’s Protopin growth hormone was approved in 1985, new biological-based drugs only trickled into the market until the late 2000s. In the past decade, though, biological approvals have exploded, followed more recently by approvals for gene-based therapies. As Figure 4 shows, biological approvals are now one-third or more of total new drug approvals in the U.S.

Figure 4. No. of FDA Approvals, New Molecular Entities (NMEs) and Biologicals (BLAs), 1942-2018

Source: U.S. FDA
Note: The spike in approvals in 1996 was the result of the Prescription Drug Use Fee Act (PDFA), which cleared a backlog of delayed applications.


Multiple firms have received approvals of biologicals. Some are biological specialists with little or no participation in the traditional small cell market. Others are established pharmaceutical firms that have added biologicals to their portfolios, often by allying with or acquiring development stage companies. The 168 biologicals approved from 1982 to 2018 included 77 unique firms, with the leaders being Roche/Genentech (17 approvals), Amgen (12), and Johnson & Johnson (8): an established pharmaceutical firm that acquired a bio pioneer (Roche-Genentech), a bio specialist (Amgen), and an established pharma firm that acquired and licensed in multiple bio entrants (J&J).[xxii] The potential pay-off has attracted a wide range of entrants from North America and Europe, and, increasingly, from Asia.

Many of the new classes of drugs have had huge impact on human health. Biological-based drugs have revolutionized treatments of many types of cancer, immunological disease, optical diseases, endocrinological disorders, and multiple other conditions. New gene-based therapies offer true promise for lipoprotein deficiencies, muscular atrophy, and other debilitating conditions. The innovations are a win for both economic development and health.

This win has come with a price tag for payers. Where payments of thousands of dollars once seemed high, list prices for courses of treatments involving biological-based drugs now commonly reach into the tens and hundreds of thousands of dollars. Indeed, some biological and gene-based therapies for rare diseases have list prices that exceed a million dollars per treatment. Understandably, payers are concerned and even frightened of the impact on their budgets.

The high list prices for biologicals, although typically well above prices actually negotiated by pharmaceutical benefit management firms and other third-party payers, have translated into growing revenues in the branded bio-pharma industry, especially in the U.S.[xxiii] Total reported U.S. revenue for major bio-pharmaceutical firms grew from about $150 million in the late 1990s to about $250 million in 2007, then stabilized until  2014. During the past four years, though, reported U.S. bio-pharma revenues have increased again, exceeding $300 million in 2018.[xxiv] Much of this revenue growth was fueled by the explosion of higher-priced biological drugs.

The common explanation of the high prices of biologicals is development cost of individual drugs, combined with the need to pay for development dry holes. Again, though, R&D is a sunk cost.

Instead, rather than R&D costs, the primary driver of the ability to charge high prices is high health value relative to alternative drugs and other treatments, combined with few competing products. Hence, even as their budgets have been pressed, third-party payers have been reluctantly willing to incur the higher costs, though typically after negotiating discounts and rebates in return for preferred market access. The patent life of the drugs provides barriers to competition that keep payers from pushing prices down to variable costs, thereby allowing successful companies to recover their total costs across their portfolios, including the sunk costs of R&D.

The big question, now, is whether we will see the same safety valve as biological drugs come off patent. Will “generic” versions place direct pressure on prices as individual biologicals come off patent and indirect pressure as biologicals that provide similar benefits lose their proprietary rights?

Biosimilars

Owing to their different technological basis, copies of biological drugs do not fall within the bio-equivalence realm of small-cell pharma. Instead,  replications of originally biologics are “highly similar” to the original biologic medication. In turn, emerging regulatory initiatives are defining the conditions under which officially approved products and be marketed after patents expire. In the U.S., biological licensing applications (BLAs) for such “biosimilars” typically require functional studies and human clinical trials.

Regulatory pathways

Multiple countries have introduced regulations to guide approval and introduction of biosimilars. The European Medicines Agency in the European Union was among the first, with an initial framework set up in 2004-2005 and first approval in 2006.[xxv], [xxvi] Other countries soon followed with acceptance of biosimilars, including Canada (2006 regulations; first approval in 2009), New Zealand (first approval in 2012), and Japan (first approval in 2014).[xxvii] By contrast, the U.S. did not create a biosimilar framework until the Biologics Price Competition and Innovation Act of 2009 was passed in 2010, with the first approval occurring in 2015. The U.S. has been late to the biosimilar party.

Not surprisingly, there is substantially more biosimilar competition in Europe than in the U.S. For instance, nine biosimilars of filgrastim (Amgen’s Neupogen) had been approved in Europe by late 2018, while only Sandoz’s biosimilar Zarxio (filgrastim-sndz) and Pfizer’s Nivestym (filgrastim-aafi) had been approved in the U.S., in 2015 and 2018. In total, at least 55 biosimilars had been approved in Europe by late 2018,[xxviii] while only 16 had been approved in the U.S. by the end of that year. [xxix]

Biosimilar impact on revenues in the biological market

Not surprisingly, the price impact from biosimilars has come earlier in Europe and Canada than in the U.S. The extent of the price reductions is ambiguous, as negotiations are often confidential. Nonetheless, market analysts suggest about a 15% price reduction when a biosimilar first enters the market and reductions in the range of 35% when the second biosimilar enters, with the originator company usually matching the price cuts.[xxx]

With the price matching, the originator sometimes holds its prescription market share, owing to prescriber familiarity with the drug and the availability of supporting services such as infusion clinics. The continued lead by the originator products has been controversial, with the biosimilar companies filing complaints about unfair practices. [xxxi] Nonetheless, total revenue for the original drug sometimes begins to decline.

Figure 5 reports a relevant example, comparing sales trends of Humira (adalimumab), Remicade (infliximab), and infliximab biosimilars. Both adalimumab and infliximab are injectable monoclonal antibodies in the TNF inhibitor class, used for a wide range of autoimmune disorders. Both drugs have made major contributions to improving human health.

Figure 5. Sales Trends ($ billion) of TNF Inhibitors: Humira (adalimumab), Remicade (infliximab), and infliximab Biosimilars

Source: Compiled from company reports


Remicade is sold in North America by Janssen/Johnson & Johnson, in Europe by Merck (previously by Schering Plough), and in Japan by Mitsubishi Tanabe. Remicade faced biosimilars in Europe in 2013 (Inflectra/Remsina, from Hospira/Celltion/Pfizer), followed by a three year lag until 2016 for the first infliximab biosimilar approval in the U.S. (Inflectra). As the figure shows, Remicade’s global sales began to decline in 2014, following the European biosimilars, and then increasingly declined in 2017, following the U.S. approvals. Remicade revenue in Japan began to decline in 2018, following the approval of Inflectra. Although the rates of decline differ, biosimilars have had an impact on Remicade revenues in all three countries.

Market penetration by the biosimilars themselves has been mixed. In Europe, Celltrion’s Remsina may now have more than half the market.[xxxii] In the U.S., by contrast, biosimilar competitors to Remicade such as Inflectra have gained only limited market penetration. In either case, though – whether through biosimilar success in the market or by downward pressure on prices of the original drug – the biosimilars have led to lower prices.

Barriers to biosimilars

Yet biosimilar approval alone does not lead to lower prices and reduced revenues. The revenue trends for Humira in Figure 5, the world’s largest selling prescription drug, are strikingly different to Remicade. The differences arise both from later approval of biosimilars and market barriers to approved biosimilars.

Until recently at least, Humira sales have continued to grow in both Europe and the U.S. In Europe, Humira’s patent expired in 2017 and two biosimilars were launched in 2018, by Amgen and Biogen/Samsung Bioepsis. It is likely that the biosimilar competition will deflate Humira revenue in Europe in the near future.

In the U.S., although biosimilar approvals pre-dated those in Europe, pressure on Humira revenue may be weaker. Although the FDA has approved several biosimilars of adalimumab (Amgen’s Amjevita in 2016, Boehringer Ingelheim’s Cyltezo in 2017, Sandoz’s  Hyrimoz in 2018, and Samsung Bioepsis’s Hadlima in 2019), AbbVie has been able to stave of competition by filing a broad set of extension patents and then negotiating deals that will hold eight potential competitors – including some that have not applied for biosimilar approvals – off the market until 2023. [xxxiii] The potential competitors have been willing to settle in order to avoid the uncertainty of whether they would win lawsuits concerning the patent extensions. While some analysts argue that Humira prices and revenue in the U.S. will decline even without direct competition, in the face of pressure from third-party payers that may provide preferred market access to alternative TNF inhibitors such as Remicade, any such decline has not yet occurred.

Revenue trends for Amgen’s Epogen (etanercept) reinforce the point that simply gaining approval for biosimilars is not enough to add pricing pressure. The U.S. FDA has approved two biosimilars of Enbrel – Erelzi from Sandoz in 2017 and Eticovo from Samsung Bioepsis in 2019. However, although biosimilars of etanercept have been approved and sold in Europe and Canada for Sandoz (2016) and Samsung Bioepsis (2017), Sandoz and Amgen have been locked in litigation that has blocked Erelzi from entering the U.S. market.

Figure 6 highlights the differential impact on Enbrel revenues in the different geographies. In Europe, where the drug is marketed by Pfizer and faces competition from biosimilars, Enbrel revenue is down by about half. In the U.S., by contrast, despite a moderate decline in 2018, Enbrel’s sales have remained high.

Figure 6. Sales Trends ($ billion) of Epogen (etanercept)

Source: Compiled from company reports


Why have biosimilars had less impact so far in the U.S.?

The examples above highlight the point that, so far, although biosimilars have led to somewhat lower revenue for the original drugs in the U.S., the effect is less than in Europe. Two factors help explain this.

Firs, biosimilar regulation was slower to take hold in the U.S., slowing down entry. In part, the slowness reflects both technical ambiguity and political challenges that arose in agreeing on a framework. Even though discussions began as early as the late 1980s and the first bills were introduced in 2006, the legislation did not pass until 2010.[xxxiv] In turn, it took the FDA several years to publish guidelines for developing and registering biosimilars.[xxxv]

Second, the slower impact also reflects strategies of biological incumbents. As we have seen in the examples above, bio-pharmaceutical incumbents have sought to slow competitive entry of some approved biosimilars, whether by challenging the validity of the approvals or signing pay-for-delay deals. In addition, incumbents have been active in litigation seeking to clarify multiple aspects of the legislation,[xxxvi] which has had the perhaps unintended consequence of delaying full implementation.

Hence, although biosimilars are beginning to provide the safety value of traditional generics, the valve has opened much more slowly in the U.S. than in Europe and other countries.

Will biosimilars have more impact on prices and revenues in the future?

The blockage in the biosimilar pipes does appear to be loosening in terms of approvals and in somewhat lower revenues for incumbents. During 2018 and the first seven months of 2019, the FDA approved 14 biosimilars, compared to only 9 in the previous three years.[xxxvii] The 23 total approvals from nine unique companies cover nine original biological drugs.

In turn, revenues for most reference biologicals that now face biosimilar competition in the U.S. were are undergoing at least moderate decline by the end of 2018. Nonetheless, the jury is still out – in some cases, almost literally, given the ongoing litigation – on how quickly the disciplining impact will take hold in the U.S. market.

Certainly there are incentives to take advantage of the biosimilar competition. Perhaps the most likely agents for moving the impact of biosimilars forward are private and public third-party payers. As more biologic alternatives become available in the market – both biosimilars and competing new biologicals – private insurers and pharmaceutical benefit managers are in increasingly strong positions to negotiate discounts in return for market access. In the public payer market, reductions may take hold if Medicare gains the right to negotiate prices for the drugs that they administer, although any such changes are politically uncertain and are likely to be multiple years in the future.

Looking forward

The core point here is that generic versions of traditional drugs and biosimilars of new biological medicines are hugely important yet under-recognized parts of the pharmaceutical market. So long as there is meaningful competition, their presence in the market leads to substantially lower prices, helping payers negotiate and manage their budgets.

This sequence is a sign of an effective market for innovation. Innovative drugs have a period of patent-protected safe harbor during which they can recover the high fixed costs of creating new drugs. Once patents expire, multiple entrants then provide longer-term pricing discipline, along with incentives to develop new innovative drugs that will enjoy the higher-priced safe harbor. The sequential combination of profitable innovation followed by pricing discipline in a competitive market offers major benefits for both economic development and human health. For the most part, the current pharmaceutical market has an effective balance.

Yet there are substantial barriers to competition in the current pharmaceutical market, which may inhibit market discipline on drug prices. Some barriers are political and regulatory, while others reflect strategies that take advantage of grey areas in the law. Rather than attempt to regulate pharmaceutical prices directly – which would inevitably be clumsy and lead to attempts to circumvent price regulations – public policy will better serve the market by promoting competition.

Fortunately, most of the norms and rules of competition are in place in the U.S. and other major markets. The challenge going forward is to reinforce those norms and rules.


Endnotes

[i] Small cell drugs are organic compounds that affect biologic processes with relatively low molecular weights, while biologicals are drugs based on proteins with therapeutic effects, made from living microorganisms of animal or plant cells. Small cell pharma was the primary focus of pharmaceutical development prior to the 1980s, when the biological revolution emerged as an important complement.

[ii] Clayton P. Wiske, Oluwatobi A. Ogbechie, and Kevin A. Schulman. October 29, 2015. Options to promote competitive generics markets in the United States. JAMA Generics, E1-E2. doi:10.1001/jama.2015.13498.

[iii] See http://plg-group.com/wp-content/uploads/2014/03/Overview-of-the-Hatch-Waxman-act-its-impace-on-Drug-Develo.pdf

[iv] Figures collected by the author from the Generic Pharmaceutical Association, IMS/IQVIA, and other sources.

[v] Generic usage in other traditional developed economies has also grown, though typically to somewhat lower levels.

[vi] I will focus on revenues rather than prices, because prices for even the same drug are highly varied and often ambiguous due to proprietary discounts and rebates. By contrast, revenue information based on company reports and industry analysis provides reliable trends.

[vii] These figures and other drug revenues are based on annual company reports.

[viii] J.A. DiMasi, H.G. Grabowski, R.W. Hansen, 2016. Innovation in the pharmaceutical industry: New estimates of R&D costs. Journal of Health Economics, 47: 20-33.

[ix] Will Mitchell. 2018. Pharma Prices Are Not Too High (Usually). Health Management Policy and Innovation, Volume 3, Issue 2. https://hmpi.org/2018/10/14/lead-article-pharma/

[x] The cost of goods sold, selling, general, and administration, and R&D ratios are average values of figures reported by about 30 global pharmaceutical firms based in Europe, North America, and Japan.

[xi] H.G. Grabowski, D.B. Ridley, K.A. Schulman. 2007. Entry and Competition in Generic Biologics, Managerial and Decision Economics, 28(4-5): 439-453.

[xii] https://www.nytimes.com/2015/09/21/business/a-huge-overnight-increase-in-a-drugs-price-raises-protests.html

[xiii] https://www.cornerstone.com/Publications/Research/Trends-in-Paragraph-IV-Challenges

[xiv] https://www.fda.gov/media/82686/download

[xv] Teva Pharmaceutical Industries Limited, Form 10 K, Report to the Securities Exchange Commission for the fiscal year ended December 31, 2018, page 61.

[xvi] https://www.americanpharmaceuticalreview.com/Featured-Articles/348913-Intricacies-of-the-30-Month-Stay-in-Pharmaceutical-Patent-Cases/?catid=25273

[xvii] https://www.ftc.gov/news-events/media-resources/mergers-competition/pay-delay

[xviii] https://www.forbes.com/sites/matthewherper/2011/05/09/stop-demonizing-drug-companies-over-pay-to-delay-deals/#505593462135

[xix] Author’s calculations, based on company reports.

[xx] Author’s calculations, based on U.S. FDA data. https://www.accessdata.fda.gov/scripts/cder/daf/

[xxi] Calculation based on reported company sales.

[xxii] Figures calculated from U.S. FDA data. https://www.accessdata.fda.gov/scripts/cder/daf/

[xxiii] Kevin A. Schulman and Matan Dabora. 2018. The relationship between pharmacy benefit managers (PBMs) and the cost of therapies in the US pharmaceutical market: A policy primer for clinicians. American Heart Journal, 2016: 113-122. https://doi.org/10.1016/j.ahj.2018.08.006

[xxiv] Figures based on reported U.S. revenue for a composite set of 30 to 42 (depending on year) of major bio-pharmaceutical firms based in the U.S., Europe, and Japan.

[xxv] M. Schiestl, M. Zabranksy, and F. Sorgel. 2017. Ten years of biosimilars in Europe: Development and evolution of the regulatory pathways. Drug Design Development and Therapy, 11: 1509-1515.

[xxvi] A. Harston. 2018. How the U.S. compares to Europe on biosimilar approvals and products in the pipeline. Rothwell Figg. https://www.biosimilarsip.com/2018/10/29/how-the-u-s-compares-to-europe-on-biosimilar-approvals-and-products-in-the-pipeline-3/

[xxvii] Generics and Biosimilars Initiative. December 14, 2018. Biosimilars approved in Canada. http://www.gabionline.net/Biosimilars/General/Biosimilars-approved-in-Canada

[xxviii] A. Harston. 2018. How the U.S. compares to Europe on biosimilar approvals and products in the pipeline. Rothwell Figg. https://www.biosimilarsip.com/2018/10/29/how-the-u-s-compares-to-europe-on-biosimilar-approvals-and-products-in-the-pipeline-3/

[xxix] https://www.fda.gov/drugs/biosimilars/biosimilar-product-information

[xxx] https://www.biopharmadive.com/news/merck-launch-remicade-biosimilar-discount-jnj-pfizer/447939/

[xxxi] S&P Global Market Intelligence. September 4, 2018. Pfizer complains to the FDA about J&J, Amgen comments on biosimilar products. https://www.spglobal.com/marketintelligence/en/news-insights/latest-news-headlines/46275504

[xxxii] https://www.centerforbiosimilars.com/news/celltrion-says-its-biosimilar-has-gained-56-of-the-european-infliximab-market

[xxxiii] https://www.biopharmadive.com/news/abbvie-boehringer-ingelheim-settle-humira-patent-biosimilar/554729/

[xxxiv] K.H. Carver, J. Elikan, and E. Lietzan. 2010. An unofficial legislative history of the Biologics Price Competition and Innovation Act of 2009. Food and Drug Law Journal, 65 (4): 617-818.

[xxxv] Jennifer Fox. July 25, 2018. Biosimilars: Challenge and barriers to entering the U.S. market. American Pharmaceutical Review. https://www.americanpharmaceuticalreview.com/Featured-Articles/352224-Biosimilars-Challenges-and-Barriers-to-Entering-the-U-S-Market/

[xxxvi] See Jennifer Fox (2018) above.

[xxxvii] https://www.fda.gov/drugs/biosimilars/biosimilar-product-information

Word from the Editors

On behalf of the editorial team – Regina Herzlinger, Kevin Schulman, Lawrence Van Horn, and myself – I am delighted to welcome you to Volume 4 of HMPI. We again have a strong set of new articles that are central to our core goal: drawing from the research and experience of scholars and practicing leaders to advance healthcare and health systems.

In this issue of HMPI, the authors report their research, insights, and case studies.

  • Two research papers address important issues about healthcare insurance. First, they report evidence that suggests Medicare Advantage insurance may be “upcoding” services into higher paying categories. Second, they show that people in the healthier segments of insurance plans receive only limited value for their premiums.
  • Two experience perspectives highlight key issues in healthcare management. First, we report a discussion of two ways in which artificial intelligence will deliver value to health plans, large employers, providers, and patients. Second, we offer lessons about how merging hospitals can remain innovative after consolidation.
  • We report key insights from the recent University of Miami conference on the business of healthcare.
  • We also provide two case studies. First, a thoughtful discussion highlights the idea that established retailers can support lifestyle management programs for needs such as diabetes prevention and care. Second, a case study of an early stage regenerative medicine venture, highlighting the value proposition that helped it raise Series A financing.

Healthcare in the United States and globally is generating robust and sometimes acrimonious debates. Costs of services and products are increasing – even as innovation creates new value and healthcare systems face real issues in paying for desirable innovation, giving rise to arguments about what services to provide. At the same time, different actors in systems across the world are debating their commitment to maintaining and increasing access to healthcare services, partly due to concerns about costs and partly, perhaps even more importantly, due to differing perspectives on equity. The articles in this issue of HMPI provide relevant tools and ideas that can support robust arguments within these debates.

The authors of the articles that we publish are committed to improving management practices in health systems around the world. We welcome your comments about the ideas that the articles spark and your ideas for subsequent articles. Please send us your comments to info@hmpi.org. We also welcome discussion on the BAHM Forum on LinkedIn [https://www.linkedin.com/groups/7042389] and on Twitter, https://twitter.com/HMPI_Journal.

If you have an idea that you would like to explore for HMPI, please send an outline of your article to our editorial team at info@hmpi.org.

Will Mitchell
Professor of Strategic Management
Anthony S. Fell Chair in New Technologies and Commercialization
Rotman School of Management, University of Toronto

The Business of Healthcare: Common Thoughts by Leaders of Disparate Healthcare Organizations

Steven G. Ullmann, PhD, Chair, Department of Health Management and Policy, Director, Center for Health Management and Policy Miami Business School, and Richard Westlund, MBA

Contact: Steven G. Ullmann, sullmann@bus.miami.edu

Abstract

What is the message?

Leaders of the major US healthcare professional associations agree on key policy areas

What is the evidence?

Panelists at the University of Miami’s 8th annual “The Business of Health Care” conference found common ground on universal health care, electronic medical records and pharmaceutical pricing

Submitted: May 15, 2019; accepted after review: May 17 20, 2019.

Cite as: Steven G. Ullmann, Richard Westlund. 2019. The Business of Health Care: Common Thoughts by Leaders of Disparate Health Care Organizations. Health Management Policy and Innovation, Volume 4, Issue 1.

The University of Miami recently held its 8th annual conference on “The Business of Health Care.” Attended by over 900 people, this year’s theme was “Technology and People, The U.S. and Beyond”. Over the last few years, one of the keynote panels has been made up of members of the C-suite of the major health care professional associations representing the wide array of the healthcare sector. This year’s panel included Matt Eyles, President and CEO of America’s Health Insurance Plans; Joseph Fifer, President and CEO of the Health Care Financial Management Association; Halee Fischer-Wright, M.D., President and CEO of the Medical Group Management Association; Ernest Grant, Ph.D., President of the American Nurses Association; Barbara L. McAneny, M.D., President of the American Medical Association; and Maryjane A. Wurth, Executive Vice President and COO of the American Hospital Association.

The panel was moderated by Patrick J. Geraghty, President and CEO of Florida Blue and its parent company, Guidewell. Many insights were garnered from this panel. Perhaps, most surprisingly, especially given the disparate organizations represented by the panelists, was the level of agreement on a number of significant issues affecting the healthcare industry at large.

Electronic medical records: Clinical benefits

One of the areas of agreement is, perhaps, not that surprising. It relates to the additional work that Electronic Medical Records have produced for healthcare providers. Dr. McAneny, the President of the American Medical Association, indicated that this was an issue not because of the lack of acceptance of technology; as technology is used throughout the medical sector, robotics being an example. But Dr. McAneny argued that Electronic Medical Records are nothing but a copy of paper files with “a typewriter attached” and provide little in the way of clinical benefits. Physicians would welcome such technology if it would enhance clinical benefits. Dr. Ernest Grant, reflecting the nurses’ perspective, indicated the appropriate use of electronic communication could serve to strengthen education and compliance associated with chronic healthcare conditions and addressing aspects of the social determinants of health. Discussion centered on the prospect of moving away from the established Electronic Medical Record systems that most healthcare systems have bought into in favor of systems that focus on what essentially is the “Triple Aim” i.e. patient cost, patient quality, and population health. Perhaps there will be a transition in this direction.

Universal health care coverage: Strengthen the ACA

There were a number of policy areas where one would have expected little agreement and yet, there was. One of those areas relates to “Medicare for all.” The participants were in unanimous agreement and, relatively adamant, that Medicare for all should not be a direction for the country. They also were unanimously against the idea of supporting the call for the Justice Department to sue in the federal courts to find the Patient Protection and Affordable Care Act (ACA) unconstitutional following the repeal of the Individual Mandate by the President and Congress. Panelists agreed that universal health care coverage should be the goal but that the way to attain it, is to work on and strengthen the Affordable Care Act, which allow would physicians a significant opportunity to develop alternative payment plans. Further, as discussed by Dr. Grant of the American Nurses Association, the social determinants of health need to be considered in the development of payment and incentive systems. Mental health was also brought up and discussed as a significantly important area. Given that the Affordable Care Act has been the law of the land for over nine years, there was concern about the lack of stability in healthcare policy and with that instability, the inability to undertake strategic planning crucial to the efficient provision of quality care in the United States.

Pharma costs: Transparency

Another area of concern was the cost of pharmaceuticals, which one of the panelists characterized as a “Tsunami” of drug costs. Drug prices were discussed as the fastest growing line item in the U.S. healthcare system, making up more than 23¢ on the dollar of healthcare costs, excluding pharmaceutical costs included in DRGs. The question arose how people can manage their chronic conditions and be drug compliant when they are working to pay rent and food only to find, for example, that the cost of insulin costs $500 per month. Transparency was seen as essential. Panelists reflected on a Nobel Prize-winning economic concept associated with asymmetric information, the so-called “Lemon’s Principle”, developed by George Akerlof. The Lemon’s Principle suggests that when one side has information and the other side does not, markets break down. Thus, without transparency and complete information, people tend to believe that if there are two equivalent drugs, one priced at $100 and one priced at $150, the $150 drug is superior to the $100 drug. Drug information is critical, as per the panelists, to bring about the higher quality, more efficient provision of health care. As the panel discussed, we do have an issue when among 29 industrialized countries, the United States is ranked 27th in patient satisfaction.

Moving forward

Ultimately, the message from the panelists was that they can coalesce around many areas of policy, even though they hail from rather diverse segments of the healthcare industry. Prior to this interactive conversation, it would have probably been assumed that there would be much disagreement within a panel representing seemingly disparate interests. It was truly enlightening to hear that that was not the case.


Diagnostic Coding Intensity for Medicare Advantage versus Fee-for-Service Populations

Stephen T. Parente, Minnesota Insurance Industry Chair of Health Finance; Director Emeritus, Medical Industry Leadership Institute, Professor, Department of Finance, Carlson School of Management, University of Minnesota; Roger Feldman, Professor Emeritus, University of Minnesota

Contact: Stephen T. Parente, stephen.parente@gmail.com

Abstract

What is the message?

We examine the presence of deliberate diagnostic coding intensity for risk-based beneficiary prospective payments in Medicare Advantage (MA) compared to traditional fee-for-service Medicare from 2010 through 2014. We find that risk ratings based on adjusted diagnostic groups (ADGs) and hierarchical condition categories (HCCs) are similar for the fee-for-service population, but the ADG risk adjustor significantly reduces risk scores in the Medicare Advantage population. Like the HCC system, ADGs are based on patients’ diagnoses, but they are not used for MA payment. Our results suggest that upcoding within the risk adjustment system may have over-stated risk differences in the fee-for-service and Medicare Advantage populations, leading to higher payments to Medicare Advantage plans.

What is the evidence?

The analysis is based on large national samples of Medicare FFS and Medicare MA medical claims data for years of service 2010 to 2014.

Submitted: March 31, 2019; accepted after review: April 15, 2019.

Cite as: Stephen T. Parente, Roger Feldman. 2019. Comparing Diagnostic Coding Intensity for Medicare Advantage and Fee for Service. Health Management Policy and Innovation, Volume 4, Issue 1.

Overview

Medicare beneficiaries may choose to receive services from the traditional fee-for-service (FFS) program or from a private Medicare Advantage (MA) plan.  For those who join an MA plan, the government makes a fixed, prospective payment adjusted by its estimate of the relative risk of the enrollee.  The risk score for each enrollee is based on beneficiary demographics and diagnostic conditions known as Hierarchical Condition Categories (HCCs). The HCC diagnostic classification system begins by classifying over 14,000 diagnostic codes into a smaller number of diagnostic groups that represent related conditions (Pope, et al., 2011)[1].

For the two types of plans, the HCCs have different sources of data and a different impact on payments. For beneficiaries who chose the fee-for-service program, HCCs are obtained from claims that providers submit for payment. The HCC scores derived from those claims generally do not affect providers’ revenues. For Medicare Advantage, by contrast, hierarchies are imposed so that a person is coded for only the most severe manifestation among related diseases and then the conditions that best explain Medicare Part A and B expenditures are used to adjust the payments. MA plans submit HCCs to the Centers for Medicare and Medicaid Services (CMS) each quarter and the plans’ revenues increase if they can more comprehensively document the health conditions of their enrollees. This has led to concern that MA plans are coding their enrollees’ health conditions with greater intensity to receive higher payments (GAO, 2013; Kronick & Welch, 2014)[2][3], a tactic known as upcoding.

Determining the existence and extent of coding differences in intensity is difficult because observed differences in HCCs between FFS Medicare and MA plans could depend on risk selection as well as coding intensity. For example, HCCs in MA plans would be higher if people with more severe health conditions tend to enroll in MA plans.

Two recent studies have attempted to identify the differences in coding intensity due to upcoding. Alice Burns and Tamara Hayford followed a cohort of beneficiaries who were all in the FFS program in 2008. [4]  Over the next five years, some stayed in FFS while others switched to MA plans.  Burns and Hayford found that risk scores of the switchers grew faster than those of stayers, with the effect of MA enrollment on the growth in risk scores increasing over time.

Michael Geruso and Timothy Layton exploited the fact that MA enrollment within county markets increased rapidly following changes in MA payment policy in 2006. [5]  If the same enrollee generates different risk scores in MA and FFS, then we should observe changes in market-level risk associated with the increase in MA market penetration.  Geruso and Layton found that enrollees in MA plans generate 6% to 16% higher diagnosis-based risk scores than they would in FFS Medicare.

Thus, both studies hint at the idea that MA plans are selectively upcoding risk levels. Nonetheless, the implications do not fully rule out selection effects that might confound coding intensity and risk selection.

Our Study

We contribute to the literature on coding intensity by using a novel approach to separate coding intensity from risk selection.  We first evaluate the HCC risk scores for two large samples of FFS and MA enrollees from 2010 through 2014.  The results indicate consistently higher risk for MA enrollees.  Then we use a different risk adjustor – the Johns Hopkins University ADGs – to evaluate the risk scores.[1]  Like the HCC system, ADGs are based on patients’ diagnoses, but they are not used for MA payment.  We find that ADGs and HCCs are similar for the FFS population, but the ADG risk adjustor significantly reduces risk scores in the MA population, making them approximately equal to FFS.  As an additional analysis, we show that these effects apply to specific conditions where the two risk adjustment systems can be compared. Our results suggest that the current risk adjustment system over-states risk differences in the FFS and MA populations, consistent with the idea that MA plans are selectively upcoding.

Results

Exhibit 1 provides a five-year comparison of the FFS and MA populations using the payment-driving HCC risk adjustor and the non-payment ADG method. Both populations and methods show decreasing risks over time, but with differences for the two methods.  The FFS population has a consistent pattern over time between the HCC and ADG methods.  On the other hand, the MA population appears to have far greater risk when the HCC method is used rather than the ADG method.

Exhibit 1: Five-Year Comparison of Risk by HCC and ADG in the MA and FFS Populations, 2010-2014

Source: Medicare Fee for Service and Medicare Advantage Claims Data
Notes: Authors’ computations


In Exhibit 2, we show the results of a more detailed comparison of 2013 – 2014 MA versus FFS risk based on the prevalence of chronic and major conditions.  While the MA population is often sicker than the FFS population, it is not always the case. For example, psycho-social conditions are less prevalent in the MA population than the FFS population. Also, the differences are far less for unstable chronic conditions between the FFS and MA population using ADGs (2014: 48% versus 42%).  In our HCC-specific comparison we found the rate of HCC 18 (Diabetes) in the MA population to be almost twice the rate in the FFS population.

Exhibit 2: Prevalence of Chronic and Major Conditions in the MA and FFS Populations, 2013-2014 

Source: Medicare Fee for Service and Medicare Advantage Claims Data
Notes: Authors’ computations

Implications: MA plans may be using code intensity to drive higher payments

We find evidence suggesting that MA plans may be using greater code intensity to drive higher risk scores and hence, higher payment rates.  This greater coding intensity could be an indication of upcoding. For upcoding to be ruled out in the MA population, we would expect the HCC and ADG risk scores to be closely parallel, as they are in the FFS data. This was not the case.

The results have a practical policy implications. The differences in coding intensity suggesting upcoding may be addressed using the present practice, adopted in 2015, of ICD10-based HCCs instead of the ICD9 version used during the period of our study.  Hence, a policy recommendation would be for CMS to repeat our analysis using the ICD10 versions of the HCCs and ADGs to examine the consistency of payment-based risk scores for the MA population versus one not used for payment.  Hopefully, ICD10 is less susceptible to differences in coding intensity designed to take undue advantage of the government payment incentives.  This is an empirical question to be addressed in future analyses comparing MA and FFS population data.

References

[1] Pope, Gregory C., John Kautter, Melvin J. Ingber, Sara Freeman, Rishi Sekar, and Cordon Newhart, Evaluation of the CMS-HCC Risk Adjustment Model, Final Report on CMS Contract No. HHSM-500-000291 TO 0006, RTI International, March, 2011; available at https://www.cms.gov/Medicare/Health-Plans/MedicareAdvtgSpecRateStats/downloads/evaluation_risk_adj_model_2011.pdf.

[2] Hayford, Tamara Beth and Alice Levy Burns, “Medicare Advantage Enrollment and Beneficiary Risk Scores: Difference-in-Differences Analyses Show Increases for All Enrollees On Account of Market-Wide Changes,” Inquiry, 55 (2018), 1-11.

[3] Kronick, Richard and W. Pete Welch, “Measuring Coding Intensity in the Medicare Advantage Program,” Medicare & Medicaid Research Review, 4:2 (2014), E1-E19.

[4] Burns, Alice and Tamara Hayford, “Effects of Medicare Advantage Enrollment on Beneficiary Risk Scores,” Congressional Budget Office, Working Paper 2017-18, November, 2017; available at http://www.cbo.gov/publication/53270.

[5] Geruso, Michael and Timothy Layton, “Upcoding: Evidence from Medicare on Squishy Risk Adjustment,” National Bureau of Economic Research, Working Paper 21222, April, 2018; available at http://www.nber.org/papers/w21222.

[6] The Johns Hopkins ACG® System, Version 11.0 Technical Reference Guide, Johns Hopkins Bloomberg School of Public Health, November, 2014; available at http://docplayer.net/22388017-The-johns-hopkins-acg-system-version-11-0-technical-reference-guide-november-2014.html.

Healthcare Consolidation Does Not Mean the Death of Innovation

Gary S. Kaplan, MD, FACP, FACMPE, FACPE, and C. Craig Blackmore, MD, MPH, FASER, Virginia Mason Medical Center

Contact: C. Craig Blackmore, Craig.Blackmore@virginiamason.org

Abstract

What is the message?

A strong focus on a single unified management system across institutions can mitigate potential barriers to innovation brought about through consolidation.  Virginia Mason is an example of how a unified lean management system supports innovation in the face of institutional growth and consolidation.

What is the evidence:

The literature is limited, and conflicted, on the potential effects of consolidation on innovation in healthcare. The Virginia Mason experience provides a model for the preservation and support of innovation in the face of such consolidation.

Disclosure: The authors have no conflicts of interest related to this work.

Submitted: November 29, 2018; accepted after review: December 18, 2019.

Cite as: Gary S. Kaplan, C. Craig Blackmore. 2019. Health Care Consolidation Does Not Mean the Death of Innovation – the Example of Virginia Mason Production System. Health Management Policy and Innovation, Volume 4, Issue 1.

Introduction

Healthcare is undergoing rapid consolidation in the United States, at a pace that has doubled between 2011 and 2015.1 Large provider groups are fighting for market share and leverage, while smaller providers are struggling to compete. Insurance companies and pharmaceutical benefit management firms are also undergoing similar consolidation. Further, it is becoming apparent that overall, this consolidation has had no measurable impact on improving healthcare quality or access, while contributing to rising prices. 2-3

As reported in the 2001 Institute of Medicine landmark reports “Crossing the quality chasm: A new health system for the 21st Century,” finding ways to improve quality while gaining greater cost and price effectiveness will require innovative ways of organizing, delivering, and paying for healthcare.4  Indeed, it is in the delivery of healthcare – whether existing goods or new practices – that innovation is most needed. This ranges from basic practices, tools, and standard work to address the challenges of a particular quality or care problem, to sophisticated management systems that support safe care practices, and to larger scale healthcare delivery and payment models.

However, healthcare is a decidedly traditional, highly regulated, and risk-averse environment that holds strong challenges for innovation. A key question is how the ongoing consolidation might affect incentives and ability to innovate – whether the consolidation will exacerbate existing rigidities or, instead, create platforms for experimentation.

Innovation and Institutional Size

The management literature offers mixed predictions about how institutional size affects innovation. The traditional Schumpeterian hypothesis suggests that the larger size of institutions offers potential benefits from higher volume and the ability to maintain gains from innovation due to greater market power.5, 6, 7 Conversely, some scholars have argued that the bureaucracy that comes with size deters innovation, with transformative change driven by small organizations with the ability to change rapidly.5, 7, 8

Healthcare innovation may be particularly challenging in the face of consolidation. The presence of differing management approaches, silos, sub-cultures and internal constituencies can serve as major barriers to both the development and spread of innovation.7 When institutions with differing management/improvement models consolidate, there is risk that the union will occur only at the higher levels, leaving innovation blocking fiefdoms in place.

Corporate bureaucracy also plays a role in blocking or supporting innovation. Large companies with a history of market domination and financial success may develop a culture of arrogance that is wedded to the status quo, and fears failure more than desiring future success. In the highly traditional healthcare world, consolidation has become a method to control market share and enable negotiation with similarly consolidated payers and providers.1-2 Innovation toward higher quality and lower cost often has not been prioritized.

Yet, despite these challenges, there are real opportunities for large health systems to be innovative leaders in healthcare delivery. As we describe next, Virginia Mason Health System in Seattle, Washington, is a striking example.

Innovation at Virginia Mason: The VMPS

Established in 1920 as an 80-bed hospital with six physician offices, Virginia Mason now encompasses two hospitals with more than 550 beds, more than 450 physicians, a network of clinics, and a broad base of complementary services. At Virginia Mason, innovation has been critical to our work to achieve the strategic vision of being a quality leader and transforming healthcare. Starting in 2002, Virginia Mason has been a pioneer in adapting the lean Toyota Production System to healthcare. Widespread skepticism initially, including negative headlines in the local newspaper, has now given way to broadening acceptance of “lean” across U.S. healthcare. Recent surveys suggest that nearly 40% of US hospitals now have experience with some form of lean.11

Implementation of Lean: Implementation of lean at Virginia Mason was not a single event, but required incremental change over years and even decades. This change was not simply in the implementation of a static system, but rather constant innovation to adapt the Toyota approach, highly successful in manufacturing, into the Virginia Mason Production System (VMPS) designed for the more human- and service-focused healthcare setting.12

The VMPS innovation was neither haphazard nor passive, but rather intentional and supported. Further, the VMPS is not simply a toolkit to be used for quality improvement activities, but rather, a cohesive management system.13 Lean as an improvement tool kit only will neither sustain nor spread; it is only as part of a unified management system with dedicated leadership that sustained overall transformation can occur.

Daily management is at the center of the VMPS, providing a common language and approach to management. The management system includes uniform approaches for daily accountability, problem solving, and process monitoring. Managers can and do move between highly diverse clinical and administrative units relatively seamlessly. Transparency and consistency in report-outs to higher level management and the overall institution enhances broad understanding and builds a unified institutional culture.

Having the management system in place is also critical to support the various multi-day formal lean improvement events as well as to provide the mechanism to translate event-related improvements into daily work. The improvement events themselves are based on assembling cross-functional teams with representatives from all involved areas. This serves to enhance understanding and communication among diverse work units.

Leadership in the VMPS model is not authoritative, top-down, but rather based on engagement and respect for workers throughout the system. The management system also supports scalability as it is fundamentally the VMPS system of daily management which provides the milieu for use of the lean tool kit.  Size only becomes a barrier to this implementation when there is insufficient overall leadership and vision to adopt the common management approach.

Support for innovation: Intrinsic to the VMPS is support for innovation at all levels. At Virginia Mason, we define innovation as “directed creativity implemented.”14 Each word of this definition is important.

  • Directed” implies that this is not a random process but rather arises to address some discrete problem or need.
  • Creativity” implies harnessing the new ideas of team members without constraints from mental valleys and institutional culture.
  • Implemented” indicates that innovation is only successful when it is applied directly and promotes change across the institution.

Each of these terms also speaks to the need for the institutional structure to support innovation. Directed creativity implies that there is a system for identifying problems and assembling appropriate teams to develop novel solutions. Functionally, this takes the form of creativity exercises within lean formal quality improvement events such as rapid process improvement workshops. We also have an innovation leadership team with board level representation to sponsor innovation in institutional strategic planning operations. Implementation requires the management system to translate and correlate the work of quality improvement teams with actual change in daily work.

For us, the VMPS bridges the development and implementation of new healthcare delivery interventions. Even within the management system itself, innovation is encouraged. Our institutional kaizen promotion office has yearly goals around aspects of the VMPS to be improved, and the Center for Health Care Improvement Science performs ongoing internal research into the success and failures of VMPS, helping to inform further management system innovation.

As one of the founders of Toyota’s management system, Taiichi Ohno, is commonly quoted as stating, “Without standards, there can be no improvement.”15 We would argue that similarly, without a consistent management method, there can be no innovation in healthcare delivery. It is this standard management system that enables us to direct, recognize, support, and spread innovation at the project as well as at the management level.

VMPS supported innovation has contributed to improved quality across the institution, with over 500 multi-day quality improvement events per year. As examples, targeted patient safety innovations have resulted in medication administration errors decreasing by over 70%,16 and patient falls related to delirium by over 40%,17 with medical liability insurance premiums consequently cut in half.  In addition, innovative clinical care pathways have contributed to a 33% decrease in mortality from sepsis,18 shorter length of stay for targeted surgical patients in orthopedics19 and neurosurgery,20 and decreases in unnecessary imaging studies.21

Consolidation and Innovation at Virginia Mason

At Virginia Mason, as at other institutions, we have been going through a period of growth and expansion over the past several years, acquiring physician practices and a hospital in our region, along with implementing key strategic partnerships. Recognizing the value of innovation, and the potential threat to innovation that consolidation holds, we have been deliberate in recognizing and supporting innovation throughout out delivery system.

At Virginia Mason, consolidation is always predicated on working toward full implementation of VMPS at all sites. The unified management model then provides a standardized structural foundation for management, improvement and innovation. This commonality enhances the pace and penetration of change.  We argue that this focus on the management method helps us avoid the challenges other institutions may face regarding size-limiting innovation.

The commonality of the VMPS helps to break down silos, formalizes and supports innovation, and enables spread. By extension, the challenge is not that consolidation inhibits innovation but rather that lack of a uniform management model limits innovation, and consolidation often leads to disparate models under the same overall institutional umbrella and governance.

As an example, Yakima Valley Memorial Hospital formally merged into the Virginia Mason Health System in 2016. Consolidation of the institutions has focused on rapid adoption of the VMPS at Memorial, with development of local expertise in both the lean toolkit and the management approach.

Innovation is fostered at both sites through the lean process improvement work, with spread enhanced by the common approach and language. Individuals from both institutions seamlessly participate in quality improvement events at the other sites. Though Memorial maintains its local connection to the community, its management approach mirrors that at the other sites. In addition, the enthusiasm of staff and management has helped deploy the management system more broadly.

Conclusion

In summary, the current rapid consolidation in healthcare has the potential to stifle critical innovation work.  However, institutional size, and consolidation need not inhibit innovation if there is unification and alignment in a critically important management system. At Virginia Mason, we focus on spread and standardization, and deployment of our management model across sites to insure continued support of innovation.

References

  1. Barker E. How consolidation is reshaping health care, HFMA Leadership, http://www.hfma.org/Leadership/E-Bulletins/2017/April/How_Consolidation_Is_Reshaping_Health_Care/. Accessed October 17, 2018
  2. Gaynor M, Town R. The Impact of Hospital Consolidation – Update, Robert Wood Johnson Foundation Synthesis Report, Robert Wood Johnson Foundation, (June 2012). https://www.rwjf.org/en/library/research/2012/06/the-impact-of-hospital-consolidation.html. Accessed October 16, 2018
  3. Ginsburg PB. Statement before the California Legislature, Senate Committee on Health Informational Hearing Health Care Market Consolidations: Impacts on Costs, Quality and Access. March 16, 2016. https://www.brookings.edu/wp-content/uploads/2016/07/Ginsburg-California-Senate-Health-Mar-16-1.pdf. Accessed October 16, 2018
  4. Committee on Quality of Health Care in America, Institute of Medicine. Crossing the Quality Chasm: A New Health System for the 21st Century. National Academy Press.   Washington, DC. 2001
  5. Greenhalgh T, Robert G, MacFarlane F, Bate P, Kyriakidou O. Diffusion of innovations in service organizations: Systematic review and recommendations. Milbank Quarterly 2004;82:581-629
  6. Mandel M. Scale and innovation in today’s economy. Policy Memo. Progressive Policy Institute. Washington DC. December 2011.
  7. Leal-Rodriquez AL, Eldridge S, Roldan JL, Leal-Millan AG, Ortega-Gutierrez J. Organizational unlearning, innovation outcomes, and performance: The moderating effect of firm size. Journal of Business Research 2015;68:803-809
  8. Aghion P, Akcigit U, Howitt P. What Do We Learn From Schumpeterian Growth Theory? Nobel Symposium on Growth and Development. 2013. https://scholar.harvard.edu/files/aghion/files/what_do_we_learn_0.pdf. Accessed October 17, 2018
  9. Avent R. “The Big Can, the Small Do,” The Economist Free Exchange blog, June 10, 2011. https://www.economist.com/free-exchange/2011/06/10/the-big-can-the-small-do. Accessed October 17, 2018
  10. Shefer D, Frenkel A. R&D, firm size and innovation: an empirical analysis. Technovation 2005;25:25-32
  11. Shortell S. Lean and related transformational performance improvement adoption and impact in US hospitals. Presentation at Lean Healthcare Research Symposium. Chicago. June 13, 2018. http://clear.berkeley.edu/wp-content/uploads/2018/06/Symposium-2018-2-Shortell-and-Rundall.pdf. Accessed October 17, 2018
  12. Kenney C. Transforming health care: Virginia Mason Medical Center’s pursuit of the perfect patient experience. Taylor and Francis. New York. 2011
  13. Kaplan GS, Patterson SH, Ching JM, Blackmore CC, “Why Lean Doesn’t work for everyone,” BMJ Quality and Safety 2014, 23:970-973
  14. Plsek P. Accelerating health care transformation with Lean and innovation. Taylor and Francis. New York. 2014
  15. Ohno T. Toyota Production System: Beyond large scale production. Taylor and Francis. New York. 1988
  16. Ching JM, Long C, Williams BL, Blackmore CC, “Using Lean to Improve Medication Administration Safety,” Joint Commission Journal of Quality and Safety 2013: 39; 199-204
  17. Ferguson A, Uldall K, Dunn J, Blackmore CC, Williams B. Effectiveness of multifaceted delirium screening, prevention, and treatment initiative on the rate of delirium falls in the acute care setting. Journal of Nursing Care Quality 2018;33:213-220
  18. Ferguson A, Coates E, Osborn S, Blackmore CC, Williams B. Effectiveness of Early, Nurse Directed Sepsis Care on Bundle Compliance, Rapid Response Team Rates, and Sepsis Mortality in the Emergency Department and Inpatient Settings. American Journal Nursing 2019;119:52-58
  19. Sorenson, LS, Streifel JG, Blackmore CC, Mecklenburg RS, Williams BL, Idemoto LM, “A Multifaceted Intervention to Improve the Quality of Care for Patients Undergoing Total Joint Arthroplasty,” American Journal of Orthopedics, in press
  20. Bradywood A, Farrokhi F, Williams B, Kowalczyk M, Blackmore CC, “Reduction of hospital length of stay in lumbar fusion patients with implementation of an evidence based clinical care pathway, Spine 2016;42:169-176
  21. Blackmore CC, Mecklenburg RS, Kaplan GS, “Effectiveness of clinical decision support in controlling inappropriate imaging,” Journal of the American College of Radiology 2011;8:19-25


A Program to Influence Healthy Behaviors in Low-Income Communities

Aditi Borde and Jacqueline Gerhart, Kenan-Flagler Business School, University of North Carolina at Chapel Hill

Contact: Aditi Borde, Aditi_Borde@kenan-flagler.unc.edu

This case study won the 2019 Case Competition sponsored by the Business School Alliance for Health Management (BAHM) and hosted by Harvard Business School’s Health Care Initiative. The competition focused on business-based solutions for incentivizing health behaviors in low-income communities.

Abstract

What is the message?

One-third of Americans are obese1, and obesity is the leading risk factor for developing diabetes2. Rural, low-income diabetics, particularly in North Carolina’s Eastern region, face significant economical and geographical barriers to healthcare. Our proposal leverages a partnership with a retailer like Walmart to bring an incentivized lifestyle management program to diabetics in rural communities. As we continue, we use Walmart as an example, recognizing that there are a number of retailers that we could also partner with. The Convenient Access for Rural Diabetics (CARD) program will provide convenient, one-stop-shopping for key components of diabetes management – healthy foods, exercise, filling prescriptions, regular A1c testing, retinopathy screens, and diabetes education.

The CARD program 1) enrolls diabetics with Blue Cross Blue Shield North Carolina (BCBSNC) insurance and provides them with an activities stamp card. Participants can 2) complete all six Health Initiative Activities at their local Walmart, including buying healthy food in the produce section, filling prescriptions and checking A1c blood levels at booths in the pharmacy, getting retinopathy screenings at the Vision Center, and attending on-site diabetes awareness walks and Walmart Wellness Days both hosted by the American Diabetes Association. For completing each of these Health Initiative Activities, the participants will 3) immediately receive a Walmart gift card as a reward.

What is the evidence?

Analysis by that authors suggests that the projected cost of a relevant program for the first three years is $29.6M. An established company would provide the key infrastructure for the program, and start-up costs will be funded primarily through pharmaceutical company sponsors and grants. The primary revenue stream will come from 50% of BCBSNC’s claims reductions, projected to be $31.7M over three years.

Submitted: January 15, 2019; accepted after review: April 15, 2019.

Cite as: Aditi Borde and Jacqueline Gerhart. 2019. The CARD Program – Influencing Healthy Behaviors in Low-Income Communities. Health Management Policy and Innovation, Volume 4, Issue 1.

Overview

Obesity is associated with lower quality of life and poorer health outcomes, including type II diabetes3-5. Low-income rural diabetics in Eastern North Carolina require healthy diet, exercise, filled prescriptions, regular A1c testing, retinopathy screenings, and health education6-11, yet face significant economical and geographical barriers. A comprehensive diabetes management program is required that 1) aligns with the rural lifestyle, 2) is convenient, 3) brings care into local communities, and 4) supports both financial and physical health. The Convenient Access for Rural Diabetics (CARD) program is unique partnership with Walmart to bring a comprehensive diabetes lifestyle management program into local communities. Participants of the program will earn gift card rewards for buying produce, exercising, filling prescriptions, testing their A1c levels, getting retinopathy screenings, and improving health literacy, all at their local Walmart location.

 Background

A person with obesity faces a shorter life with significant health complications, less functional mobility, higher costs with lower pay, and intense social stigma1-5. As a whole, obesity is responsible for driving up US healthcare costs by 29%12. The challenges associated with obesity are not going away, as one in three Americans are currently classified as obese and the rate of obesity has doubled since 198013-14.

Figure 1: Obesity and diagnosed diabetes prevalence by county in North Carolina, 2006-2013

Source: https://www.cdc.gov/diabetes/data/countydata/countydataindicators.html


Obesity is the leading risk factor for developing diabetes2. Studies suggest that approximately 40% of people with obesity experience adverse metabolic events that are precursors to developing diabetes3. Lifestyle-treatment options for diabetes and obesity are very similar, with many studies showing that the critical components for treatment are weight loss and physical activity2,6-7. In the US, 26.1% of people have prediabetes and 9.4% of people have diabetes, with type 2 diabetes accounting for >90% of all diagnosed cases of diabetes in adults15,16.

Target Population and Demographics

North Carolina (NC) has a large population of rural, low-income diabetics who face additional barriers to diabetes care. The rate of the rural population in NC is twice the national rate17, and 93% of counties in NC have diagnosed diabetes rates higher than the national average18. As defined by the NC Association of Local Health Directors, NC is divided into ten regions19. The program will focus on Regions 8, 9, and 10 in Eastern NC because these regions are mostly rural and have the largest diagnosed diabetes percentage by county18. Within the target regions, there are 29 Walmart Supercenters, each with a Vision Center, in-store pharmacy, and groceries (including a produce section)20.

Table 1. Rural versus non-rural Americans

Rural Non-rural
Distance to health provider21 43.6 miles 19.3 miles
# primary care physicians per 100,000 patients22 39.8 53.3
Average income22 $45,482 $53.657
Uninsured rate23 32% 26%
Adults who would describe health status as fair/poor22 19.5% 15.6%
Have internet24 58% 80%
Have a smartphone24 67% 77%


Barriers and Solutions

  1. Cost: In the US, 45% of diabetics have skipped care because of affordability issues, and some patients’ costs have jumped from $300 to almost $1,000 in the last year25.
  2. The CARD program is free to join, and provides financial incentives to diabetics to manage their disease.
  3. Low adherence rates: Of type II diabetics, very few are adherent to their prescribed diet regimen (37%), exercise routine (35%), and medications (53%)26.
  4. The CARD program makes diabetes management convenient, allowing participants to manage their health during their regular shopping.
  5. Rural geography: Ninety-five percent of NC is a designated Health Professional Shortage Area27, and >25% of Eastern NC people have not seen a doctor in over two years28.
  6. The CARD program brings comprehensive diabetes management to local communities in a remote healthcare setting, providing one-stop shopping to participants.
  7. Lack of technology: In the US, 42% of rural residents do not use internet regularly24.
  8. The CARD program forgoes a digital solution in favor of a back-to-basics solution that all rural residents can use.
  9. Low health literacy: Nearly 50% of participants in a survey of Southeastern US rural health patients were found to have health literacy difficulties29.
  10. The CARD program combines the many facets of diabetes care into a single, well-illustrated activities stamp card that is simple to use.

Recommendations

Partnership

Our proposal leverages a unique partnership with Walmart to bring an incentivized lifestyle management program for diabetics to rural, low-income communities. The CARD program encompasses three steps: patient capture, patient activity, and rewards. The program starts when Walmart customers go to the Walmart pharmacy. Upon filling a diabetes prescription, the pharmacy staff member will engage with the patient to tell them about the CARD program and how they can participate. The pharmacist or technician will provide the participant with an activities stamp card and a welcome packet. To maximize enrollment, flyers will be posted at each cash register, encouraging diabetic customers to ask how they can enroll in the CARD program.

Figure 2: Overview of the CARD program

Upon receiving his or her activities stamp card, the participant can partake in the six Health Initiative Activities. When the participant completes one of these activities, he or she will get a stamp on the card and is immediately rewarded with a Walmart gift card redeemable at any brick and mortar location. The number of stamps possible for each of the Health Initiative Activities corresponds to the annual recommended frequency of completing that activity. The amount of the gift card reward for each activity corresponds to the level of participant effort required to complete it, and each participant can earn a maximum of $300 per year.

Table 2. The Six Health Initiative Activities

Health Initiative Activity Buy $10 worth of produce Fill a prescription Obtain A1c levels Screen for retinopathy Participate in a diabetes awareness walk Attend a Walmart Wellness Day
Location Produce Department Walmart Pharmacy Walmart Pharmacy Vision Center Parking Lot Storewide
Outcome Healthy habits Medication adherence Regular A1c testing Preventative health Exercise Diabetes education
Number of stamps 12 12 4 1 4 2
Gift card amount $5 $5 $15 $20 $30 $10


The A1c Now+® test will be utilized for point-of-care A1c testing because the test is easy to use, minimally invasive with fast results (less than 5 minutes), FDA-approved and CLIA-waived, and economical (only costs $9 per test)30. A1c-Now+® monitors will be placed in the pharmacy waiting area, where participants can test their blood levels in relative privacy and with pharmacy staff members within reach to offer assistance if needed. There will be space on the back of the activities stamp card for participants to record their A1c level for their reference. These tests will be offered free of charge for all participants. Retinopathy screens will also be free of charge for those who are uninsured or unable to pay.

Walmart currently partners with the American Diabetes Association (ADA) to host quarterly Walmart Wellness Days in which customers can engage with pharmacists to answer health questions and to receive free health screenings. The ADA follows up with interested customers to provide them with physician recommendations. By attending these events, participants can increase their knowledge of how to manage their diabetes, while also increasing clinician engagement. Through the expansion of Walmart’s existing partnership with the ADA, Walmart will host diabetes awareness walks quarterly, which will encourage participants to exercise regularly in a community setting.

Competitive Analysis

The CARD program is currently the only in-person solution that overcomes the rural-urban digital divide to bring diabetes management directly to patients. Omada Health and Virta digital health solutions help patients self-manage their diabetes, providing virtual coaching and diet management support31-32. However, in addition to having a hefty price tag of up to $150/month, these programs also require internet access, which 42% of rural people do not currently have24. Fitness and diet apps are available that link to wearable devices in order to encourage and monitor physical activity, but require internet access and a high degree of health literacy to fully utilize. In-home A1c and glucose monitoring devices, like Dexcom Continuous Glucose Monitoring33, are now available for residential use, but can cost thousands of dollars for patients if they are not covered under insurance. Incentive and online rewards programs are commonly offered through private insurance programs, but again require an internet connection to sign-up and receive rewards. Finally, lifestyle management programs are often offered through healthcare providers. These can be effective in-person solutions, but may require significant travel for those living in rural communities, and can be expensive to the patient.

Table 3. The CARD program versus competitors

CARD Program Omada Health31 / Virta32 Wearables and Lifestyle Apps Dexcom Continuous Glucose Monitoring33 Private Insurance Online Rewards Program Primary Care Provider
Cost FREE $130-$400 /month $100-$300 $1500 FREE $20-$100 per visit
Rewards Favorable Neutral Neutral Neutral Favorable Neutral
No extensive sign-up Favorable Unfavorable Favorable Neutral Neutral Neutral
No technology literacy required Favorable Unfavorable Unfavorable Unfavorable Unfavorable Favorable
No internet connection required Favorable Unfavorable Unfavorable Neutral Unfavorable Favorable
No smartphone required Favorable Unfavorable Unfavorable Unfavorable Favorable Favorable
Does not require travel (convenient) Favorable Favorable Favorable Favorable Favorable Unfavorable
Face-to-face interaction Favorable Unfavorable Unfavorable Unfavorable Unfavorable Favorable

Revenue Model

Over the course of three years, $29.6M will be needed to fund the program. Walmart will provide the primary physical infrastructure for the program. See Supplementary Material for a detailed budget and balance sheet. It is assumed that 25% of participants will adopt the program, and 75% participants will adhere once they begin the program34. Given these assumptions and a 7% growth rate, $8.8M will be required in Year 1, $9.9M in Year 2, and $10.9M in Year 3 ($29.6M in total).

Pharmaceutical companies (e.g. Eli Lilly, Novo Nordisk, Sanofi, and Merck) that manufacture diabetes medications will sponsor the large majority of start-up costs because the CARD program incentivizes diabetics to fill their prescriptions on a regular basis. Additionally, grants from the ADA, NIH National Institute of Diabetes and Digestive and Kidney Diseases, and NC Department of Health and Human Services will fund the remaining upfront costs.

Blue Cross Blue Shield of North Carolina (BCBSNC) will serve as the program’s primary revenue stream. BCBSNC currently holds 96% of North Carolina’s private insurance market share and has significant interest in reducing claims for their members35. If the CARD program decreases BCBSNC’s claims for diabetes-related hospitalizations or related complications by a statistically significant amount, they will pay the program 50% of the cost savings, determined by the difference between actual and expected claims. A participant’s actual year-end claims will be compared to his or her expected claims, calculated from that participant’s average yearly total claims for the past five years. In subsequent years, participants’ expected claims will be extrapolated based on claims from comparable populations (i.e. rural diabetics who are not enrolled in the CARD program).

More than 20% of US healthcare dollars are spent on diabetes36. Diabetes-related hospitalizations and complications can easily exceed $20,000 per patient per hospitalization37. Therefore, even a slight decrease in hospitalizations will have a large impact in decreasing claims paid by BCBSNC. The partnership is low risk, high reward for BCBSNC because if there are not significant cost savings, BCBSNC will not be required pay any money to the program. Reduction in hospitalizations is projected to result in lower rates of cardiovascular disease (5%), ischemic heart disease (6%), stroke (7%), diabetic ketoacidosis (28%), and leg amputations (42%), resulting in a total projected cost reduction of $31.7M over three years.

Implementation

Q2-Q4 2019 will involve contracting with Walmart and BCBSNC, followed by training for managers and customer service, pharmacy, and Vision Center staff on how to administer the program rewards in Q1 2020 – Q2 2020. Q3 2020 – Q4 2020 will involve setting up the infrastructure required to start the program at the 29 Walmart Supercenter locations: distributing welcome packets and activities stamp cards, barcode scanners at the various stations for collecting stamps and rewards, and the A1c-Now blood testing stations in the pharmacies. This will allow for the first site launch in Q1 2021.

Figure 3: Timeline for implementation of the CARD program

The CARD program will be implemented in phases in order to measure its success at various checkpoints. Phase 1 will involve targeting 5,000 BCBSNC members for enrollment in order to prove the efficacy of the CARD program. In phase 2 of the program, enrollment will be expanded in Q1 2022 by 10,000 members to include both Medicare and Medicaid members and BCBSNC members, as rural low-income patients are more likely than their urban counterparts to have Medicare and Medicaid35. In phase 3, 10,000 additional participants of any insurance type can enroll in the program, bringing total enrollment to ~25,000 participants by Q1 2023.

To conduct performance evaluation of the CARD program, a barcode system will be used to enroll participants in order to link individual participants to their claims data. The activities stamp card will be scanned each time a participant receives a stamp in order to track program adherence. After phase 3 of the program, claims data comparisons of participating and non-participating diabetics will be made annually to determine efficacy of the program, which will transition into quarterly evaluation upon expanded enrollment.

Risk Mitigation

One potential risk with our solution is that Walmart’s participation is necessary to implement the program. However, Walmart stands to gain several key things under our solution. Walmart can expect guaranteed revenue from gift card purchases for program incentives and guaranteed revenue from retinopathy screenings. Gift card use and additional time spent in the store will lead to increased spending by program participants. This solution also aligns with Walmart’s healthcare strategy, since it is seeking to expand into the healthcare space through collaborations with Humana37. With increased use of mail-order prescription services, pharmacies in particular are looking to expand their services. By acting as the point of enrollment and location for A1c testing in the program, pharmacies can achieve this goal. Should Walmart not participate, partnerships with other similar retailers, such as Target, can be pursued.

Another risk is that participants might not modify their behaviors or respond to a rewards program. However, this rewards program is based off of the Transtheoretical Model of Behavior Change38, which was successful in promoting lifestyle changes in a study related to smoking cessation and condom use39. Low-income populations that were provided $10 vouchers for fruits and vegetables yielded voucher redemption rates were approximately 90%40.

Healthcare behavioral modification programs can often face regulatory liabilities. The CARD program is HIPAA compliant, CLIA-exempt, and requires no certificate of need.

Finally, funding could cease for the CARD program. Should this happen, the CARD program is easily modifiable, simple to scale back, and non-labor intensive. Scale backs would not require layoffs and scale ups do not require hiring new employees.

Scaling

The CARD program will be scaled in four phases – by network, geography, partnerships, and disease states. Phase 1 involves expanding beyond payers to providers. Then, extending an invitation to the providers will result in a win-win, because it decreases the cost to the payer while increasing the providers’ connection to the community. Phase 2 involves scaling up across Walmart’s 144 Supercenter locations throughout NC, then scaling to >3500 Supercenters in every part of the United States, allowing for easy market penetration nationwide. In Phase 3, partnerships can be made with other retailers, such as Target, Walgreens, and Costco, to expand the program and enroll more participants. In Phase 4, similar lifestyle management programs can be developed using the CARD program framework that focus on incentivizing patients with other chronic disease states, many of which would entail similar activities (diet, exercise) as diabetes and are also linked to obesity.

Figure 4: Scaling plan for the CARD program

Conclusion

Rural, low-income diabetics, particularly in North Carolina’s Eastern region, face significant economical and geographical barriers to healthcare. We are proposing a partnership with Walmart to bring an incentivized lifestyle management program to diabetics in rural communities. The Convenient Access for Rural Diabetics (CARD) program will provide convenient, one-stop shopping for key components of diabetes management. The CARD program 1) enrolls diabetics and provides them with an activities stamp card. Participants can 2) complete all six Health Initiative Activities at their local Walmart, including buying healthy food in the produce section, filling prescriptions and checking A1c blood levels at booths in the pharmacy, completing a health risk assessment at the Pursuant Health kiosk, and attending on-site diabetes awareness walks and Walmart Wellness Days, both hosted by the American Diabetes Association. For completing each of these Health Initiative Activities, the participants will 3) immediately receive a Walmart gift card as a reward. Reductions in hospitalizations as a result of our proposal are predicted to result in more than $30M in cost savings in the first three years of implementation, with many potential ways to scale the CARD program to reach as many diabetics as possible.

Supplemental-Exhibits

References

  1. https://www.nhlbi.nih.gov/health/educational/wecan/healthy-weight-basics/obesity.htm
  2. https://www.ncbi.nlm.nih.gov/pmc/articles/PMC3066828/
  3. https://www.jci.org/articles/view/78425
  4. https://news.harvard.edu/gazette/story/2012/03/the-big-setup/
  5. https://www.sciencedirect.com/science/article/abs/pii/S1521690X13000365
  6. https://www.ncbi.nlm.nih.gov/pmc/articles/PMC5426415/
  7. http://care.diabetesjournals.org/content/39/11/2065
  8. https://www.ncbi.nlm.nih.gov/pmc/articles/PMC4966497/
  9. https://www.ncbi.nlm.nih.gov/pubmed/29740786
  10. https://www.ncbi.nlm.nih.gov/pmc/articles/PMC5800256/
  11. https://www.ncbi.nlm.nih.gov/pmc/articles/PMC1424643/
  12. https://www.sciencedaily.com/releases/2018/02/180208180356.htm
  13. https://www.cdc.gov/obesity/data/adult.html
  14. https://www.hsph.harvard.edu/news/press-releases/worldwide-obesity/
  15. https://www.cdc.gov/diabetes/basics/type2.html
  16. https://www.cdc.gov/media/releases/2017/p0718-diabetes-report.html
  17. https://www.northcarolinahealthnews.org/2018/01/22/n-c-rural-health-numbers/
  18. https://www.cdc.gov/diabetes/data/countydata/countydataindicators.html
  19. http://www.ncalhd.org/map/
  20. https://www.walmart.com/store/finder
  21. https://www.shsu.edu/centers/rural-studies/TRS/TRS%202013%20Health%20Report.pdf
  22. https://www.ruralhealthweb.org/about-nrha/about-rural-health-care
  23. https://www.ncchild.org/whats-right-solution-health-care-rural-north-carolina/
  24. http://www.pewresearch.org/fact-tank/2017/05/19/digital-gap-between-rural-and-nonrural-america-persists/
  25. https://www.usnews.com/news/health-care-news/articles/2018-06-18/study-almost-half-of-diabetics-skip-care-because-of-high-cost
  26. http://clinical.diabetesjournals.org/content/24/2/71
  27. https://files.nc.gov/ncdhhs/documents/2018%20HPSA%20Full%20Map.jpg
  28. https://schs.dph.ncdhhs.gov/data/brfss/2015/nc/nccr/topics.htm#ds
  29. https://rnojournal.binghamton.edu/index.php/RNO/article/download/187/162/0
  30. https://ptsdiagnostics.com/a1cnow-plus-system/
  31. https://go.omadahealth.com/
  32. https://www.virtahealth.com/
  33. https://www.dexcom.com/
  34. https://www.ncbi.nlm.nih.gov/pubmed/17044763
  35. https://www.kff.org/state-category/health-coverage
  36. https://asmbs.org/resources/weight-and-type-2-diabetes-after-bariatric-surgery-fact-sheet
  37. https://www.wsj.com/articles/walmart-in-early-stage-acquisition-talks-with-humana-1522365618
  38. http://sphweb.bumc.bu.edu/otlt/MPH-Modules/SB/BehavioralChangeTheories/BehavioralChangeTheories6.html
  39. https://www.ncbi.nlm.nih.gov/pmc/articles/PMC5486267/
  40. https://www.sciencedirect.com/science/article/pii/S0002822306001416


A Value Proposition for AI-Enabled Population Health Management

Chris DeRienzo, MD, Cardinal Analytx; Michael Barr, MD, NCQA; Nigam Shah, MBBS, and Arnold Milstein, MD, Clinical Excellence Research Center and the Department of Medicine, Stanford University

Contact: Arnold Milstein, amilstein@stanford.edu

Abstract

What is the message?

This paper proposes a unifying value proposition for the application of modern data science tools to population health management. The authors believe artificial intelligence (AI) will deliver value to health plans, large employers, providers, and patients primarily in two ways – first, through linear improvements in traditional health plan functions like reserve setting and fraud prevention, and second through geometric improvements in pairing predictions with targeted screenings and upstream clinical and social-determinant interventions.

What is the evidence?

While AI may be hitting “peak hype” in healthcare, Americans are in truth surrounded by machine learning. Proof points exist across industries on the power of AI to perform markedly better at sorting tasks than either humans or baseline statistical models, and the health plan world will be no different. Furthermore, AI has proven able to redefine entire technology platforms in areas like speech and image recognition. Applied to population health management, the same power will create entirely new health platforms based on increasingly creative benefit design.

Submitted: February 22, 2019; accepted after review: April 15, 2019

Cite as: Chris DeRienzo, Michael Barr, Nigam Shah, Arnold Milstein. 2019. A Value Proposition for AI-Enabled Population Health Management. Health Management Policy and Innovation, Volume 4, Issue 1.

Introduction

In a widely published 1994 interview with Rolling Stone Magazine, Steve Jobs said “Technology is nothing. What’s important is that you have a faith in people, that they’re basically good and smart, and if you give them tools, they’ll do wonderful things with them.”  When it comes today’s buzziest technology – artificial intelligence (AI) – people are only just beginning to figure out how to use their newest tools to transform entire industries.  Though some argue we’ve reached peak AI hype, the authors believe significant potential remains for AI-powered solutions to transform population health management in the service of healthier people.  What’s lacking, however, is a common framework — a value proposition that captures the wide range of possible applications of modern data science tools from managing core health plan operations to reducing members’ costs and improving clinical outcomes.

In this paper, we present a unifying construct that we believe forms the base of driving value in AI-enabled population management  – namely, that AI will simultaneously drive a digital metamorphosis of traditional health plan functions while creating new platforms to fundamentally improve people’s health.

The machine learning metamorphosis of traditional health plan processes: Supervised and reinforcement learning

Incumbents in the health plan space today grapple with real business problems that AI can help resolve.  These are extant, functional challenges that baseline technology solutions can address but will prove inferior to AI-enabled algorithms.  At present, the most promising AI tools with real application to these business problems are grounded in two primary modes – supervised machine learning and reinforcement learning.

At its core, supervised learning is the combination of curated data sets containing the data (for predictions) and the answer.  In these kinds of applications, machine learning models “win” by using data to predict the best answer.  While this sounds like a traditional approach to data analytics, unlike conventional regression models a machine learning model is not constrained by assumptions about the best way to analyze the data or about what variables (individually or in combination) may be most important in yielding an optimized prediction.

Reinforcement learning is a little more complex as the data themselves are not curated in advance.  Instead, reinforcement learning models are built using feedback to help impute  “correct” or “incorrect” answers.  These algorithms learn through interaction with the system. For example, if a reinforced learning speech algorithm recognizes words incorrectly, then subsequent user behavior, such as repeating the word, provides feedback that the algorithm made a mistake the first time.

Of course, supervised and reinforcement learning can also work together. Consider training your favorite speech-enabled smartphone assistant with the sounds of 100,000 people saying “tomato” (supervised learning).  Then imagine setting her loose into the wild, unleashing her algorithm’s existing “tomato” recognition on new consumers who provide new data to learn from and further refine her “tomato” algorithm (reinforcement learning).

These two machine learning constructs – both of which mirror aspects of human learning within a targeted subject area – are applicable to any number of traditional population health management functions.  Here are just three examples.

Example 1: Automation of manual processes

As early as 2003, the United States Patent and Trademark Office reported patent applications for models that “automatically classify health insurance claims using classification models that are trained to predict whether a health insurance claim will be accepted or rejected by a target payer, analyze why the claim will be rejected, and then target the intervention(s) needed to appropriately handle the claim.”1  In late 2017, IBM and Singapore insurer NTUC Income announced a partnership that capitalizes on patents like these to automate the processing of 14,000+ pre/post hospitalization2 claims each month.  When JP Morgan announced a similar transition to using a machine learning algorithm for commercial loan agreements it reported taking only seconds to perform tasks that historically took lawyers 360,000 hours to do by hand.3  Such efficiency gains rival those of the industrial revolution, and promise to spread across other back office functions that traditionally demanded endless hours of human tedium.

Example 2: Actuarial reserve-setting

In 2016, the Society of Actuaries spent barely a page of its 90 page report on the Accuracy of Claims-Based Risk Scoring Models to machine learning.4  Barely six months later, the same group hosted a 75 minute “Primer” webcast titled “Insurance Analytics with Machine Learning.”  With training steeped in the need to quickly identify and integrate emerging trends into their work, it should be no surprise that actuaries rapidly recognized the power of machine learning to drive improved individual and population-level risk analyses.  The sheer mechanics of a machine learning model’s statistics enables an actuary to identify hidden relationships in massive datasets without pre-specifying their importance.  Like the transition from SD to HD video, these novel connections promise a less pixelated view of a population’s actuarial risk, thereby also yielding more precise estimates of risk, better understandings of markets and market segments, more accurate bidding models, and optimized plan design.

Most importantly, however, is their potential impact on the work of human actuaries.  Despite their power, AI-enabled risk models still need real people to interpret their outputs.  In an ideal example of AI designed to augment rather than overpower human intelligence, risk-based AI-enabled solutions will allow an actuary to practice at the top of her license, focusing her limited time and resource on making her best-informed, most accurate risk assessment.

Example 3: Early-identification and prevention of fraud

Fraud prevention is a third obvious candidate for the use of an AI tool in the health plan world,5 in much the same manner as in the credit card industry,6 finance,7 and the rest of insurance market.8  By training on a massive universe of labeled compliant and fraudulent claims, even a basic machine learning algorithm can be applied upstream in the claim payment pathway, signaling to a human when the characteristics of a claim warrant deeper investigation.  Instead of weeding through 4 billion U.S. health insurance claims each year by hand, AI-powered fraud analysis can point humans to the very small, but overall hugely expensive, number of fraudulent ones that demand the most human attention.  Moreover, in staying one step ahead of fraudsters, AI may also support a defensive strategy against increasingly creative approaches to fraud developed using novel machine learning-based strategies.

Create novel platforms to fundamentally transform population health

While machine learning provides immediate value through automation of traditional health plan processes, AI’s major long-term benefit will be the broader transformation of population health management.  Entities on the leading edge of the technology adoption curve – including forward-thinking incumbent health plans, tech-native new market entrants, providers with population health business models, and self-insured employers – have already begun adopting AI-enabled platforms to address both costs and clinical outcomes.  Here are three examples of how we believe AI can geometrically change the population health management value equation.

Example 1: Augment human-based care / Move clinical interventions upstream

According to the Centers for Disease Control (CDC), the United States spends nearly $3 trillion each year – or 90% of all health expenditures – to manage Americans’ chronic challenges with physical and mental health.9  In Medicare alone, the Commonwealth Fund reported in 2017 that the average frail elderly patient – who made up only 4% of Medicare’s total population – generated over $6,500 per capita in excess preventable healthcare spending each year.10

While identifying and managing high-cost patients is nothing new to health plans, existing technologies have failed to support the identification of the 60% of new patients who join the “high cost” cohort any given year.  AI promises to change that, enabling plans to identify members whose health will worsen before it happens, figure out why, and offer clinicians a directed opportunity to intervene upstream similar to the opportunity offered by clinical “early warning systems” in use at hospitals around the nation.

A recent article published by AM and NS shows this is more than just theory.11  Using Denmark’s National Health Service and Civil Registration System as data source, they analyzed the effectiveness of a machine learning model’s ability to predict “cost blooms” for the entire population of Western Denmark from 2004 to the end of 2011.  Importantly, these “blooms” weren’t already high-cost high-utilizers – rather, these Danes were seemingly fine one year and markedly sicker and more expensive the next.  Compared to traditional diagnosis-based models, the AI-enabled model was 30% better at finding people who would become sick.

The implication is clear, if a little Minority Report like.  With novel models of high-touch and concierge primary care exploding across America, imagine being able to target the most comprehensive — and highest-cost — care coordination teams not only to today’s highest-acuity patients but to those members whose cost and clinical outcome curves stand to bend the earliest and the furthest.  While complete delegation of intervention targeting to machine learning models may risk exacerbating silent dataset biases,12 we believe this could be overcome in two major ways: first, through purposeful attention to bias during model creation, curation, and validation, and second, by again designing AI-enabled solutions to augment rather than entirely replace human-to-human care management.

Example 2:  Align elective patient needs with ideal providers

While they may disagree on how “value” is defined, it’s no secret that health plans and providers alike recognize a spectrum of value exists within any healthcare market.  In work funded by the Peterson Center on Healthcare, Stanford University’s Clinical Excellence Research Center (CERC) has worked to systematically identify “Bright Spots” providers operating at the frontier of value, defined by both high quality of care and low total annual healthcare spending.  Were the major features of Bright Spots providers in primary care alone to be adopted nationwide, CERC conservatively projects a potential savings of more than $300 billion.13

That said, the current era of value-based care suffers from a fatal flaw. Outside of full-risk capitation models, the majority of provider revenue still driven by fee-for-service medicine.  As a result, any value-based reimbursement model that subsequently decreases volume cannibalizes one revenue stream for another.  This is where AI-powered choice architecture can make a real difference.

A recent New York Times article14 highlighted how the treasure trove of Amazon’s customer purchase data is being used to hyper-target advertising for local companies.  Instead of a baby formula company targeting consumers who recently purchased bottles, imagine instead a tool like this being used to help shape a patient’s health care experience, driving patients to higher-value in-network Bright Spots providers.  Instead of targeting a purchase of a product, these approaches could also target purchases of services, food choices or health behaviors.

Consider the potential effectiveness of a program to encourage utilization of Bright Spots providers, delivered when people are first contemplating utilization — or even before they are consciously considering such a purchase — and the benefit of such a program for patients, high-value providers, plans and employers.  We see profound changes possible for markets driven by these kinds of programs, perhaps even providing the final bridge for providers to accept more risk in return for market share.

Example 3: Dramatically improve benefit design

On the consumer side, AI already drives many of the purchasing decisions we make without our knowing it.  As noted above, Amazon is not only pushing us recommendations based on our own experience and that of millions of other consumers but selling the ability to target us as members of a definable cohort.  These same kinds of cohorts exist in health:  men aged 35-49 with rising risk of heart disease, women aged 18-34 with rising risk of diabetes, and so on.  People in these cohorts may not bloom in cost this year or next year, but they’re statistically more likely to bloom at some point than people in other, healthier cohorts.

Even relatively rare cohorts stand to experience significant benefit.  Consider people with familial hypercholesterolemia (FH), which affects about 1 in 250 global citizens.15  FH is caused by mutations in genes coding for the LDL receptor which reduce the receptor’s ability to recycle so-called “bad cholesterol.”  The result yields circulating LDLs of up to six times higher and a risk of coronary heart disease five times higher than the general population.  Yet in the U.S., fewer than 10 percent of those with FH know they have the disease.

While pharmacogenetic research has made it possible to both diagnose and treat FH, screening or treating the entire world population remains wildly cost prohibitive.  Data science offers a solution. Working with the FH Foundation, NS and a Stanford colleague trained an algorithm on the electronic health records of known FH cases to identify individuals at risk of FH.  In a validation study, the algorithm was correct 8 out of 10 times when it flagged a patient as high-risk for FH.  Imagine using such an approach at scale, offering near instantaneous economic optimization of screening/treatment combinations for hundreds if not thousands of types of high-risk patients.

With the massively increased effectiveness of AI-powered targeting, we can expect similar improvement in benefit utilization.  Those payers with the longest time-horizons – think big single-payer nationalized systems, Medicare, and perhaps some very large employers – stand to gain the most economically from such an advantage.  Imagine identifying a member at age 67 who in the next ten years has a modifiable trajectory in clinical outcomes and cost ranging from $75,000 to $750,000.  With radically redesigned benefit structures to address not just clinical determinants of health but personal-choice driven determinants of health (food choice, activity, smoking, injury prevention), the human health and economic impacts of such an approach could both prove enormous.

Looking forward

In its landmark 2017 report assessing the potential impact of AI in healthcare, the elite JASON group16 noted that “Unlike previous eras of excitement over AI, the potential of AI applications in health may make this era different because the confluence of the following three forces has primed our society to embrace new health centric approaches that may be enabled by advances in AI: 1) frustration with the legacy medical system, 2) ubiquity of networked smart devices in our society, 3) acclimation to convenience and at-home services like those provided through Amazon and others.”  We wholeheartedly agree.  As we’ve outlined here, we believe the value proposition AI-enabled population management will follow a logical flow:

With American consumers not only prepared for but expecting intelligent services and increasingly accustomed to trading better price, convenience, quality, and experience in exchange for access to their data – the time for AI-powered health plans is now.  Whether captured by tech-native newcomers, attentive incumbents, or vertically aligned combinations of the two, AI’s power will unquestionably drive new value in population health management.

References

  1. Rao B, Landi W, Rucker D, Inventors. Systems and methods for automated classification of health insurance claims to predict claim outcome. 2005-06-23, 2005.
  2. NTUC Income becomes the first insurer in Singapore to use IBM Watson Explorer to improve the efficiency of pre- and post-IncomeShield claims – IBM Fintech portal [press release]. https://www.ibm.com/think/fintech/asia/, August 15 2017.
  3. Brynjolfsson E, McAfee A. The Business of Artificial Intelligence. Harvard Business Review. 2017(July).
  4. Hileman G, Steele S. Accuracy of Claims-Based Risk Scoring Models. 2016.
  5. Shin H, Park H, Lee J, Jhee WC. A scoring model to detect abusive billing patterns in health insurance claims. Expert Systems with Applications. 2012;39(8):7441-7450.
  6. Ryman-Tubb N, Krause P, Garn W. How Artificial Intelligence and machine learning research impacts payment card fraud detection: A survey and industry benchmark. Engineering Applications of Artificial Intelligence. 2018;76:130-157.
  7. Castellanos S, Nash K. Bank of America Confronts AI’s ‘Black Box’ With Fraud Detection Effort. Wall Street Journal. 2018. Accessed January 30, 2019.
  8. Melendez S. Insurers turn to artificial intelligence in war on fraud. Fast Company. 2018. Published June 26, 2018. Accessed January 30, 2019.
  9. CDC. Health and Economic Costs of Chronic Disease. https://www.cdc.gov/chronicdisease/about/costs/index.htm. Published 2018. Updated November 2018. Accessed January 30, 2019, 2019.
  10. Jha A. Preventable Spending High-Cost Medicare Patients. The Commonwealth Fund. https://www.commonwealthfund.org/publications/journal-article/2017/oct/concentration-potentially-preventable-spending-among-high. Published 2017. Accessed January 30, 2019.
  11. Tamang S, Milstein A, Sørensen HT, et al. Predicting patient ‘cost blooms’ in Denmark: a longitudinal population-based study. BMJ Open. 2017;7(1):e011580.
  12. Zou J, Schiebinger L. AI can be sexist and racist — it’s time to make it fair. Nature. 2018;559(7714):324.
  13. Bright Spots Research. Clinical Excellence Research Center – Stanford Medicine. https://med.stanford.edu/cerc/research/bright-spots-research.html. Published 2019. Accessed January 30, 2019.
  14. Weise K. Amazon Knows What You Buy. And It’s Building a Big Ad Business From It. The New York Times. January 20, 2019.
  15. Goldberg A, Gidding S. Knowing the Prevalence of Familial Hypercholesterolemia Matters. Circulation. 2016;133(11):1054-1057.
  16. JASON. Artificial Intelligence for Health and Health Care. The MITRE Corporation; December 2017.


Decomposing the Value of Health Insurance

Oluwatobi A. Ogbechie-Godec, MD, MBA, Clay P. Wiske, MD, MBA, New York University; Kevin A. Schulman, MD, MBA, Clinical Excellence Research Center and the Department of Medicine, Stanford University

Contact: Kevin Schulman, kevin.schulman@stanford.edu

Abstract

What is the message? The lowest-spending decile in the 2016 Medical Expenditure Panel Survey (MEPS) in the U.S. provided 70.4% of the premium revenue to support healthcare services, while receiving only $0.11 in resources for every $1 invested in health insurance. Failure to provide services that are relevant for those payers will damage the willingness to purchase insurance, damaging the financial viability of the health system.

What is the evidence: Analysis based on the U.S. 2016 Medical Expenditure Panel Survey (MEPS)

Submitted: January 15, 2019; accepted after review: April 15, 2019.

Cite as: Oluwatobi A. Ogbechie-Godec, Clay P. Wiske, Kevin A. Schulman. 2019. Decomposing the Value of Health Insurance. Health Management Policy and Innovation, Volume 4, Issue 1.

Introduction

Health insurance plays a critical role in financing health care services in the United States, serving as the major revenue source for hospitals, physicians, and pharmaceutical firms. Given the importance of this financial model, it is remarkable how little effort has gone into understanding the disparate perspectives of value of insurance to people purchasing this product.

It is generally thought that people with low expected healthcare utilization buy health insurance to meet their immediate needs and to protect against the risk of catastrophic illness. For example, Healthcare.Gov suggests, “No one plans to get sick or hurt, but most people need medical care at some point. Health insurance covers these costs and offers many other important benefits.”1 These types of approaches are supported by public health assessments of the value of insurance to a population.2 Yet, it remains an open question whether these benefits are worth the cost to low-risk individuals in the current healthcare marketplace.

Methods

The 2016 Medical Expenditure Panel Survey (MEPS)3 is a nationally-representative and publicly-available de-identified sample of a civilian non-institutionalized population. MEPS has two components: a household component, which derives from surveys of individuals; and an insurance component, which derives from surveys of private and public sector employers. While a previous MEPS from 1996 included an institutional component, more recent surveys, including the one used here, have not included data on institutional patients. Weighting is done based on demographics to ensure that the MEPS survey accurately represents the general population. Using the 2016 MEPS, we created a model with 10 deciles of mutually-exclusive population segments by weighted health care spend that each had approximately equal total healthcare expenditures of $162 billion. Expenditures, which may be made by patients, private insurers, or other public payers, included payments to hospitals, healthcare professionals, and pharmacies. The 2016 survey received 34,655 responses, which were weighted by MEPS to allow for an extrapolation of the data to the entire United States population.

For each decile, we calculated the average annual per-capita spend [using total expenditures and population size] and calculated premium revenue from each decile. We estimated individual health insurance premiums for the entire population by summing total expenditures across each decile, assuming a medical loss ratio of 85% and premium contribution solely from the insured population. We also examined the demographic characteristics of populations in each decile.

Results

The calculated average annual premium was $6,387 per insured-individual (Figure 1). Consistent with previous estimates, the utilization of resources was highly skewed, with the highest-spending decile, 0.27% of the population, requiring an average per capita expenditure of $183,610. The lowest-spending decile, 70.40% of the population, had an average per capita expenditure of only $711.

Figure 1

2016 Average Annual Expenditure and Premium Revenue by Decile*

*Calculated using the 2016 MEPS survey, a nationally-representative and publicly-available sample of a civilian non-institutionalized population that enables population-level estimates of medical expenditures and insurance coverage. Bars represent the per capita expenditures (left Y axis) and lines represent the total premium revenue (right Y axis).


In terms of financing, the lowest-spending decile provided 70.4% of the resources for this population, and the two lowest-spending deciles provided 81.9% of the resources. Populations in the remaining eight highest-spending deciles had an average per capita expenditure that was more than the calculated premium.

Spending deciles varied by age, people with public insurance, and those without insurance. Elderly individuals and those with public insurance were disproportionally represented amongst the higher-spending deciles. By contrast, children and the uninsured were overrepresented amongst the lowest-spending deciles (Figure 2).

Figure 2

2016 Age and Insurance Status per Decile

Implications

Both the financing and utilization of health care resources are highly skewed, with a small proportion of the population experiencing catastrophic levels of expenditures. At the same time, the lowest-spending populations are the disproportionate financers of the health care system.

The demographics of each decile provides a broader view of the higher and low-spending populations. Prior studies to assess demographics and clinical characteristics of high-spending populations focus on the Medicare population.4,5 While it is true that the elderly have disproportionately higher medical expenditure, 62.8% of the 1st decile were individuals younger than 65 years. Furthermore, over 50% of the 2nd through 8th deciles were non-elderly, which should prompt exploration on their healthcare utilization, especially with higher-cost pharmaceuticals and elective medical procedures.

The results have implications for the sustainability of health insurance programs. Given the relatively low individual risk of catastrophic medical expenditures on an annual basis, low-risk individuals may perceive that health insurance is of limited value. Further, health system strategies that undermine the quality of the services used by low-spending patients — whether through barriers to accessing primary care physicians, shortening visit times, or diminishing the quality of provider interactions — may further exacerbate the challenges of finding value in health insurance for these populations. Indeed, consistent with our concern surrounding the perceptions of the value of health insurance for this population, the lower-spending populations had higher levels of uninsured.

Economists have described the skewed distribution of health expenditures in the United States, where a small segment of the population accounts for the majority of the expenditures.6 From a policy perspective, these results have been used to focus attention on changing the ways that health care services address the highest-spending segments through approaches such as disease management. By contrast, we have long neglected looking at the world from the perspective of the people in the lowest-cost decile.

Yet, the lowest-cost decile has important characteristics that we need to understand in designing health systems. People in this population have average annual medical costs of $711 per person and only receive $0.11 in resources for every $1 invested in health insurance annually. Further, included in their insurance premium is $617 for the costs of services of the uninsured, or almost as much as they will personally receive in health care services.

Consider the example of high and knee surgery. By 2016, there were over 1 million total hip and knee replacements in the U.S., at a cost of over $30,000 per procedure. Given this population size and cost, total joint replacement patients could represent just under 25% of the population in decile 4, which could translate into $147 in premium payments for the lowest-spending individuals.

In the Healthcare.Gov formulation, the balance of premiums above projected expenditures may be seen as representing insurance against catastrophic health care expenses. However, under 0.3% of the population falls into the highest cost decile. This suggests that low-cost individuals have a 1 in 370 chance of experiencing these catastrophic expenditures in any given year. If we include the people who fall into the next highest spending decile, that’s still only 0.84% of the population. In other words, low-cost individuals have less than 1 in 100 chance of having catastrophic expenditures in a given year.

An obvious question for this population is how much should they spend to insure against the remote risk of catastrophic medical events? If we look outside of healthcare, we see many people living in 100-year and 500-year flood zones that lack flood insurance. It is clear that, when given a choice, people are divided on the question of whether to insure against such remote risks. This reluctance may occur because they do not believe that remote events such as floods will be relevant for them or, altneratively, because they expect that public funds will cover the costs when catastrophic weather events do occur. In either case, many do not self-insure.

Seen from this perspective, the quality and availability of services for people in the top deciles of spending may not make health insurance more valuable for low-risk individuals. In fact, it may be just the opposite.

Trends in the past few decads are reinforcing this divide. Approximately 50% of the increase in the cost of health care since 1996 has been due to increases in prices and intensity of services.7 Common business practices such as provider consolidation add to market power for providers and are associated with significant increases in health care prices, with increases in prices of 20% or more after a merger.8 All of these practices add to the cost of care for patients in the top decile of spending, while adding directly to the cost of health insurance premiums that are borne particularly by the lower-cost deciles. Since 1999, health insurance premiums for employer-based insurance have increased 270% for individuals and 224% for employers.9

One implication of this analysis is the question of who is the customer for today’s health care systems. Health care systems seem designed to provide access to profitable tertiary care services, rather than primary and acute care services used by the low-cost population. One major health care system has stated publically that it needs to control the health care services for six million people in order to have a stable financial future. Yet, why would 5,949,600 consumers, the proportion of the population not in the two highest cost deciles, be interested in financing such a system?

The point of view here is important. From a profit perspective, the current approach makes significant sense. From a financing perspective, however, the critical concern is whether low-cost individuals continue to see value in the purchase of health insurance. Without their willingness to purchase health insurance, there would be an inability to finance the costs of the 20% of the population where costs exceed premium contributions.

On a basic level, this funding population is often under-appreciated. How many hospital CEO’s, for instance, have publically thanked their community for buying health insurance during the most recent open-enrollment season?

Limitations and next steps

Our analysis has limitations centered around the use of the MEPS database. This database excludes indirect health care (indirect patient care and research) and special populations (military, institutionalized, and long-term care populations) expenses. There is also concern that the survey may not capture large numbers of the higher-spending populations, so that much of the reliability of the data depends on the MEPS survey weighting methods. Finally, we excluded the uninsured population to calculate average premiums, although some insured patients may contribute financially through out-of-pocket spending or taxes.

Despite the limitations, this analysis helps to explain political debates about some of the resistance to health insurance. Health care leaders, physicians, and policy makers should acknowledge this increasing divergence of value from the perspective of the individuals financing the system. Even more importantly, they should work to ensure that the system provides value to this critical segment of the population. This responsibility may conflict with current evaluation of health care systems leaders where few performance metrics relate to the value provided to the low-cost insured patients that are critical to the financial viability of the health care system.

 References

  1. Healthcare.Gov. Health insurance: How it protects you from health and financial risks. 2018; https://www.healthcare.gov/why-coverage-is-important/coverage-protects-you/. Accessed December 19, 2017.
  2. Sommers BD, Gawande AA, Baicker K. Health Insurance Coverage and Health. The New England journal of medicine. Nov 16 2017;377(20):2000-2001.
  3. Cohen JW, Cohen SB, Banthin JS. The medical expenditure panel survey: a national information resource to support healthcare cost research and inform policy and practice. Medical care. Jul 2009;47(7 Suppl 1):S44-50.
  4. Clough JD, Riley GF, Cohen M, et al. Patterns of care for clinically distinct segments of high cost Medicare beneficiaries. Healthcare. Sep 2016;4(3):160-165.
  5. Joynt KE, Figueroa JF, Beaulieu N, Wild RC, Orav EJ, Jha AK. Segmenting high-cost Medicare patients into potentially actionable cohorts. Healthcare. Mar 2017;5(1-2):62-67.
  6. Cohen SB. The Concentration and Persistence in the Level of Health Expenditures over Time: Estimates for the U.S. Population, 2012-2013. Statistical Brief (Medical Expenditure Panel Survey (US)). Rockville (MD)2001.
  7. Dieleman JL, Squires E, Bui AL, et al. Factors Associated With Increases in US Health Care Spending, 1996-2013. JAMA : the journal of the American Medical Association. Nov 7 2017;318(17):1668-1678.
  8. Robinson JC, Miller K. Total expenditures per patient in hospital-owned and physician-owned physician organizations in California. JAMA : the journal of the American Medical Association. Oct 22-29 2014;312(16):1663-1669.
  9. Claxton G, Rae M, Long M, Damico A. Employer Health Benefits: 2017 Annual Survey United States 2017.