Swati DiDonato, Vittavat Termglinchan, and Kevin Schulman, Clinical Excellence Research Center, Stanford University School of Medicine
Contact: swatiy1@stanford.edu
Abstract
What is the message? Remote monitoring of older adults has the potential to transform the care of aging populations globally. Development of this technology comes at a critical time, when demographic trends are increasing need amid the reality of increased labor costs, decreased labor productivity, and worker shortages. While there is significant promise in this technology, there are significant challenges to the development and deployment of this technology at scale.
What is the evidence? The authors explore the technical, analytic, data interface and business architecture questions that must be addressed before the promise of remote monitoring technology can be fully realized.
Timeline: Submitted: May 4, 2023; accepted after review: May 10, 2023.
Cite as: Swati DiDonato, Vittavat Termglinchan, Kevin Schulman. 2023. Emerging Technologies for Remote Monitoring of Elderly Patients. Health Management, Policy and Innovation (www.HMPI.org), Volume 8, Issue 1.
Financial Support: The Stanford Clinical Excellence Research Center, the Stanford Partnership in AI-Assisted Care, and Kasikorn Bank PCL (KBank), Thailand, provided financial support for this work.
Acknowledgments: We thank Nora Richardson, librarian at the Stanford Graduate School of Business, for her assistance with searching for the companies included in this review.
Author Contributions: SD conducted data analysis, interpreted results, and drafted the paper. VT contributed to drafting the paper. KS supervised the data analysis and results interpretation and made substantial edits to the paper.
Competing Interests Statement: Kevin Schulman has a patent application currently pending. The application number is US20190172566A1, “Mobile patient-centric electronic health records” (https://patents.google.com/patent/US20190172566A1/en). He has assigned this patent to Duke University if issued. Inventors are Kevin Schulman, Daniel Chander, and Rajan Patel.
Introduction
By 2050, 1 in 6 people in the world will be over the age of 65.1 To live at home independently, older adults need to be able to perform activities of daily living (ADLs) and instrumental activities of daily living (IADLs).2 Earlier detection of ADL impairments could provide an opportunity to deliver timely clinical intervention, potentially improving the ability to perform ADLs by a factor of two.3
Currently, ADLs and IADLs are measured through self-reported questionnaires or grading by caregivers, but these measurements are subjective and may be biased by the respondent seeking services.4 Systematic assessment of the performance of older adults is becoming more accessible through digital technology. Wearable devices can track not only ADLs, but also several clinical parameters (i.e. heart rate, respiration rate, and sleep pattern).5 With recent advances in multi-modal sensing technology, combining sensors, computer vision, and machine learning, we are at the dawn of the deployment of ambient intelligence – the ability to continuously and unobtrusively monitor and understand actions in physical environments.6 Ambient intelligence could potentially measure performance on ADLs and IADLs, while also detecting significant clinical symptoms in older adults.6,7
A Conceptual Framework
The senior care market has become an attractive area for investment. To better understand how these solutions are evolving, we reviewed the websites and publicly available information for 100 companies identified via review of the CB Insights and PitchBook databases and using the keywords remote monitoring, seniors, and healthcare (Table 1).
Table 1: Characteristics of selected companies focused on at home monitoring for senior patients identified via CB Insights and PitchBook databases
| Hardware Type | Target End User(s) | Data Display | |
| LifePod Solutions | Smart speaker | Caregiver | Online portal |
| Shenzhen Darma Technology | Contact-free bed and chair sensor | Patient, Caregiver, Family, Clinician, Researcher | SaaS cloud platform |
| Tendertec Limited | Wall sensor | Caregiver | Mobile application |
| VitalTech | Bluetooth vital signs monitors | Patient, Caregiver, Family, Clinician, Home Health/Care Agencies | Platform accessible from smart devices, Electronic health record |
| Somatix | Smartband | Patient, Caregiver, Family, Senior Living Community Staff | Cloud based dashboard, Phone application |
| Raziel Health | FDA-approved vital signs monitoring devices, Smart phone camera, video monitors | Clinician | Smart phone application, Web portal, Cloud-based platform dashboard, Electronic health record |
| Anelto | Console with speaker/microphone and option of video; Accessories including vital signs monitors, spirometer, scale, wristband wearable, fall detect pendant, and glucometer; Help button | Caregiver, Clinician, Senior Living Facilities, Home Health Agencies | Smartphone application, Dashboard |
| Nonnatech | FDA-approved vital signs monitoring devices, radar and voice monitoring in development | Physician/Clinical Practice, Home Health/Long Term Care, Senior Living Community, Payer/ACO, Hospital/Health System | HIPAA-compliant platform, Electronic health record |
Based on these data, were were able to generalize business strategies and challenges into four domains for this review. The first domain is technical – the type of technology being employed to capture and record data. The second is analytic – how are the data being used and evaluated. The third is interface – how are the data being shared. The final category is business architecture – the model for using the data and insights to provide services to patients. We discuss strategies to aggregate the data, turn data into insights, and ultimately push insights to a target end user who can take action.
Domain 1: Technical
The first step in any remote monitoring program is collecting data. A wide array of technologies can assist in collecting and recording data. Two major strategies have evolved – using devices commonly found in homes or creating specialized devices for specific use cases.
At one end of the spectrum, we see hardware already familiar to many seniors, such as cell phones, wearable devices, and smart speakers. An advantage here is that seniors and caregivers are often already comfortable with them, even if they have not used them in this way before. This can decrease the barrier for them to initiate remote monitoring and help them feel more comfortable in the process. Other companies aim to place new types of devices in the home that are specialized for the data they are trying to collect. This has the potential to gather much more detailed and nuanced information to understand seniors’ life at home and well-being in ways we have been unable to measure previously. However, when specialized hardware is used, each new solution can be costly and can be a challenge for seniors to accept.
Domain 2: Analytic
A tremendous amount of data can be collected by these sensor technologies. A computer vision sensor for an ambient intelligent application generates 85 GB of data a day. This is impossible for one individual to sift through manually. Turning these data into insights that can be used effectively is the next major challenge. Efforts can range from simply alerting users to specific actions (say that a subject has fallen), changes in trends over time (subjects are more sedentary or somnolent), providing numeric measures on how a patient is performing in a specific domain, or generating composite measures of overall functioning or risk. Advanced analytics including machine learning can help generate signals from these immense data sets to provide actionable insights for users. However, this development is also novel and may lead to proprietary scores, with the underlying model not available for public scrutiny.
Domain 3: Interface
Analyzed data must reach users in an understandable, actionable format. The two most frequently used interfaces are mobile applications and online portals. Both are familiar for many users. Mobile applications have the advantage of accessibility independent of user location, while web portals have the advantage of more easily fitting into existing computer-based workflows. Additionally, portals can facilitate more robust functionalities for data display and user engagement.
Companies have also added value by personalizing data is seen, used, and shared. This can allow the healthcare professional to shape the interface in a way that is most useful for their workflow. Additionally, connecting with an electronic health record can help facilitate use of the data alongside the patient’s existing clinical data to create a more global picture of the patient’s clinical status inside and outside the healthcare setting. The 21st Century Cures Act creates rules and incentives for these data integrations.
Domain 4: Business Architecture
Companies are using a variety of business architectures to use the data and insights to provide services to patients, but who will be responsible for interpreting the information gathered and taking action?
Caregiver-based models
Some companies focus on providing information to the family member or caregiver, improving the ability of these individuals to understand and support a senior’s independence. An advantage of keeping the family member or caregiver at the center of the model is that these individuals are often already intimately involved in the day-to-day care of the senior and may have the time and motivation to readily act on the data. This may, however, exacerbate an already prevalent concern of caregiver burnout. Additionally, while having the family member or caregiver as the initial recipient of the data, this model can also lead to delays in diagnosis and treatment should a clinical response be required.
Healthcare professional-based models
Keeping healthcare professionals directly involved can help ensure major clinical changes receive appropriate responses. Some companies have created platforms that make it easier for healthcare professionals to quickly review and gain insights from their patients’ data. Medicare reimbursement opportunities have made this type of remote monitoring more appealing. Nevertheless, it can still be a challenge for healthcare professionals to add an additional step into their already complex, busy workflow.
Companies providing a service
In response to this challenge, some companies play a role in responding to the data and delivering care. This can help remove the burden from the patient’s primary care team but does require significant investment in creating the appropriate infrastructures to safely and reliably deliver care.
Key Considerations for Ongoing Development
Advances in ambient intelligence have the potential to shift our paradigm to patient-centered care rather than traditional physician-centered care. As we develop new models that incorporate remote monitoring technologies, several key areas will likely be crucial for success.
Clinical Validation
The types of data being collected are novel, and the models being developed are largely untested in terms of basic reporting such as alerts, or in terms of more significant applications such as the prediction of future events. Unfortunately, the private investment model may not face these issues with the humility required before we can consider deployment of solutions at scale. This reality is complicated by the fact that developing the underlying analytic technology will require large data sets to robustly analyze low-frequency events such as falls. The development of proprietary models will also make it difficult to determine if there are “class effects” in using one type of sensing modality for one specific purpose, or if we need to individually test each solution for each application. Finally, there is a question of generalizability of the technology across various segments of the population related to language, literacy, and education.
Demonstrating clear impact on clinical outcomes will be essential to establish that these technologies are serving a true clinical need if the financial model is based on insurance reimbursement. Alternatively, these technologies could be developed with a consumer-supported financial model (most assistive care services are not supported by insurance), where validation of benefit to the consumer would be used to drive demand.
HIPAA, GDPR, and Data Privacy
When discussing data sharing, it is critical to understand how seniors’ data will be protected. A robust privacy strategy is critical for any company in the healthcare space. In the United States, the Health Insurance Portability and Accountability Act (HIPAA) provides standards for protecting patient privacy when covered entities, the medical provider, health insurer, or clearinghouse, are involved in data collection. But HIPAA does not extend protections outside of these settings. For example, HIPAA would apply to a device managed by the healthcare professional in a patient’s home as part of a disease management program but would not apply to a self-pay consumer-based business model based on the same technology. For consumer models, data privacy is governed by the Federal Trade Commission and state privacy laws such as the California Consumer Privacy Act. In the European Union, the General Data Protection Regulation (GDPR) provides new accountability for data privacy. It is critical for companies to understand and comply with these different regulations when handling sensitive patient information.
FDA Clearance and Approval
When utilizing remote monitoring for clinical purposes, ensuring systems have been tested and validated is critical for patient safety. FDA clearance and approval is one avenue companies can take to conduct due diligence on their devices. While consumer devices do not require FDA clearance or approval, most medical devices that are collecting medical data do require this type of regulatory oversight. Software itself can also be considered a medical device requiring regulatory oversight, even if the hardware is considered a consumer-only device.
The FDA has used enforcement discretion in the past to highlight both its statutory authority and its desire to spur innovation in this space. Formal regulatory approval can also be a long and costly process. Finding a balance between innovation and oversight will be a continued challenge for companies in this space as they aim to provide maximal value to patients, minimize time to market, and ensure they are providing a clinically beneficial service while protecting this vulnerable population.
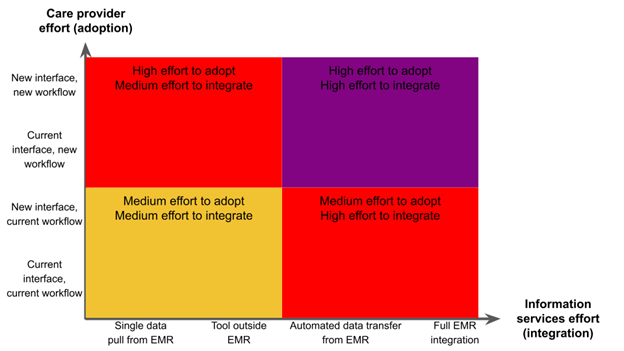
Fragmentation in Care
For providers, it is daunting to envision the challenges of integrating the different technologies and different workflows emerging as as this field evolves. These challenges could occur at a health system level, where orthopedics and primary care adopt different technology strategies requiring EMR integration, or at a practice level, where different patients purchase different technologies and services that are all intended to “integrate” into clinical practice but where each has their own proprietary reports, alerts, and data formats. If these new workstreams do not integrate with existing workstreams and systems, they can generate new data silos.8 This can exacerbate fragmentation of data, already a major barrier to information exchange in healthcare (See Figure 1).
Figure 1: Data flow in remote monitoring for seniors
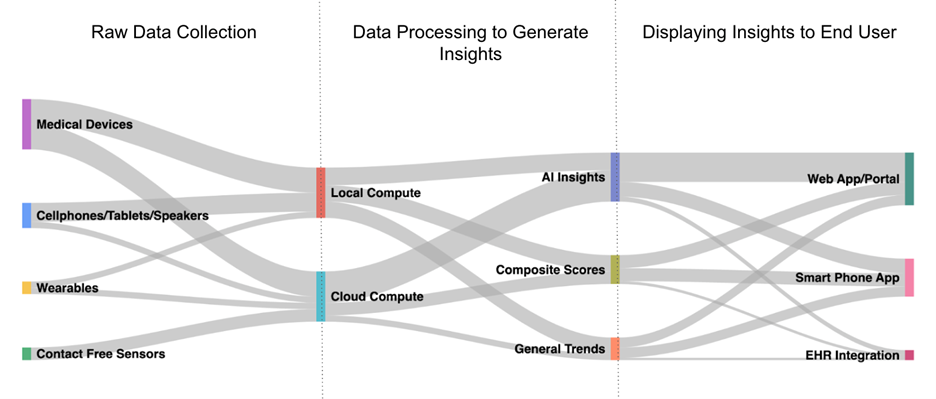
The smart home industry is starting to solve the technology integration problem, with devices like Amazon Alexa and Google Home serving as hubs that work with different devices. But, as we have discussed, technology integration is just one domain in our four-domain framework.
From the provider perspective, the open question is the ability to integrate these data with electronic health records in a meaningful way so outputs can be combined seamlessly with existing clinical data. This requires the development of standard application programming interfaces (API’s) for two-way data exchange specific to ambient intelligence data and services.
Conclusion
Remote monitoring of older adults has the potential to transform the care of aging populations globally. While there is significant promise in this technology, technical, analytic, data interface and business architecture questions must be addressed before we can realize the clinical benefits of this technology at scale.
References
- United Nations. World Population Ageing 2020. https://www.un.org/development/desa/pd/sites/www.un.org.development.desa.pd/files/undesa_pd-2020_world_population_ageing_highlights.pdf (2020).
- Katz, S. Assessing self-maintenance: activities of daily living, mobility, and instrumental activities of daily living. J Am Geriatr Soc 31, 721–727 (1983).
- Phelan, E. A., Williams, B., Penninx, B. W. J. H., LoGerfo, J. P. & Leveille, S. G. Activities of daily living function and disability in older adults in a randomized trial of the health enhancement program. J Gerontol A Biol Sci Med Sci 59, 838–843 (2004).
- Carlsson, G., Haak, M., Nygren, C. & Iwarsson, S. Self-reported versus professionally assessed functional limitations in community-dwelling very old individuals. Int J Rehabil Res 35, 299–304 (2012).
- Wang, Z., Yang, Z. & Dong, T. A Review of Wearable Technologies for Elderly Care that Can Accurately Track Indoor Position, Recognize Physical Activities and Monitor Vital Signs in Real Time. Sensors (Basel) 17, E341 (2017).
- Haque, A., Milstein, A. & Fei-Fei, L. Illuminating the dark spaces of healthcare with ambient intelligence. Nature 585, 193–202 (2020).
- Uddin, M. Z., Khaksar, W. & Torresen, J. Ambient Sensors for Elderly Care and Independent Living: A Survey. Sensors (Basel) 18, E2027 (2018).
- Lee, P. et al. Digital Health COVID-19 Impact Assessment: Lessons Learned and Compelling Needs. NAM Perspectives.Discussion Paper, National Academy of Medicine, Washington, DC (2022).
- Lifepod, Giving Voice to Caregivers. https://lifepod.com/ (2022).
- http://darma.co/ (2022).
- Tendertec, Carebox. https://tendertec.org/carebox/ (2022).
- Somatix, Data with a purpose. https://somatix.com/ (2022).
- http://caretechsys.com/ (2022).
- https://nonnatech.com/solutions-the-nonnatech-difference/real-time-analytics/ (2022).
- https://www.razielhealth.com/solutions (2022).
- Vitaltech, Vitalcare, Decentralized Care Services Across The Care Continuum. https://vitaltech.com/vitalcare/ (2022).
- Anelto, Helping seniors thrive. https://www.anelto.com/remote-patient-monitoring/ (2022).