Will Mitchell, Rotman School of Management, University of Toronto
Abstract
Contact: Will Mitchell william.mitchell@Rotman.Utoronto.Ca
Cite as: Will Mitchell. 2019. Getting to Bi-Partisan Healthcare Solutions by Agreeing on Goals and Principles. Health Management Policy and Innovation, Volume 4, Issue 3.
The Debate About Healthcare Reform in the U.S. Is Dysfunctional
The current debate about health reform in the U.S. highlights conflicting structural initiatives—Medicare for all, Medicare for all who want it, adding to the Affordable Care Act, cutting back on the Affordable Care Act, ad infinitum. The likelihood that our current debate will reach broad agreement and, in turn, encourage stakeholders to collaborate across the country to implement any initiative, is close to zero. How do we get out of this impasse?
Here is an approach that can work. Before debating structural solutions, let’s agree on goals. While we will not reach 100 percent agreement about healthcare objectives and major building blocks, we can come far closer than the current acute disagreement about structures. Then, building on shared understanding of goals, we can build policy initiatives that have bipartisan support and actually have a chance of working.
Three Shared Goals
The healthcare tripod: Access, efficiency, quality
Let’s start with a healthcare tripod of three goals that are likely to have broad-based support: access, efficiency, and quality.
Access: First, regardless of political affiliation, most people in the country want people to have access to health and healthcare services when they need them. This does not mean that everyone receives all services, all the time, every time that they want them. Instead, it means that services are as available as broadly as possible when people are ill and, even better, when they have opportunities to stay healthy. As part of this objective, there is general agreement that we want access to appropriate services to be timely, without long waiting periods. While there inevitably will be rationing of services—whether by price, queue, or some other rationing mechanism—most people in the country share the goal of providing broad-based access.
Efficiency: Second, we want the healthcare system to use money and other resources efficiently. We want reasonable outcomes for the investments and payments that we make to purchase healthcare goods and services, as well as the administrative support that manages healthcare activities. And most of us agree that the people and organizations involved in creating and providing healthcare good services—whether commercial, public, or nonprofit organizations—need enough financial return to be able to continue to operate. Although we may debate how much financial return is necessary, most will agree that net income is appropriate. As a slightly longer version of this goal, then, let’s call this the goal of profitable cost-effectiveness.
Quality: Third, we want products and services with a strong mix of quality, safety, and innovation, which we can short-hand as high healthcare quality. We want devices, medicines, clinicians, support staff, and other elements of healthcare that deliver what they are designed to do. We want use of the goods and services to be safe, without side effects and damage to our health. And we want an ongoing stream of innovations that provide new solutions to long-standing health and healthcare issues. Again, this is the goal of healthcare quality.
Not all people will agree that we should seek these three goals. But most people from across the political spectrum view these as desirable aspirations for the U.S. healthcare system. The three goals provide a base for designing a bipartisan solution.
Can we excel on all three goals?
Before we consider healthcare choices, let’s ask whether it is reasonable to seek to excel on all three goals. Or, instead, do we need to settle for doing well on one or two of the legs of the healthcare tripod, while giving up on another? For instance, do higher quality or better access inevitably mean lower cost-effectiveness?
One way to consider this question is to look at international data about health systems. The Commonwealth Fund regularly compares healthcare in multiple developed economies. [1] The details of the comparisons can be compiled in terms of the access, efficiency, and quality goals. [2]
The Commonwealth Fund data offer two insights: about U.S. performance and about potential compatibility of the three goals. First, since the beginnings of the rankings, in 2004, the U.S. health system has fared poorly. For the overall score in each year of the comparison, the U.S. has finished last. Moreover, the country has finished near the bottom on most of the individual access-efficiency-quality dimensions.
In 2017, with the most recent rankings of 11 countries, the U.S. finished last in overall scoring and access, tenth in administrative efficiency (ahead of only France), fifth in quality of care processes, and last in health outcomes. To achieve these dismal results, the U.S. spent the highest percentage of GDP on healthcare (17.2%), by far outstripping the number two country, Switzerland (12.3% of GDP). [3] Quite simply, the U.S. does badly in healthcare comparisons with international peers.
Second, we can look for correlations among the three goals across the eleven countries. Positive correlations would indicate that goals are compatible with each other. Negative correlations would suggest that trade-offs are common.
In practice, we find weak to strong compatibility among the three goals. When we correlate the compiled measures for access, administrative efficiency, and process quality across the 11 countries in 2017, none of the correlations are negative and all three are at least weakly positive: access-quality (0.01), efficiency-quality (0.18), and access-efficiency (0.56). One needs to be careful in interpreting the correlations—they are based on a small number of countries and report only associations, not causal relationships. Nonetheless, in the minimum, the relationships do not identify dominant trade-offs in which one goal tends to go down when another goes up. This pattern suggests that we can seek to improve on all three healthcare goals.
Do Sources of Healthcare Payment Correlate with the Goals?
Now let’s consider how health policy choices about sources of payment might relate to the three goals.
The core question of the debate about the U.S. healthcare system is what form of payment we should stress in the country. Strong-form proposals in the “Medicare for All” range seek a dominant role for public payment. Proposals in the realm of “Medicare for All Who Want It” offer a mix of increased public payment, with a major continuing role for private third-party payment such as through insurance offered through employment. Those who seek to cut back on the Affordable Care Act want to reduce public payment, with greater stress on private third-party insurance and out-of-pocket expense.
Share of payment by source: Public payer, private payer, out-of-pocket
Commonwealth Fund data offer an international snapshot of payment sources. Consider three sources: public, private third-party, and out-of-pocket payments. The U.S. is lowest in public share, highest in private third-party, and near the bottom in out-of-pocket payment.
Public payment: In the U.S., the public payment share through Medicare, Medicaid, the Veteran’s Administration, and other programs is substantial, at 49 percent in 2017. Nonetheless, the U.S. public share is substantially lower than in the ten international peers. [4] Switzerland is the second lowest, with 63 percent, while Germany and Norway have the highest share of public payment, at 85 percent.
Private third-party: Conversely, the U.S. ranks by far the highest in share of private third-party payment, at 40 percent in 2017. Canada is second, at 15 percent, while the private third-party share in Norway is less than 1 percent.
Out-of-pocket: Finally, out-of-pocket payment for deductibles, copays, and uninsured costs is near the bottom in the U.S., at 11 percent in 2017. France was the lowest, at 10 percent, while Switzerland was the highest, at 29 percent.
Hence, across countries, the three payment sources vary. In turn, it is worth investigating possible relationships with the three healthcare goals.
Let’s consider whether shares of the three types of payment sources across countries correlate with the healthcare goals. Again, we need to be cautious in interpreting these relationships. Nonetheless, with appropriate care, the correlations provide useful insights.
Figure 1 reports correlations of public and private payment shares with multiple aspects of the efficiency, access, and quality goals for the ten countries other than the U.S. The analysis focuses outside the U.S. in order to seek insights from alternative approaches to healthcare policy.
Figure 1. Correlations of Goals with Public and Private Payment Sources: 10 Countries
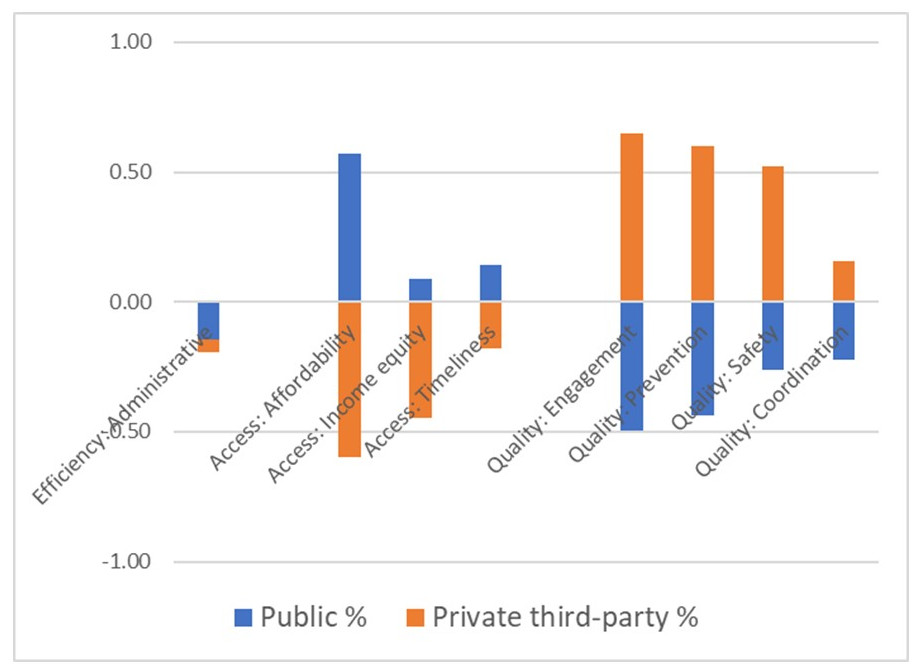
Source: Commonwealth Fund, 2017
Countries: Australia, Canada, France, Germany, Netherlands, New Zealand, Norway, Sweden, Switzerland, U.K.
Note: The figure does not report correlations with out-of-pocket payment, which have low relationships with the goals.
Efficiency: For administrative efficiency, there are only limited relationships with either public or private third-party share. Both correlations with efficiency are weakly negative. As a side note, the omitted case of out-of-pocket payment is weakly positive, which is consistent with research showing that copays improve system efficiency. [5]
Access: Now consider three aspects of healthcare access: affordability, income equity (how evenly different income levels have access to healthcare), and timeliness. Public share of payment has at least a weak positive correlation with all three measures of access. By contrast, private third-party share has negative relationships with all three elements of access.
Quality: Finally, consider four aspects of quality: engagement, prevention, safety, and coordination of care. Private third-party payment has at least weak positive relationship with quality, while public share has negative relationships with the quality measures.
The comparisons highlight a possible substitution between public and private payment. Strikingly, there may be a trade-off in which high share of public payment associates with improved access but may under-perform on key aspects of process quality.
We can speculate about two mechanisms that might underlie such a trade-off between access and quality. First, public payment, by design, provides access to people who lack other sources of payment. Second, third-party payers may provide higher average payments to providers or engage in more targeted relationships with providers and so provide resources and knowledge needed to invest in the processes that underlie higher quality healthcare services. While other mechanisms also may be relevant, these provide a useful baseline.
Other factors also may be relevant, such as a political pressure mechanism. It is possible that public systems tend to focus first on voters and their demands for broad-based access to healthcare services. By contrast, private third-party papers may be more responsive to people with severe illness because benefit managers do not want to risk someone with a catastrophic disease putting pressure on their employer to change insurers. [6]
Nonetheless, no matter what the mechanisms, is a trade-off of access and quality inevitable? If so, we are likely to remain at loggerheads in our health reform debates. Instead, if there is a way to gain the benefits of both the public and private forces, then we have opportunities to converge on two-part proposals that will advance the three goals.
Converging on Potential Solutions
What solutions might gain wins toward all three goals? For this question, the international comparisons provide only partial insights. The three countries in the Commonwealth Fund analysis with the highest combinations of access, efficiency, and quality are Australia, the Netherlands, and the U.K. Across those three countries, there are two very different patterns of payment shares. Australia has below-average public payment and above-average private third-party. The U.K. and the Netherlands have slightly above-average public payment and average or below-average third-party payment. Clearly, there are multiple paths to higher performance on the three goals.
What path might make sense for the U.S.?
One logical pathway in the U.S. is an extension of the current two-part system in a way that takes advantage of the strengths of both public payment and private third-party payment. Public payment appears to facilitate access, while private payment may offer resources and pressures for quality. Let’s consider reforms that combine these two benefits.
As a starting point, imagine a reform of the U.S. health system that built on the current combination of public and private payment. An expansion of broad-based public payment would provide access to people who lack desirable private payment. This is clearly a benefit. At the same time, though, the risk is that the public payment system would be so broad-based that it missed opportunities to fine-tune healthcare services for particular contexts.
Now add continued availability of private coverage for people who want and have access to that option. This has the potential to provide targeted features and so avoid the risk of over-standardizing care. Hence, a potential two-part solution is intriguing.
Risks of a two-part solution
But the two-part solution faces two risks, concerning short time horizons and divergent standards of care.
Time horizons: First, private third-party care often has short-term horizons, because people are likely to leave an insurance pool when they move or change jobs. Hence, private payers may under-invest in the life cycle of longer-term care. By contrast, in theory at least, public payment has greater incentive to consider the life cycle of care because the public payer will be on the hook for illnesses and issues that arise later in a person’s life.
Standards of care: Second, there is a risk that we would exacerbate some of the challenges of the current two-track health system in the U.S. Currently, those with stable employment often receive one standard of care, while those who rely on public coverage often receive a different standard of care. This may be acceptable to some people but is repugnant to many. A stronger solution would lead to similar high standards of care whether one receives public or private payments.
How can we address the two risks in a two-part payment system?
Consider two viable approaches to addressing these risks.
Time horizon challenge: The solution to the life-cycle horizon challenge that is common in private payment is to make it easy enough for people to switch between providers and payers if an alternative provider will provide superior life-cycle care for their needs. This might be a switch to a more suitable private payer. Or it might be a switch to a public payer that has greater incentive to consider longer-term horizons.
Standards of care challenge: A reassuring point is that the presence of different payment sources does not mean that patients receive different care from a provider. Indeed, research suggests similar approaches to treatment when providers care for both public and private third-party patients. [7] Hence, part of the challenge is to make sure that people have access to similar providers whether they are covered by public or private payers.
The knee-jerk approach here is to require the public system increase payments for coverage that providers are more willing to enroll patients from the public system. But, as we have seen, the U.S. already has high costs of healthcare. Simply adding to costs has real limits.
A stronger long-term solution is to allow providers that include patients from both public and private payer pools to take advantage of the scale of the public system and piggy-back contracts with vendors, such as pharmaceutical, lab test, supplies vendors, and other companies. This part of the solution creates strong incentives to combine public and private payer populations within providers, and so help provide consistent care.
So far, the two-part approach seems feasible. Yet the solutions we have discussed so far rest on two principles that need to be central to robust reform.
Two principles: Patients as decision-makers and information transparency
The solutions rest on the assumption that people can switch between providers. To make this possible, we need to adhere to two principles: patients as partners in healthcare decision-making, plus transparency of healthcare information.
Patients as partners
First, we have largely moved past the era of passive patients in which we expected physicians and other clinicians to tell us what healthcare services we need. Instead, there is increasing agreement that individuals want and need to be active partners in deciding what medical services they need and how to engage with the services. As active agents, people are more likely to identify appropriate services for themselves and their families. Perhaps even more importantly, active agents are more likely to follow up with relevant compliance and post-care activity—so that the healthcare services we consume have a chance of working well.
This first principle of patients as decision-makers is somewhat controversial, perhaps most commonly among clinicians. Some physicians resist viewing patients as decision-makers—even worse, as customers—fearing that they will shop for healthcare fads or over-consume healthcare services. Yet most health policy analysts expect better outcomes if patients are actively engaged in deciding what healthcare services to use and how to engage with their use.
Transparent information
Second, for people to make effective decisions, they need transparent information. We need information about the benefits and risks of different treatments in different contexts. We need comparative information about outcomes from different providers and institutions. We need information about prices that we will pay for services. Quite simply, if we have limited information about price and quality, we will not be able to be active decision-makers about healthcare services.
This second principle—of transparent information—is not controversial but is nowhere near present in current healthcare practice. Outcome information is obscure, at best. Pricing is often a surprise that shows up in bills after receiving medical services. The relative benefit of different healthcare treatments and health activities is often ambiguous. Even if we agree on the benefits of the principle of transparency, we are nowhere near achieving it. Indeed, achieving full transparency is unlikely, due to technical barriers in measurement. Yet, based on current technical status of healthcare services, we could achieve substantially greater clarity of healthcare prices, quality, and outcomes.
Looking Forward: Build Structural Solutions Around Shared Goals
Clearly, we need to develop potential solutions in more detail. In doing so, we need to encourage solutions that facilitate product innovations and organizational innovation that facilitate ongoing changes in the healthcare delivery system. The point here is that there are feasible structural solutions that are consistent with three widely shared goals, of access, efficiency, and quality. These are important parts of conversations in political debates, Congress, the administration, and state and local institutions.
The international comparisons provide starting points for thinking about a two-part solution to U.S. healthcare reform. In turn, the two principles—of increasing the role of patients as partners and providing greater transparency in information—provide the starting point for creating a robust two-part solution. The more that we can focus the debate on goals and principles, with the intent to approach a shared understanding of them, the more fruitful our ongoing discussion and implementation of structural reforms will be.
[1] In 2017, the 11 countries in the comparisons included Australia, Canada, France, Germany, the Netherlands, New Zealand, Norway, Sweden, Switzerland, the U.K., and the U.S.
See The Commonwealth Fund. Mirror, mirror 2017: International comparison reflects flaws and opportunities for better U.S. health care. 2017 July 14. https://interactives.commonwealthfund.org/2017/july/mirror-mirror/
[2] I use the following items from the Commonwealth Fund data to assess the three goals: access (equity, affordability, timeliness); cost-effectiveness (administration efficiency); quality (preventive care, patient engagement, coordination, safety).
[3] Tikkanen R. Multinational comparisons of health. The Commonwealth Fund 2018 December 3.
https://www.commonwealthfund.org/publications/other-publication/2018/dec/multinational-comparisons-health-systems-data-2018
[4] Tikkanen R, above.
[5] See Pauly M: https://pnhp.org/news/mark-pauly-cost-effectiveness-depends-on-cost-sharing/
[6] See Ogbechie-Godec OA, Wiske CP, Schulman KA. Decomposing the value of health insurance. Health Management Policy and Innovation 2019 May;4(1). https://hmpi.org/2019/04/21/decomposing-the-value-of-health-insurance/
[7] Mortensen K, Hu T, Vitale A, Kuttner H. Characteristics of providers serving Medicaid and private patients. Health Management Policy and Innovation 2018 October;3(2).
https://hmpi.org/2018/10/08/characteristics-of-providers-serving-medicaid-and-private-patients/