HMPI

Managing Medical Device Liability through Innovation: A Strategic Approach

Alberto Galasso, University of Toronto, National Bureau of Economic Research and Centre for Economic Policy Research, and Hong Luo, Harvard Business School

Contact: a.galasso@rotman.utoronto.ca

Abstract

What is the message? Managing product liability risk is imperative for medical device firms. Effective risk management requires not only the development of a strategy to address liability claims at the litigation stage, but also at the product ideation and development stage. Technology safety features differ in their impacts on consumer willingness to pay and protection to liability litigation, and the development of risk-mitigating technologies involves multiple trade-offs that managers need to identify and consider.

What is the evidence? The findings are based on a review of the literature in management, law and economics, and industry case studies. The managerial implications are obtained through the development of a theoretical framework linking product liability and innovation strategies.

Timeline: Submitted: December 7, 2022; accepted after review: April 26, 2023.

Cite as: Alberto Galasso, Hong Luo. 2023. Managing Medical Device Liability through Innovation: A Strategic Approach. Health Management, Policy and Innovation (www.HMPI.org), Volume 8, Issue 1.

Product liability risk in the medical device industry

Product liability laws protect customers from defective and dangerous products. Effective liability systems not only compensate victims, but also act as an incentive to provide safer products. At the same time, product liability risk can expose firms to expensive litigation which can have detrimental impact on profitability and long-term reputation effects. For small firms, product liability litigation can be an existential threat.

Product liability cases have been increasing in the last decade, reaching about 60,000 filings in 2019 across U.S. courts. Medical devices and pharmaceutical products account for the majority of these cases, as firms in these industries took all the top 20 positions on the list of most active defendants. At the top of the list, Johnson & Johnson featured as defendant in 70,924 product liability cases during the 2015-19 period (Lex Machina, 2020). Many medical device liability cases were extensively covered by the media because of the pain and suffering those defective products caused, and the large damages awarded. Examples include litigation related to Bayer’s birth control devices, St. Jude’s implantable cardioverter-defibrillators, Stryker’s hip implants, and Covidien’s surgical staplers. Public attention to medical device litigation has also increased following the 2018 Netflix documentary ‘The Bleeding Edge.’

The importance of the issue implies that managing liability risk is imperative for medical device firms. Effective risk management requires not only the development of a strategy to address liability claims ‘ex-post’ at the litigation stage, but also ‘ex-ante’ at the product ideation and development stage. In other words, product liability risk should be an important driver of technology strategies and R&D investment decisions.  In this article, we discuss several aspects of the relationships among product liability risk, safety, and innovation strategies of medical device companies.

Risk mitigating technologies

Risk mitigating technologies (RMTs) are innovations that reduce the probability of negative events or the severity of their consequences (Galasso and Luo, 2021). Drug containers with safety caps, for example, reduce the likelihood of children ingesting prescription drugs. Syringes with retractable needles prevent injuries and exposure to the contaminated needles. New types of hip implants producing less wear particles, or new silicone breast implants with lower risk of rupture are further examples of RMTs.  RMTs may take various forms, depending on the nature of the hazards, the preferences of the consumers, and the technological possibilities. They can be incremental innovations that refine existing technologies or radical innovations that potentially establish entirely new classes of products.

An important difference between RMTs and technologies affecting other dimensions of quality (such as the image resolution of CT scanners or the look and feel of breast implants) is that the value created by RMTs is strongly influenced by non-market forces. Consider, for example, the development of a new CT scanner including dose display, alert and notification systems which can reduce the risk of over-radiation. The profits that an innovator can make will depend on the existing regulations on CT safety (will the device become a mandated safety feature?), on the liability system (how large are the damages in case of malfunctioning and over-radiation?) as well as on the media attention on the subject and on the level of consumer activism. Moreover, the efficiency of the insurance markets that can protect against the risk will also shape the market potential of RMTs.

From a business perspective, it is important to notice that RMTs generate value through two distinct, but related, channels. The first is consumers’ willingness to pay. RMTs lead to safer devices which generate benefits to patients and care-providers. Typically, a device which is safer than competing products in the market allows its producer to charge a price premium and obtain higher profit margins. The second mechanism by which RMTs create value is by reducing firms’ product liability costs. As safer devices are less likely to be involved in product liability lawsuits, RMTs reduce firm costs by decreasing the likelihood of costly litigation.

Innovation scholars often highlight the distinction between product and process innovation. The former includes technologies which improve the quality of existing products, the latter relates to reduction in firm operating costs. The discussion above indicates that RMTs inherently possess features of both product innovation (they increase consumer willingness to pay when consumer value safety) and process innovation (they reduce the expenses from product liability litigation).

A taxonomy of RMTs

Recognizing the two channels through which RMTs can generate value is important as it suggests that RMTs may differ across these dimensions. To understand the type of RMTs developed by a firm, managers should ask themselves a series of questions. First, they should consider whether the new technology generates higher consumer willingness to pay, and whether this can be leveraged by the firm to extract greater product market profits. Let us call this dimension the product market effect of the technology.

After considering the market potential of the technology, managers should assess its impact on product liability litigation. RMTs may reduce the exposure of firms to liability risk by reducing the likelihood of being involved in litigation, or by reducing the litigation costs and damages that firms expect to face if litigation takes place. Let us call this aspect the defensive effect of RMTs.

Figure 1 – A taxonomy of RMTs


Figure 1 exploits these differences to provide a taxonomy of RMTs depending on their product market and defensive effects. We define as ineffective RMTs those technologies which are not expected to have any traction with consumers and are not expected to improve the legal position of the firm in product liability suits. To make a business case for these RMTs is difficult and, in most cases, they should not be developed.

Defensive RMTs are innovations that can substantially improve a firm’s legal position, but that do not meaningfully increase the ability of firms to extract greater market profits. Childproof prescription drug containers are an example of defensive RMTs. These technologies, developed to make it harder for children to access and swallow medicines, can provide protection for pharmaceutical companies in product liability cases. For example, in 2018 the U.S. Department of Justice prosecuted a claim against the pharmaceutical firm Dr. Reddy’s Laboratories related to the distribution of prescription drugs in blister packs that were not child resistant. At the same time, survey evidence shows that many adults find these containers too hard to open. This is especially the case for the elderly and people with disabilities (Thwaites, 1999). In the context of diagnostic and therapeutic technologies, defensive RMTs include readiness check software, which prevents operators from using a device until a series of quality assurance checks are satisfied. These RMTs can substantially reduce the risk of equipment malfunction, and thus the liability exposure of the manufacturer. At the same time, clinicians’ willingness to pay for these features may be limited, as the software may slow down clinical workflow and reduce the number of patients seen by a practice.

Differentiating RMTs are technologies valued by customers, as they affect their perception of product safety, but do not generate substantial protection in the case of a liability suit. They create value through product market effects rather than defensive effects. These are typically new technologies that depart substantially from the more established technologies in the field. New robotic surgical systems are an example of differentiating RMTs. The robotic surgery industry has grown substantially since the FDA approval of Intuitive Surgical’s da Vinci system in 2000, with revenues reaching an annualized growth rate of 7.2% during the period 2015-19 (Crompton, 2020).  Surgeons and hospital administrators report substantial safety benefits from robotic surgery. These include more precision during the operation, fewer post-operative complications, and shorter recovery time. At the same time, surgical robot companies have been the target of substantial product liability litigation.  For example, our search of the litigation database LexMachina shows 253 federal district court product liability cases related to Intuitive Surgical between 2009 and 2022. The rapid evolution of robotic systems makes these producers easier targets of design defect lawsuits relative to other medical device firms which operate in fields where decades-old safety standards are in place. For example, in some of these cases plaintiffs allege that components in the arms of robotic systems can cause severe burns to healthy tissues and organs (Fox, 2013). More generally, the complexity and the novelty of these technologies make problems difficult to predict, and it is challenging to determine whether undesirable outcomes are caused by the surgeon, the design of the robotic device, or both.

Core RMTs are technologies that provide legal protection and high customer value in tandem. In other words, they generate value through both product market and defensive effects. Development of core RMTs can be a key driver of competitive advantage and firm growth. Take, for example, Becton Dickinson (BD) a medical device company perceived as a leader in product safety. A well-known set of products offered by BD are their syringes with retractable needles, pivoting needles and shielding needles, which reduce substantially the risk of exposure to blood borne pathogens such as HIV and hepatitis C for healthcare workers. In turn, this reduces product liability risk for the syringe manufacturer. BD market success from these devices led the firm to focus its entire technology strategy around healthcare worker safety (Pisano, 2019).

A second example of core RMTs is the introduction of iterative reconstruction (IR) in CT scanners.  IR is an image construction technique which allowed for large levels of radiation dose reduction (up to 80-90 percent) in CT scanners relative to other imaging methods. The introduction of this RMT followed a series of investigations, prompted by media attention, on medical over-radiation accidents using imaging and radiation therapy devices. While these accidents were due mainly to misconfigurations by the hospitals, they led to greater demand for safer products and highlighted potential liability risk for CT scanner producers in the case of excessive radiation dosage. The industry reacted to these events launching new generations of CT scanners which featured IR and engaging in significant sales and marketing campaigns. For example, the front page of GE’s product brochure for Veo—one of their CT scanner using the IR algorithm—displayed the following message in large font: “The breakthrough that is rewriting the rule of CT imaging,” and adds that this technology helps physicians to achieve “the enhanced image quality at a radiation dose never before thought possible” (Galasso and Luo, 2021).

Many medical devices are purchased and used by hospitals, rather than directly by patients.  When this is the case, RMTs may reduce product liability litigation exposure both for device manufacturers and for clinical users. For example, an RMT reducing CT scanner over-radiation risk may substantially decrease the litigation exposure of the hospitals, which increases their willingness to pay for the device. The same RMT also reduces the litigation exposure for the manufacturer, which decreases its operating costs. This implies that, in some cases, litigation motives alone may suffice to generate a core RMT.

Implications for technology strategy

The RMT taxonomy discussed above highlights the key features that technology managers must consider when assessing the desirability of new medical innovation related to device safety features. The analysis has several implications for medical device companies.

  1. Safety technologies generate multiple trade-offs. Whether or not to commercialize a new technology is a key strategic decision that has a long-term impact and is difficult to reverse. It is thus crucial to price correctly the factors affecting technology development strategies. Our framework indicates that the development of RMTs involve multiple trade-offs that managers need to identify and consider. The first set of factors involves the possible impacts that enhanced device safety may have on other quality dimensions. For example, new models of CT scanners featuring lower levels of radiation may perform worse on other quality dimensions such as speed and image clarity. The overall willingness to pay of consumers – its product market effect – will depend on the combination of these different aspects. The second potential trade-off involves possible tensions between the product market and the defensive effects of the technology. In some cases, large reductions in litigation risk in a market may be associated with lower willingness to pay for the product. For example, Galasso and Luo (2017) provide evidence supporting the idea that tort reforms reduce physicians’ propensity to adopt technologies that reduce the probability of malpractice disputes. In others, higher willingness to pay for safety features may also be accompanied by greater risk of product liability litigation. Mispricing these factors can undermine the technology development analysis.
  2. The value of safety features evolves over time. The incentives to develop and commercialize RMTs can shift over time and may be shaped by changes in the business and social environment in which a device company operates. For example, media coverages of accidents and new technologies can play a crucial role in disseminating information on health hazards to the general public, thereby influencing the demand for safety. As documented by Galasso and Luo (2021), the development of several RMTs for CT scanners was spurred by a series of effective investigative reporting by The New York Times. Similarly, changes in consumer activism and education may lead to greater risk of liability litigation, which in turn affects the incentive to develop RMTs.
  3. Safety education can complement technology development. In the case of defensive RMTs, a firm may consider complementing the commercialization of the technology with an information campaign in which the hazards are made more salient to customers. For example, Johnson & Johnson, a technology leader in child-proof containers, is also a founding sponsor of ‘Safe Kids Worldwide,’ a nonprofit organization focused on preventing injuries in children that has developed information campaigns on safe medicine storage. These education programs provide value to the population and can shape user preferences, mitigating the trade-off between safety and other quality aspects of the products.
  4. The regulatory and legal environment affects safety technological advances. For many areas of medical technologies, such as robotic surgery and devices using artificial intelligence, governments are questioning whether and to what extent the current legal framework on safety and liability can adequately protect consumers. In February 2020, the European Commission released its “Report on the safety and liability implications of Artificial Intelligence, the Internet of Things and Robotics,” suggesting that there are important gaps that policy makers need to address to ensure consumer protection and to incentivize innovation. Such legislative uncertainty may reduce the value of RMT development, as firms may prefer to wait for greater clarity in the regulatory landscape. In some cases, firms may even be concerned about the possibility that the entire product category will be banned. For example, the FDA banned the cosmetic use of silicone breast implants in 1992 (for 14 years) due to health concerns of leaking silicone (Angell, 1996). This suggests that medical device firms may benefit from taking a more proactive role toward legislators, especially when developing differentiating RMTs in new and rapidly growing fields such as devices exploiting artificial intelligence and robotics. This can be done through direct advocacy or through participation in industry associations.
  5. The industry structure affects the incentives to develop RMTs. Changes in consumer risk perception often go beyond a particular product or manufacturer and spill over to similar or related products. Galasso and Luo (2021) show that media coverage of over-radiation accidents led to industry-wide changes in R&D strategy both from firms directly involved in the accidents, as well as from firms that were not. The largest manufacturers had a crucial role in developing and introducing new RMTs and applied for more patents related to radiation safety. This can be explained by economic incentives as large market shares provide greater incentives to internalize the liability and reputation costs. Moreover, large firms often have an advantage in appropriating returns from investments in safety across a wide range of products and customer segments. Agreement over new safety standards is also easier to reach in industries where the number of players is not too large.

A common view in academic and policy debates is that product liability risk retards innovation. For example, Porter (1990) recommends “a systematic overhaul of the U.S. product liability system,” arguing that in the United States, “product liability is so extreme and uncertain as to retard innovation.” While this can be the case in some circumstances (see Galasso and Luo, 2022), the framework presented in this paper suggests that the link between liability and innovation is complex and nuanced. Firms may respond to product liability risk through the development of RMTs. In practice, technology safety features differ in their impacts on consumer willingness to pay and protection to liability litigation. The development of RMTs might not be the right approach for every company, but in several situations medical device manufacturers can benefit from it. The key to success is to recognize the role of technology safety in innovation strategies, and to carefully consider its product market and defensive effects.


References

Angell, Marcia (1996) Science on Trial: The Clash of Medical Evidence and the Law in the Breast Implant Case W. W. Norton & Company

Crompton, Thomas (2020) “Robotic Surgery Equipment Manufacturing” IBISWorld industry report OD4074

Fox, Maggie (2013) “Electrical burns may burst surgical robot’s bubble” NBC news online article available at https://www.nbcnews.com/healthmain/electrical-burns-may-burst-surgical-robots-bubble-6C10321766

Galasso, Alberto, and Hong Luo (2017) “Tort reform and innovation,” Journal of Law and Economics 60: 385-412

Galasso, Alberto, and Hong Luo (2021) “Risk-mitigating technologies: The case of radiation diagnostic devices” Management Science 67: 3022-3040

Galasso, Alberto and Hong Luo (2022) “When does Product Liability Risk Chill Innovation? Evidence from Medical Implants,” American Economic Journal: Economic Policy 14: 366–401

Lex Machina (2020) Product Liability Litigation Report

Pisano, Gary (2019) Creative construction: The DNA of sustained innovation. Public Affairs

Porter, Michael (1990) The competitive advantage of nations, Free Press, New York

Thwaites, John (1999) “Practical aspects of drug treatment in elderly patients with mobility problems,” Drugs and Aging 14: 105-114


Emerging Technologies for Remote Monitoring of Elderly Patients

Swati DiDonato, Vittavat Termglinchan, and Kevin Schulman, Clinical Excellence Research Center, Stanford University School of Medicine

Contact: swatiy1@stanford.edu

Abstract

What is the message? Remote monitoring of older adults has the potential to transform the care of aging populations globally. Development of this technology comes at a critical time, when demographic trends are increasing need amid the reality of increased labor costs, decreased labor productivity, and worker shortages. While there is significant promise in this technology, there are significant challenges to the development and deployment of this technology at scale.

What is the evidence? The authors explore the technical, analytic, data interface and business architecture questions that must be addressed before the promise of remote monitoring technology can be fully realized.

Timeline: Submitted: May 4, 2023; accepted after review: May 10, 2023.

Cite as: Swati DiDonato, Vittavat Termglinchan, Kevin Schulman. 2023. Emerging Technologies for Remote Monitoring of Elderly Patients. Health Management, Policy and Innovation (www.HMPI.org), Volume 8, Issue 1.

Financial Support: The Stanford Clinical Excellence Research Center, the Stanford Partnership in AI-Assisted Care, and Kasikorn Bank PCL (KBank), Thailand, provided financial support for this work.

Acknowledgments: We thank Nora Richardson, librarian at the Stanford Graduate School of Business, for her assistance with searching for the companies included in this review.

Author Contributions: SD conducted data analysis, interpreted results, and drafted the paper. VT contributed to drafting the paper. KS supervised the data analysis and results interpretation and made substantial edits to the paper.

Competing Interests Statement: Kevin Schulman has a patent application currently pending. The application number is  US20190172566A1, “Mobile patient-centric electronic health records” (https://patents.google.com/patent/US20190172566A1/en). He has assigned this patent to Duke University if issued. Inventors are Kevin Schulman, Daniel Chander, and Rajan Patel.

Introduction

By 2050, 1 in 6 people in the world will be over the age of 65.1 To live at home independently, older adults need to be able to perform activities of daily living (ADLs) and instrumental activities of daily living (IADLs).2 Earlier detection of ADL impairments could provide an opportunity to deliver timely clinical intervention, potentially improving the ability to perform ADLs by a factor of two.3

Currently, ADLs and IADLs are measured through self-reported questionnaires or grading by caregivers, but these measurements are subjective and may be biased by the respondent seeking services.4 Systematic assessment of the performance of older adults is becoming more accessible through digital technology. Wearable devices can track not only ADLs, but also several clinical parameters (i.e. heart rate, respiration rate, and sleep pattern).5 With recent advances in multi-modal sensing technology, combining sensors, computer vision, and machine learning, we are at the dawn of the deployment of ambient intelligence – the ability to continuously and unobtrusively monitor and understand actions in physical environments.6 Ambient intelligence could potentially measure performance on ADLs and IADLs, while also detecting significant clinical symptoms in older adults.6,7

A Conceptual Framework

The senior care market has become an attractive area for investment. To better understand how these solutions are evolving, we reviewed the websites and publicly available information for 100 companies identified via review of the CB Insights and PitchBook databases and using the keywords remote monitoring, seniors, and healthcare (Table 1).

Table 1: Characteristics of selected companies focused on at home monitoring for senior patients identified via CB Insights and PitchBook databases

  Hardware Type Target End User(s) Data Display
LifePod Solutions Smart speaker Caregiver Online portal
Shenzhen Darma Technology Contact-free bed and chair sensor Patient, Caregiver, Family, Clinician, Researcher SaaS cloud platform
Tendertec Limited Wall sensor Caregiver Mobile application
VitalTech Bluetooth vital signs monitors Patient, Caregiver, Family, Clinician, Home Health/Care Agencies Platform accessible from smart devices, Electronic health record
Somatix Smartband Patient, Caregiver, Family, Senior Living Community Staff Cloud based dashboard, Phone application
Raziel Health FDA-approved vital signs monitoring devices, Smart phone camera, video monitors Clinician Smart phone application, Web portal, Cloud-based platform dashboard, Electronic health record
Anelto Console with speaker/microphone and option of video; Accessories including vital signs monitors, spirometer, scale, wristband wearable, fall detect pendant, and glucometer; Help button Caregiver, Clinician, Senior Living Facilities, Home Health Agencies Smartphone application, Dashboard
Nonnatech FDA-approved vital signs monitoring devices, radar and voice monitoring in development Physician/Clinical Practice, Home Health/Long Term Care, Senior Living Community, Payer/ACO, Hospital/Health System HIPAA-compliant platform, Electronic health record

Based on these data, were were able to generalize business strategies and challenges into four domains for this review. The first domain is technical – the type of technology being employed to capture and record data. The second is analytic – how are the data being used and evaluated. The third is interface – how are the data being shared. The final category is business architecture – the model for using the data and insights to provide services to patients. We discuss strategies to aggregate the data, turn data into insights, and ultimately push insights to a target end user who can take action.

Domain 1: Technical

The first step in any remote monitoring program is collecting data. A wide array of technologies can assist in collecting and recording data. Two major strategies have evolved – using  devices commonly found in homes or creating specialized devices for specific use cases.

At one end of the spectrum, we see hardware already familiar to many seniors, such as cell phones, wearable devices, and smart speakers. An advantage here is that seniors and caregivers are often already comfortable with them, even if they have not used them in this way before. This can decrease the barrier for them to initiate remote monitoring and help them feel more comfortable in the process. Other companies aim to place new types of devices in the home that are specialized for the data they are trying to collect. This has the potential to gather much more detailed and nuanced information to understand seniors’ life at home and well-being in ways we have been unable to measure previously. However, when specialized hardware is used, each new solution can be costly and can be a challenge for seniors to accept.

Domain 2: Analytic

A tremendous amount of data can be collected by these sensor technologies. A computer vision sensor for an ambient intelligent application generates 85 GB of data a day. This is impossible for one individual to sift through manually. Turning these data into insights that can be used effectively is the next major challenge. Efforts can range from simply alerting users to specific actions (say that a subject has fallen), changes in trends over time (subjects are more sedentary or somnolent), providing numeric measures on how a patient is performing in a specific domain, or generating composite measures of overall functioning or risk. Advanced analytics including machine learning can help generate signals from these immense data sets to provide actionable insights for users. However, this development is also novel and may lead to proprietary scores, with the underlying model not available for public scrutiny.

Domain 3: Interface

Analyzed data must reach users in an understandable, actionable format. The two most frequently used interfaces are mobile applications and online portals. Both are familiar for many users. Mobile applications have the advantage of accessibility independent of user location, while web portals have the advantage of more easily fitting into existing computer-based workflows. Additionally, portals can facilitate more robust functionalities for data display and user engagement.

Companies have also added value by personalizing data is seen, used, and shared. This can allow the healthcare professional to shape the interface in a way that is most useful for their workflow. Additionally, connecting with an electronic health record can help facilitate use of the data alongside the patient’s existing clinical data to create a more global picture of the patient’s clinical status inside and outside the healthcare setting. The 21st Century Cures Act creates rules and incentives for these data integrations.

Domain 4: Business Architecture

Companies are using a variety of business architectures to use the data and insights to provide services to patients, but who will be responsible for interpreting the information gathered and taking action?

Caregiver-based models

Some companies focus on providing information to the family member or caregiver, improving the ability of these individuals to understand and support a senior’s independence. An advantage of keeping the family member or caregiver at the center of the model is that these individuals are often already intimately involved in the day-to-day care of the senior and may have the time and motivation to readily act on the data. This may, however, exacerbate an already prevalent concern of caregiver burnout. Additionally, while having the family member or caregiver as the initial recipient of the data, this model can also lead to delays in diagnosis and treatment should a clinical response be required.

Healthcare professional-based models

Keeping healthcare professionals directly involved can help ensure major clinical changes receive appropriate responses. Some companies have created platforms that make it easier for healthcare professionals to quickly review and gain insights from their patients’ data. Medicare reimbursement opportunities have made this type of remote monitoring more appealing. Nevertheless, it can still be a challenge for healthcare professionals to add an additional step into their already complex, busy workflow.

Companies providing a service

In response to this challenge, some companies play a role in responding to the data and delivering care. This can help remove the burden from the patient’s primary care team but does require significant investment in creating the appropriate infrastructures to safely and reliably deliver care.

Key Considerations for Ongoing Development

Advances in ambient intelligence have the potential to shift our paradigm to patient-centered care rather than traditional physician-centered care. As we develop new models that incorporate remote monitoring technologies, several key areas will likely be crucial for success.

Clinical Validation

The types of data being collected are novel, and the models being developed are largely untested in terms of basic reporting such as alerts, or in terms of more significant applications such as the prediction of future events. Unfortunately, the private investment model may not face these issues with the humility required before we can consider deployment of solutions at scale. This reality is complicated by the fact that developing the underlying analytic technology will require large data sets to robustly analyze low-frequency events such as falls. The development of proprietary models will also make it difficult to determine if there are “class effects” in using one type of sensing modality for one specific purpose, or if we need to individually test each solution for each application. Finally, there is a question of generalizability of the technology across various segments of the population related to language, literacy, and education.

Demonstrating clear impact on clinical outcomes will be essential to establish that these technologies are serving a true clinical need if the financial model is based on insurance reimbursement. Alternatively, these technologies could be developed with a consumer-supported financial model (most assistive care services are not supported by insurance), where validation of benefit to the consumer would be used to drive demand.

HIPAA, GDPR, and Data Privacy

When discussing data sharing, it is critical to understand how seniors’ data will be protected. A robust privacy strategy is critical for any company in the healthcare space. In the United States, the Health Insurance Portability and Accountability Act (HIPAA) provides standards for protecting patient privacy when covered entities, the medical provider, health insurer, or clearinghouse, are involved in data collection. But HIPAA does not extend protections outside of these settings. For example, HIPAA would apply to a device managed by the healthcare professional in a patient’s home as part of a disease management program but would not apply to a self-pay consumer-based business model based on the same technology. For consumer models, data privacy is governed by the Federal Trade Commission and state privacy laws such as the California Consumer Privacy Act. In the European Union, the General Data Protection Regulation (GDPR) provides new accountability for data privacy. It is critical for companies to understand and comply with these different regulations when handling sensitive patient information.

FDA Clearance and Approval

When utilizing remote monitoring for clinical purposes, ensuring systems have been tested and validated is critical for patient safety. FDA clearance and approval is one avenue companies can take to conduct due diligence on their devices. While consumer devices do not require FDA clearance or approval, most medical devices that are collecting medical data do require this type of regulatory oversight. Software itself can also be considered a medical device requiring regulatory oversight, even if the hardware is considered a consumer-only device.

The FDA has used enforcement discretion in the past to highlight both its statutory authority and its desire to spur innovation in this space. Formal regulatory approval can also be a long and costly process. Finding a balance between innovation and oversight will be a continued challenge for companies in this space as they aim to provide maximal value to patients, minimize time to market, and ensure they are providing a clinically beneficial service while protecting this vulnerable population.

Fragmentation in Care

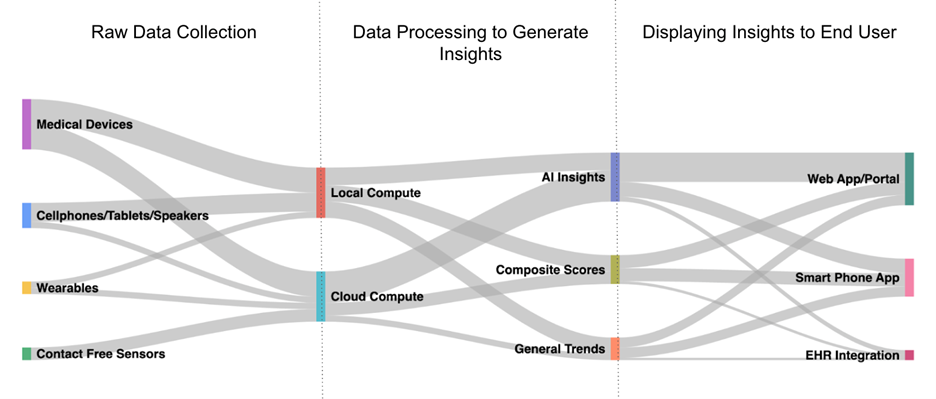
For providers, it is daunting to envision the challenges of integrating the different technologies and different workflows emerging as as this field evolves. These challenges could occur at a health system level, where orthopedics and primary care adopt different technology strategies requiring EMR integration, or at a practice level, where different patients purchase different technologies and services that are all intended to “integrate” into clinical practice but where each has their own proprietary reports, alerts, and data formats. If these new workstreams do not integrate with existing workstreams and systems, they can generate new data silos.8 This can exacerbate fragmentation of data, already a major barrier to information exchange in healthcare (See Figure 1).

Figure 1: Data flow in remote monitoring for seniors

The smart home industry is starting to solve the technology integration problem, with devices like Amazon Alexa and Google Home serving as hubs that work with different devices. But, as we have discussed, technology integration is just one domain in our four-domain framework.

From the provider perspective, the open question is the ability to integrate these data with electronic health records in a meaningful way so outputs can be combined seamlessly with existing clinical data. This requires the development of standard application programming interfaces (API’s) for two-way data exchange specific to ambient intelligence data and services.

Conclusion

Remote monitoring of older adults has the potential to transform the care of aging populations globally. While there is significant promise in this technology, technical, analytic, data interface and business architecture questions must be addressed before we can realize the clinical benefits of this technology at scale.

References

  1. United Nations. World Population Ageing 2020. https://www.un.org/development/desa/pd/sites/www.un.org.development.desa.pd/files/undesa_pd-2020_world_population_ageing_highlights.pdf (2020).
  2. Katz, S. Assessing self-maintenance: activities of daily living, mobility, and instrumental activities of daily living. J Am Geriatr Soc 31, 721–727 (1983).
  3. Phelan, E. A., Williams, B., Penninx, B. W. J. H., LoGerfo, J. P. & Leveille, S. G. Activities of daily living function and disability in older adults in a randomized trial of the health enhancement program. J Gerontol A Biol Sci Med Sci 59, 838–843 (2004).
  4. Carlsson, G., Haak, M., Nygren, C. & Iwarsson, S. Self-reported versus professionally assessed functional limitations in community-dwelling very old individuals. Int J Rehabil Res 35, 299–304 (2012).
  5. Wang, Z., Yang, Z. & Dong, T. A Review of Wearable Technologies for Elderly Care that Can Accurately Track Indoor Position, Recognize Physical Activities and Monitor Vital Signs in Real Time. Sensors (Basel) 17, E341 (2017).
  6. Haque, A., Milstein, A. & Fei-Fei, L. Illuminating the dark spaces of healthcare with ambient intelligence. Nature 585, 193–202 (2020).
  7. Uddin, M. Z., Khaksar, W. & Torresen, J. Ambient Sensors for Elderly Care and Independent Living: A Survey. Sensors (Basel) 18, E2027 (2018).
  8. Lee, P. et al. Digital Health COVID-19 Impact Assessment: Lessons Learned and Compelling Needs. NAM Perspectives.Discussion Paper, National Academy of Medicine, Washington, DC (2022).
  9. Lifepod, Giving Voice to Caregivers. https://lifepod.com/ (2022).
  10. http://darma.co/ (2022).
  11. Tendertec, Carebox. https://tendertec.org/carebox/ (2022).
  12. Somatix, Data with a purpose. https://somatix.com/ (2022).
  13. http://caretechsys.com/ (2022).
  14. https://nonnatech.com/solutions-the-nonnatech-difference/real-time-analytics/ (2022).
  15. https://www.razielhealth.com/solutions (2022).
  16. Vitaltech, Vitalcare, Decentralized Care Services Across The Care Continuum. https://vitaltech.com/vitalcare/ (2022).
  17. Anelto, Helping seniors thrive. https://www.anelto.com/remote-patient-monitoring/ (2022).


University of Miami’s Business of Health Care Conference: Managing Through Uncertainty

Karoline Mortensen, Steven G. Ullmann, and Richard Westlund, Miami Herbert Business School, University of Miami

Contact: sullmann@bus.miami.edu

Abstract

What will you learn? The University of Miami held its 12th annual Business of Health Care Conference. Panelists discussed post-pandemic financial challenges, patient confidence in and access to care, AI and telehealth, and other key issues shaping the health sector.

What is the evidence? The authors summarize the discussion at the panel.

Timeline: Submitted: May 4, 2023; accepted after review: May 16, 2023.

Cite as: Karoline Mortensen, Steven Ullmann, Richard Westlund. University of Miami’s Business of Health Care Conference: Managing Through Uncertainty. 2023. Health Management Policy and Innovation (hmpi.org), Volume 8, Issue 1.

“Managing Through Uncertainty” was the theme of the University of Miami Center for Health Management and Policy’s 12th annual Business of Health Care Conference. Returning to an in-person venue with nearly 700 registrants on February 24, 2023, the conference focused on revenue models, technology, equitable access to care, and other relevant issues in the nation’s health care sector.

One of the highlights of the University of Miami’s annual conference is the convening of high-level panelists from the various sectors of the healthcare industry. This year’s panel included Matthew Eyles, president and CEO of America’s Health Insurance Plans; Halee Fischer-Wright, MD, president and CEO of the Medical Group Management Association; Ernest Grant, PhD, immediate past president of the American Nurses Association; Rachel Villanueva, MD, immediate past president of the National Medical Association; Lori M. Reilly, Esq., chief operating officer of the Pharmaceutical Research and Manufacturers of America; and Molly Smith, group vice president, Public Policy, American Hospital Association. The panel was moderated by Patrick J. Geraghty, president and CEO of Guidewell and Florida Blue.

Dr. Fischer-Wright started off the dialogue by emphasizing the need to sustain the practice of medicine in the face of uncertainty. “The pandemic showed the shortcomings of the fee-for-service model, as revenue came to a halt when patients stayed home to avoid COVID,” she said. “Only action by the federal government saved many practices. Now, we must put in safeguards so patients can get the quality care they need everywhere in the country.”

Hospitals are also wrestling with post-pandemic financial issues, including rising costs and staffing shortages, said Smith. “We need to look at new staffing models for healthcare and how different professionals can work together,” she said. Dr. Grant agreed, adding that nurses need to be at the patient’s bedside with the ability to practice to the full limits of their licenses. Dr. Villanueva noted that the pandemic highlighted structural issues of inequity relating to access to care. “Going forward, we need to be sure that health equity is as important as access to high quality care and make evidence-based decisions to support that goal rather than ‘feel-good’ programs,” she said.

Eyles pointed out that one of the few positive aspects of the pandemic was the increase in healthcare coverage to more than 300 million Americans, with a corresponding drop in the uninsured rate. However, there is still a need to close the gaps in care and deal with high costs in the healthcare system. “The pandemic showed the healthcare system could innovate and change more quickly than anyone thought possible,” he said. “Now, the question is whether we can sustain that change and address issues like a deep mental and behavioral health crisis throughout America.”

A significant question brought up by both Drs. Villanueva and Fischer-Wright was the impact from the end of the federally designated COVID special emergency period in April. Concerns include providers leaving the workforce, healthcare facilities having financial difficulty, and the effect of those trends on access and quality of care for patients.

Technology and Care

When Geraghty asked the panelists about the role of technology in addressing the uncertainties of healthcare, Dr. Fischer -Wright said it can augment relationships between providers and patients. She noted that telehealth visits increased from 1 to 90 percent of all consultations during the pandemic. The trend was driven by patient and provider concerns, as well as a policy shift enabling Medicare reimbursement for telemedicine, followed by private insurance companies. While this augmented the provider-patient relationship, the number of telemedicine consultations has now dropped down to 10 percent of all medical visits.

Both Dr. Fischer-Wright and Dr. Villanueva spoke to the unevenness of adoption of telehealth due, in part, to the uneven distribution of broadband, wireless, and smartphones. Dr. Villanueva added that “race” is a social concept that impacts how patients access care and the services they receive. “We have to find a way to overcome these biases and ensure everyone receives equally high-quality care, and treat each patient as an individual.”

Interoperability continues to be an issue affecting multiple sectors of the health care industry. Dr. Fischer-Wright indicated integrated electronic health record (EHR) data could lead to better patient outcomes and greater understanding of community needs. But she stated that there was growing patient concern regarding security and privacy, adding, “We may be going backwards.” In any technology field, Eyles indicated the need for high standards in data management as well as data sources that can be trusted.

Concerns about Distrust

This issue of rising distrust in science and medicine was another important discussion topic for the panelists. Geraghty brought up the need for educational conversations with patients and family members regarding science and healthcare data at a time when imminent care needs are not being experienced. Dr. Grant agreed, adding, “Year after year, nursing is the most trusted healthcare profession. We are part of the community, and we need to lead the charge when it comes to education.”

As Dr. Villanueva pointed out, trust is impacted negatively when patients don’t have the educational background or health literacy to understand medical issues and instructions, and it is incumbent upon the physician to take the time to explain things in a manner that the patient can understand.

Other aspects of patient and family distrust, as noted by Smith, include the difficulty of navigating the healthcare system. She noted that individuals who find it difficult to make appointments and access appropriate care are less likely to have positive feelings towards providers.

Reilly indicated that the COVID pandemic did bring about pharmaceutical industry partnerships with community organizations and emphasized the importance of maintaining and furthering these relationships, including clinical trials that include participants from undeserved communities.

The panelists agreed that the timely development of COVID vaccines and medications was a global success for the pharmaceutical sector. But they emphasized the importance of avoiding complacency and being prepared for the next pandemic. Reilly was also concerned about an increase in secondary infections that are resistant to antibiotics. “In our lifetime, it is possible that we might not survive strep throat,” she said.

Reilly added that pharmaceutical companies have stewardship programs regarding antibiotics, but there is a need for support from the federal government. It was noted that antibiotics are more difficult to make than other medications, and new therapies may need to be held in reserve for future use. Smith agreed and indicated that the costs of developing new expensive medications need to be built into the healthcare system.

The Potential for AI

A discussion of Artificial Intelligence (AI) also ensued. Geraghty and Eyles indicated that AI can create opportunities for innovation but there are also challenges regarding effective implementation. For example, AI systems can provide guidance for better outcomes for patients, providers, and payers, but personal privacy protections are limited.

Dr. Fischer-Wright also indicated that AI can be helpful in many ways and is especially helpful in mental and behavioral health. Reilly added that AI tools are also useful in pharmaceutical development and can improve the success rate by searching a library of compounds more quickly in the early process of development.

Smith indicated that AI can help address the nationwide issue of workforce shortfalls. But she and Dr. Villanueva agreed that AI will not replace personalized care for the nation’s diverse patient population.

As was evident in the discussions, the issues involving patients, providers and payers are complex. While much has been learned as a result of the pandemic, the future is uncertain. But it is clear that strong leadership will be critical in managing the ongoing uncertainties of the nation’s healthcare system.

Evaluating the Need for a New Pharmaceutical Company in Africa Based on the Civica Rx Model

Abstract

Nina Yun, Stanford Graduate School of Business, Kola Lawal, Stanford Graduate School of Business, Kevin Schulman, Clinical Excellence Research Center, Stanford University School of Medicine, Stanford Graduate School of Business, Iain Barton, Health4Development

Contact: iain@health4development.com

What is the Message? Like many global markets, countries across Africa face challenges in access to essential medicines, most of which are non-patented generic products. A proposed new company, NewPharmaCo Africa (NPC Africa), deploys a CivicaRx-based organizational model to provide access to high-quality pharmaceuticals produced locally in Africa, contribute to the diversification of global pharmaceutical supply chains, and reduce Africa’s dependence on foreign suppliers.

What is the Evidence?  Testing the NPC concept through in-depth interviews with experts possessing specialized knowledge in diverse fields, including pharmaceutical manufacturing, demand aggregation, supply chain management, procurement, and regulatory affairs. A concurrent thematic analysis extracts the central themes from each interview, forming the foundation for the recommendations presented in the paper.

Timeline: Submitted: June 20, 2023; accepted after review: June 21, 2023.

Cite as: Nina Yun, Kola Lawal, Kevin Schulman, Iain Barton. 2023. Evaluating the Need for a New Pharmaceutical Company in Africa Based on the Civica Rx Model. Health Management, Policy and Innovation (www.HMPI.org), Volume 8, Issue 1.

Introduction

Africa faces numerous challenges in meeting its healthcare needs, fueled by limited access to affordable, high-quality medicines. Many African countries rely heavily on imported pharmaceuticals, with up to 70%-90% of the drugs consumed on the continent being imported. Four countries in Africa must be aggregated to find more than 50 manufacturers while 22 have no local production. Furthermore, the currently established systems used to track the quality of drugs are inadequate and insufficient, resulting in unacceptable levels of counterfeits and low-quality drugs. This reliance on imports leaves the African healthcare system vulnerable to supply chain disruptions, price fluctuations, and limited access to essential medicines, which can have serious implications for public health outcomes. These vulnerabilities were exacerbated during the COVID-19 pandemic.

The pandemic also highlighted the vulnerability of pharmaceutical supply chains globally, as the United States and Europe were among the regions that faced significant challenges in maintaining their pharmaceutical supply chains during the pandemic. The pandemic highlighted the dependence of the United States on foreign-made pharmaceuticals, particularly from China and India, which supply over 80% of the active pharmaceutical ingredients used in US drugs. Countries in Europe faced similar issues, struggling to secure essential medicines and supplies. In response, both the US and Europe have taken steps to diversify and strengthen their pharmaceutical supply chains.

One of the most innovative responses to the economics of the generic drug market in the US was the establishment of CivicaRx, a not-for-profit drug company designed to provide high-quality products for US hospitals. CivicaRx is an organizational solution to address product cost, product quality and supply chain quality. CivicaRx accomplishes this model by pooling purchasing across member organizations and focusing on long-term supply contracts to address product and supply-chain quality. By moving from spot-pricing for products to a more stable procurement model, the CivicaRx solution has now been tested and proven to achieve its initial goals.

Based on this successful implementation of a new economic model in the generic drug market, we were interested in the question of whether this successful model can be implemented at a continent-level in Africa to address price, product quality and supply-chain quality challenges. We examine the creation of NewPharmaCo Africa (NPC Africa). NPC Africa will be a non-profit entity focused on driving access to affordable, quality medicines that are manufactured in Africa, both for consumption on the continent and for export beyond. Learning from the experience of in the USA, while leveraging the existing capacities of local enterprises and supported by the strategic ambitions of national governments and international donors, NPC Africa will, through investments, partnerships, and licensing agreements, disrupt the status quo and respond to market dynamics across the pharmaceutical value chain. NPC Africa will initially work with local manufacturers to scale their output, before moving up the value chain and developing manufacturing capability.  As a public benefit organization, NPC Africa will engage and serve both public and private health sectors across Africa.

In this study, we evaluated the need and commercial and operational feasibility of starting NPC Africa. We also outlined further research and work that is needed to fully flesh out our hypothesis.

Overview of NewPharmaCo Africa to Drive Access to Affordable, Quality Medicines

NPC Africa will engage and serve both public and private health sectors across Africa. The Africa Union (AU) and Africa CDC have called for a ‘New Health Order’, defined by five pillars. Pillar 2 is “Expanded Manufacturing of Vaccines, Diagnostics, and Therapeutics to democratize access to life-saving medicines” for which the AU has set a target to buy 60% of vaccine requirements from regional producers by 2040. Concurrently, the United States government (through PEPFAR) committed to buying antiretroviral (ARV) drugs in Africa, which is vital for sustaining the HIV/AIDS pandemic response.

A vibrant African pharmaceutical industry would have several benefits, including: Driving local socio-economic growth, providing a robust and resilient supply of medicines for African markets, diversifying Active Pharmaceutical Ingredient (API) sourcing and generic medicine supply for the US and European markets, and providing local licensing partners in emerging markets for innovator US and European pharmaceutical companies.

The poor economics of Africa importing more than three-quarters of its essential medicines, as well as the failures in the supply-chain of personal protective equipment (PPE), diagnostic tests, and vaccines during the COVID-19 pandemic, have combined to focus political support on the need for a more robust African pharmaceutical industry. NPC Africa will secure and invest private capital to establish a socially aligned manufacturer of ARVs and other medicines, compliant with global quality standards, and with the capacity to serve Africa.

NPC Africa will implement its plan in five phases:

  • Phase 1: Aggregate Demand
    • NPC Africa’s investment and return thesis is predicated on the ability to secure long-term off-take agreements of significant volume from donors and governments and the provision of preferential investment and supply arrangements. These can be provided by:
    • Local country governments, either individually, through regional economic coalitions or through the African Union
    • Major donors such as the US government, the Global Fund, UNICEF, and GAVI
    • The procurement agencies of the governments of Europe
    • Harmonization of regulatory structures across participating countries will reduce barriers to market entry and enhance oversight of product quality.
  • Phase 2: Quality and Capacity
    • NPC Africa will inject capital into existing regional African manufacturers to grow their capacity, extend their operations to include API production. To grow export opportunities and ensure product quality, NPC will work to achieve US Food and Drug Administration (FDA) certification.
    • Invested companies will already be commercially viable, with local market presence. Production quality will be assessed through the presence of contract manufacturing organization (CMO) partnerships with global pharmaceutical manufacturers.
    • Secure Product Portfolio Scale Voluntary licenses for medicines will be secured from leading US and European pharmaceutical companies through potential partnerships with organizations such as the Voluntary Licensing & Access to Medicines (VLAM) initiative and the Medicines Patent Pool.
  • Phase 3:
    • NPC Africa will acquire the African rights of a significant pharmaceutical company that is already active on the continent.
    • Two potential targets for consideration could be the “end-of-life” products of GlaxoSmithKline (GSK) and the range of Sandoz.
  • Phase 4: Localize and Expand
    • Assign CMO contracts to produce the acquired licenses described in Phase 2 will be transferred to the local production capacity of the investee companies described in Phase 1.
    • NPC Africa will secure voluntary licenses with leading US and European pharmaceutical companies to manufacture and distribute innovative medicines to African patients under license from the originators.

Estimated Capital Requirement and Likely Sources of Implementation Financing

The total estimated capital raise of $800m over 3 years splits as $650 investment and $150m working capital and deploys as $250m on the investments, quality upgrades, and capacity expansion described in step (1); $300m in the catalog/license acquisitions described in step (3); and $100m for the capacity and quality expansions anticipated in (4).

Likely sources of financing include: Development finance institutions (DFIs) such as the US International, Development Finance Corporation (DFC), the World Bank/International Finance and Corporation (IFC), private capital including foundations, impact investors, and pharmaceutical company investment funds. Innovative alternatives may be possible in the execution of Phase 3, such as where the sellers might be encouraged to provide vendor financing.

NPC Africa is expected to have a number of developmental impacts including: Creating sustainable jobs, building robust African health systems, attracting strong capital investment, and promoting localized manufacturing. developing licensing partnerships, growing south-south trade, driving local innovation/R&D, and significantly reducing environmental impacts associated with legacy manufacturing processes and long-distance supply chains.

NPC Africa is also expected to have a positive impact on US and European exports. The organization will partner with US and European businesses to source equipment, skills, quality, and IT systems. NPC Africa will also provide API security and manufacturing capacity for US and European markets and manufacturers.

Interview Methodology

To thoroughly explore our proposal for the NPC, we conducted an extensive evaluation of diverse stakeholders to gain their unique perspectives. The data collection process involved a qualitative approach similar to the Delphi method. Semi-structured interviews were conducted with a panel of stakeholders directly relevant to our research question. Purposive sampling was employed to select individuals with specialized knowledge in areas such as pharmaceutical manufacturing, demand aggregation, supply chain management, procurement, and regulatory affairs.

All interviewed experts received a 2-page document outlining the NPC proposal prior to the interview. Recruitment of study participants ceased when data saturation was achieved, and no new themes emerged.

Verbal consent was obtained from all participants before the interviews. Interview guides were developed with pre-agreed topics to assist the interviewers. The majority of the interviews were conducted virtually, and consent for audio recordings was obtained beforehand. The interviews generally lasted between 45 minutes to 1 hour. Parallel notetaking was employed during the interviews, and retrospective reviews were conducted to complement the live notes. Concurrent thematic analysis was conducted to identify essential themes from each interview, which helped identify new topics for subsequent interviews. In total, we conducted interviews with 15 individuals.

Results

After going through existing literature and conducting our interviews, we laid out the current issues with the NPC business concept into five buckets: demand aggregation, supply of medicines, product portfolio, government involvement, and fundraising/business model. We lay out our findings for each topic below.

Demand Aggregation

Demand aggregation refers to the consolidation of purchase requests from multiple buyers into a single unified requirement, harnessing the collective buying power of various stakeholders. The significance of demand aggregation was underscored by the CIVICA model.

A participant emphasized, “Gaining the commitment of systems and purchasers is of utmost importance. Civica managed to secure volume commitments of 40-50% from their member hospitals. This gave them substantial and stable purchasing power, ultimately leveraging their negotiations with producers.”

Another key benefit of demand aggregation is the positive impact that it has on manufacturers. One interview candidate remarked that “We need advanced market agreements and long-term offtake agreements. This provides both suppliers and buyers with stability and gives manufacturers the certainty needed to invest in their operations.”

Despite the widely recognized advantages of demand aggregation, challenges primarily stem from engaging all stakeholders, particularly the government. Currently, governments face difficulties in accurately forecasting demand and lack sufficient data collection. To ensure effective national-level demand aggregation, governments must improve their data collection, analysis, and forecasting capabilities.

An interview candidate noted, “Governments need to place accurate orders based on demand aggregation and procurement patterns. Coordinated efforts are required from governments and organizations to forecast demand accurately. Governments need reliable data to formulate these forecasts.”

The issue of data scarcity was further highlighted by another candidate who mentioned, “Data on demand for different products is practically non-existent, leaving procurement officers to rely on educated guesses when making purchases.”

Another candidate emphasized the need for coordinated efforts between governments and organizations to accurately forecast demand. Additionally, the lack of regulatory cohesion and varying levels of sophistication among different government stakeholders pose obstacles to demand aggregation.

An interviewee shared, “We encountered difficulties in aggregating demand because some states lacked a dedicated medicines agency or a procurement team. Consequently, individual hospitals and clinics had to handle their own procurement.”

Nevertheless, there are notable instances where demand aggregation has been successful on the continent, such as during the COVID-19 pandemic.

An interviewee stated, “The African Medical Supplies Platform (AMSP) was established during the pandemic, enabling pooled procurement across the continent. This approach enhanced negotiating power when securing purchase agreements with both foreign and domestic suppliers.” The AMSP is an encouraging example that confirms that demand aggregation is a possibility on the continent and highlights the potential benefits that can come from aggregation.

 When considering demand from the continent vs. demand from outside the continent, our interviewees agreed that demand needs to come from various sources and NPC cannot solely rely on global health organizations.

“In order for this to work, there needs to be a demand market outside of global health. NPC should be chasing business on the continent. NPC can think of ways to work with both private and commercial channels [such as pharmacies] and the public sector on the continent to procure demand. NPC can also utilize the growing health tech sector.”

It’s clear that NPC’s greatest value will come from its ability to “aggregate the commercial piece (how it marks up drugs, distribution, and how it secures procurement deals)”, therefore, having a robust demand aggregation strategy that addresses the concerns mentioned above is key.  An important part of this will be aggregating demand from both the public and private sectors on the continent, as well as working with global health organizations.

Supply of Medicines

Currently, Africa’s reliance on pharmaceutical drugs from the East, particularly India, and China, is a prevailing issue. PEPFAR has engaged with existing suppliers from India and China for antiretroviral drugs (ARVs), potentially adding to the issue. It is primarily due to the efforts of PEPFAR that existing Indian generic players have shown interest in expanding their presence in Africa. The scale of demand for ARVs is crucial in making the business case work, and the major Indian players in the industry have expressed their willingness to set up facilities in the region through joint ventures to meet potential demand.

In the past, hospitals in Africa purchased drugs from open markets, leading to challenges in managing supply chains and significant expiry of drugs. Recognizing the need for transformation, efforts have been made to aggregate demand and bring together all stakeholders to address these issues. However, the demand from individual countries is often too small to negotiate directly with manufacturers, creating obstacles in diversifying the drug supply chain.

Many acknowledged that Indian companies would not look favorably towards Africa increasing its local manufacturing. However, from a political perspective, Indian governments understand the necessity for Africa to shift from relying solely on drug imports to developing manufacturing capabilities. The COVID-19 pandemic has underscored the importance of building baseline infrastructure and the ability to pivot from import dependence. To foster local manufacturing, countries need to invest in infrastructure development. Overall, the need for Africa to develop its own manufacturing capabilities to reduce dependence on imports and improve supply chain management was highlighted.

When thinking about drug production, many of our interviewees suggested that NPC collaborate with existing manufacturers (rather than building up their own capabilities) for a variety of reasons.

First, there is currently an over-saturation of manufacturing capacity following the pandemic. It is important to start by outsourcing to manufacturers already equipped to meet stringent quality requirements. This approach can help avoid issues related to scalability and ensure the sustainability of the supply chain.

Second, creating in-house manufacturing capabilities is extremely expensive and time-consuming. It could take up to 5 years and hundreds of millions of dollars if NPC wants to create its own drugs. This is why Civica worked with manufacturers that already had FDA approval and excess capacity. Civica appealed to manufacturers by providing them with a 24-month rolling forecast, ensuring steady demand, and not returning anything.

Third, NPC can help foster local industry by working with existing manufacturers. In the past, local manufacturers faced challenges where they invested in obtaining qualifications, such as WHO certification, but didn’t receive orders. This led to financial setbacks and made local manufacturers wary of international organizations. NPC can help bridge the gap and ensure local manufacturers will receive a steady supply of orders and make sure they have up-to-date qualifications.

Finally, by outsourcing manufacturing, NPC can avoid worrying about manufacturing and provide value on the commercialization piece, as mentioned above in the demand section.

We spoke to local manufacturers, who expressed their willingness to collaborate with NPC.

“We would willingly collaborate with NPC and welcome them with open arms if it helps the local manufacturing industry. If local manufacturers had access to guaranteed volumes, new technology, tech transfers, and linkages to big pharmaceutical companies, we could work with NPC on manufacturing their products. This could be a win/win if NPC is not seen as the competition. If NPC can guarantee volumes for a set amount of time, local manufacturers will commit to the price and quality.”

Local manufacturers, like the one quoted above, see a potential partnership with NPC as a huge win for the continent. They emphasized the importance of long-term framework agreements (3-5 years) to provide them with certainty in terms of price and volume. In addition to NPC providing investments in local manufacturers, the credibility of a non-profit organization like NPC would allow NPC to work with big pharmaceutical companies to increase access for local African manufacturers. Currently, it’s difficult for local African manufacturers to get voluntary licenses from big pharmaceutical companies. NPC could provide value by being the intermediary between multiple local manufacturers and big pharmaceutical companies. NPC’s negotiation power could even lead to continent-wide licenses.

While the desire to work with an organization like NPC is strong, local manufacturing in Africa faces numerous challenges that need to be addressed. Currently, one of the biggest issues for local manufacturers is the lack of a unified buyer to achieve economies of scale for manufacturing. This inability to achieve economies of scale has made it difficult to navigate local regulation and market access issues without some assurances of demand. The market access issues have made very few companies willing to prioritize regional concerns, opting for a country-by-country approach instead. In addition, there is a need for increased investment in local manufacturing. Many machines are outdated, and workers do not know how to operate or maintain many of the machines. Increased funding for education and new technologies is needed to foster local manufacturing.

NPC can address many of the current local manufacturing issues by injecting capital and increasing the capacity and quality of local manufacturers. NPC can also work with multiple local manufacturers and help them gain regional market access as well as provide a link to big pharmaceutical companies. 

Product Portfolio

 When discussing the product portfolio with our interviewees, everyone agreed that it should be primarily based on demand. While specifics on the sequencing of APIs vs. finished goods varied, all our interviewees underscored the importance of market dynamics. One of our interviewees stated the following:

“The pharmaceutical product portfolio needs to include both APIs and finished goods. Merely focusing on finished goods without considering the inclusion of APIs would not be sufficient. To incentivize investment and business development, it is important to identify the specific products in the African market that can attract manufacturers and players in the value chain. Rather than relying on a single manufacturer to produce everything, it is crucial to encourage collaboration among different players, including API makers and finished goods manufacturers.”

Another interviewee noted that in India and China, the sequencing of product development has begun with starting materials, progressing to APIs, and then moving on to finished dosage forms. For the continent, it’s essential to critically assess whether Africa should begin with finished forms, taking into account competition with larger companies for high-volume products. As bigger players may find essential medicines less attractive, there could be an opportunity for niche products that cater to specific demands.

Given these considerations, Civica’s approach could be a good playbook for NPC when thinking about product portfolios. Civica analyzed the history of drug shortages and investigated the manufacturing landscape for specific drugs and their active ingredients. Through collaborative efforts and regular meetings with the hospitals, a target list of essential medicines was established. This list was then periodically updated to reflect changing demands and sourcing capabilities. When setting prices, Civica looked at everything on a product-by-product basis, ensuring that Civica was staying competitive with the market while ensuring consistent supply and pricing.

Government Involvement

Government involvement in fostering the growth of the local industry will be crucial to the success of NPC. Current government sentiment varies by country, as mentioned by our interviewees. Countries that are more favorable towards the pharmaceutical industry include Kenya, Uganda, Rwanda, Ethiopia, Botswana, Ghana, and Nigeria. Governments can support pharmaceutical manufacturing though its roles as a regulator, as a buyer and as an enabler of industry through trade incentives and infrastructure investment.

Governments need to provide incentives to local manufacturers to help develop the industry, including measures like accelerated depreciation and export credits. This support is essential to create an enabling environment for local manufacturers and foster industry growth.

Governments also need to enact education programs to foster the local industry.

“A desire to foster industry and build up local capabilities is extremely important. India, China, and Ireland are good examples of this. For example, in Ireland, the government built up the education infrastructure, were extremely friendly to manufacturers, was tax-friendly, and pumped a lot of money into the infrastructure. By investing in education and skill development, governments can ensure a pool of qualified professionals to drive the growth of the pharmaceutical sector.”

On the point of local industry, one participant expressed some words of caution.

“While fostering the local pharmaceutical industry is desirable, it may not always align with the objective of increasing access to medicines. No single country can produce everything it needs, and a well-functioning global supply chain is necessary. Maintaining a resilient and connected supply chain is crucial, even if local production is encouraged. Fostering local production should not lead to the loss of economies of scale, as each country preferring local procurement can hamper efficiency and cost-effectiveness.”

Thus it is important that NPC is extremely clear in its goals and understanding the tradeoffs between fostering local industry and increasing access.

Our interviewees also highlighted the importance of regulatory considerations – particularly the importance of a robust regulatory environment in both the manufacturing and importing countries.

“Manufacturing countries need to uphold good manufacturing practices (GMPs) and ensure the trust of importing countries. Targeting a few manufacturers and bringing them up to international standards is a key step. Mature regulatory environments for exporting medicines include Tanzania, Ghana, Kenya, Nigeria, and South Africa. Making the regulatory process fiscally viable for local regulators is important, and this can be achieved through fees for dossiers and mutual recognition between countries.”

Another participant emphasized the importance of harmonization of regulatory processes for efficient operations. Currently, there are different regulatory requirements for the same product in different countries, causing a lot of inefficiencies. NPC can play a role in creating awareness and advocating for a harmonized approach to regulatory approval across countries. In recent years, regulatory harmonization efforts have gained momentum, with Southern African countries like Zambia, Zimbabwe, Botswana, and Namibia joining forces to address gaps and align their regulatory processes. NPC can use this momentum to further move forward with regulatory harmonization.

Fundraising / Business Model

The sustainability of the business model and the required amount of fundraising to achieve NPC’s milestones were the primary concerns. Government grants and early buy-in from stakeholders were identified as crucial funding sources. Understanding investor appetite for a business model like NPC was also a key consideration.

An interviewee noted, “There is a gap between what investors are seeking and what organizations are willing to commit to.” This quote suggests that investors are interested in projects like NPC but haven’t found suitable investment opportunities.

Another important aspect discussed during the business model deliberation was the choice between a for-profit and nonprofit model. Our interview candidates expressed contrasting opinions on this matter.

“Some medicines should be considered public goods and distributed under a non-profit model, particularly those included in the World Health Organization (WHO) Emergency Medicines List (EML),” stated one candidate.

Others emphasized the challenges associated with a non-profit organization.

“The sustainability of non-profits is a challenge. They need to demonstrate their ability to sustain the model without relying on grants or donor financing.”

The decision to adopt a for-profit or non-profit approach is also influenced by concerns about corruption. One interview candidate highlighted, “The for-profit model raises concerns about corruption, and transparency becomes the key to address these concerns.”

Quality Control

NPC aims to address the pressing need to enhance the quality of pharmaceutical products across the continent. This recurring theme of striving for higher quality was evident throughout our interviews.

A particularly insightful interviewee emphasized the significance of quality and effective regulation by stating, “Many hospitals are compelled to procure medicines from open markets, making it exceedingly difficult to distinguish between genuine and counterfeit drugs.”

Another interview candidate highlighted the importance of adhering to stringent quality tests, stating, “Civica exclusively collaborates with manufacturers who successfully pass rigorous quality assessments.”

Given the porous borders in the region, it becomes imperative to establish regional quality standards. As one candidate emphasized, “Neighboring countries must collaborate in developing and upholding quality standards; otherwise, shortcomings in one country’s regulatory framework could compromise the standards for all neighboring nations.”

Furthermore, maintaining high-quality standards was stressed by another interviewee who remarked, “Emphasizing quality is crucial as our ultimate objective is to attain WHO prequalification and FDA certification to facilitate the exportation of pharmaceutical products.”

By integrating these valuable insights, it becomes evident that NPC recognizes the pivotal role played by quality enhancement in the pharmaceutical sector across the continent.

Conclusion

Based on our findings above, we believe that NPC can create value and accomplish the goals outlined for the organization. Many of our participants agreed on the need for increased local production and were enthusiastic about our hypothesis. However, they emphasized the current issues of fragmentation and a lack of communication and prioritization. NPC can kick off conversations on both the supply and demand side to increase awareness and coordination.

Further development of the NPC concept should take the following next steps:

Demand Aggregation

  • NPC can add value by working with an initial small set of countries and collaborating with the healthcare industry to collect data and aggregate demand.
  • Post-pandemic efforts to aggregate demand such as the Africa Medical Supply Program have proven that demand aggregation is possible on the continent and serve as a working model that others can follow.
  • NPC’s biggest value-add can be the commercialization piece of the supply chain and collaborating with the public and private sectors of the region as well as global health organizations.
  • We were unable to interview anyone from a big pharmaceutical company to inquire about their methods of sourcing. However, we believe this should be a secondary concern after procuring demand on the continent.

Supply

  • NPC can work with existing manufacturers on the continent and provide capital to increase their capabilities and technology.
  • NPC can add value by being a liaison between local manufacturers and big pharmaceutical companies, providing guaranteed contracts, and working with governments to increase market access.

Product Portfolio

  • Product portfolio should be based on demand and manufacturing capabilities and should include APIs as well as finished goods.
  • Civica’s model can be a playbook for NPC → NPC can gather potential buyers and go through a list of medicines with them to understand prioritization.

Government Involvement

  • The short-term and long-term goals of NPC are extremely important – increasing and maximizing market access may come at odds with fostering the local manufacturing industry.
  • Government involvement is important in order to foster the local industry, provide incentives for both purchasers and increase manufacturers, increase the efficiency of regulation practices, and shift procurement models from short-term tenders to long-term framework agreements.
  • NPC can provide value by increasing awareness and advocating for a more harmonized regulatory environment.

Financial Model

  • Identifying appropriate sustainable funding sources will be critical to assuring the commercial feasibility of NPC.
  • Relying on government grants, similar to Civica, is more difficult on the continent given the restricted limited supply of capital.
  • The issue of nonprofit vs for-profit should be further explored. This business model is difficult and would not provide the returns that many VC / PE firms require.
  • We were unable to interview sustainable investing firms. This could be another important source of funding.

Quality

  • Neighboring countries need to agree on regional quality standards and enforcement practices to limit the practice of undercutting which individual efforts by individual countries futile.
  • NPC needs to take the question of quality out of the conversation – global organizations will only purchase from NPC if they completely trust the quality of the product.

NPC Business Development

In order to foster local industry and increase access to drugs on the continent, there are multiple moving parts and organizations that need to come together to create NPC. NPC’s value add will come from increasing awareness, streamlining communication and efforts, and being a liaison with Western governments and big pharmaceutical companies. To do this, NPC must employ people who have worked in top pharmaceutical companies and understand the fragmented and complicated landscape. This was crucial for Civica, as long-tenured pharmaceutical employees allowed them to work quickly and get the needed approvals.

Our proposed next steps are the following:

  • Recruit top talent with pharmaceutical backgrounds to create different task forces based on the five topics mentioned above.
  • Identify a target regional bloc of countries (e.g., ECOWAS) and initiate discussions with key public and private sector stakeholders within a prominent country in the bloc to test the model. This will provide valuable insights and help identify the feasibility of the demand aggregation model at first a national and then regional level.
  • Create a small group of countries to test this model out. Based on our interviews, this could be a regional block of countries, such as starting with the West.
  • For demand aggregation in this group of countries, work with the public and private sectors to understand needs.
  • NPC needs to start creating awareness of the need for pooled procurement.

Create a target list of local manufacturers on the continent that adhere to strict quality standards. Prioritizing manufacturers within the target regional bloc, begin conversations on how they can best collaborate with NPC. Eventually, NPC can be the liaison between these manufacturers and the buyers.


Word from the Editors

While the overall economy has become much more volatile in 2022, the U.S. health sector seems to be continuing on a course of escalating prices towards double-digit increases in commercial health insurance premiums. Healthcare price increases are contributing to increases in core inflation but may be resistant to efforts by the Federal Reserve to drive down inflation. Healthcare has always been counter-cyclical, suggesting that prices could remain high even if the overall economy is driven into a recession.

While some of the factors driving up the price of care are inputs costs, such as the nursing shortage elegantly described in this issue, other factors relate to an underlying business strategy of consolidation and market power. This issue of HMPI addresses some of these factors and their implications for consumers, providers, and care delivery.

Price transparency has been held out as an option for individual consumers to drive down costs, but in this issue we find that patients are under-educated about the opportunity for savings in the market, even in the wake of new federal price transparency rules.

Innovation has long been held out as a potential path forward to improve the value of healthcare for consumers. We have several perspectives on this challenge, from assessments of telehealth to a novel strategy for organizational innovation.

Most healthcare organizations lack meaningful feedback on performance. In this issue, we report on an innovative approach to text-mining of social media to provide more actionable feedback to care teams.

Rural health care was the theme of our 2022 BAHM student case competition, and in this issue we feature the competition’s winning presentation, which proposes to improve  healthcare in rural Oklahoma through a novel alliance structure across provider organizations. Our featured case also focuses on rural health, in this case a national digital health care strategy for India.

This issue also looks at the impact of COVID on population health – the use of state incentives to influence COVID-19 uptake in the U.S., as well as the impact of COVID on the care of some of most vulnerable patients, pediatric cancer patients.

In closing, I would like to thank the Ludy Family Foundation for their recent generous donation to HMPI. This gift will help us to continue to take on critical topics to inform decision-making in the global health sector, and at no cost to the authors.

And finally, thanks to you, our readers, for your continued support of our journal.

Kevin Schulman, MD, MBA
Acting Editor in Chief, Health Management, Policy and Innovation (HMPI)
President, Business School Alliance for Health Management (BAHM)
Professor of Medicine, Stanford University

Regi’s “Innovating in Health Care” Case Corner

Case: ACCESS Health India and the Ayushman Bharat Digital Mission (2022 | Case No. SM359 | Length 24 pages)

Authors: Kevin Schulman and Aditya Narayan, Stanford University

Background:

While India had made significant progress against diseases like polio and tetanus, the pandemic revealed marked differences in COVID-related illness and death among the country’s most vulnerable. Urban-rural and other societal divides added to long-time disparities in access to health care, and public resources could be overwhelmed.

Could a new national health plan and digital health mission allow India to innovate on health care, with the goal of creating high-quality affordable health care for all? This case explores a multi-stakeholder, collaborative approach to understanding and leveraging new technologies that could integrate a complex, fragmented health care system. This ambitious effort would involve harnessing mobile technologies and expanding broadband access to provide critical digital health solutions for India’s large rural population. And this effort would capitalize on best practices and lessons elsewhere in the digital health ecosystem—allowing India to leapfrog the shortcomings of national health information systems that had emerged elsewhere in the world.

Learning Objective:

This case is designed to help students understand the complex architecture and strategies involved in implementing digital health services to transform healthcare at the national level. Students will explore the progress and challenges in developing a comprehensive healthcare system in India, based on the latest advances in digital technology.

For inquires about obtaining the case, contact Stanford’s Case Writing Office.


Ignorance is Not Bliss: Discordant Beliefs and Preferences for Prices Among Healthcare Consumers in the United States

Austin J. Triana, Lauren A. Hatcher, Stefan Koester, Vanderbilt University School of Medicine; Dawn Iacobucci, Vanderbilt University Owen Management School of Business; Arthur B. Laffer, The Laffer Center; and R. Larry Van Horn, Vanderbilt University Owen Management School of Business

Contact: austin.j.triana@gmail.com

Abstract

What is the message? U.S. hospitals and insurers must publicly disclose the negotiated rates for healthcare services. However, U.S. consumers’ use of price transparency tools is low because of limited awareness and motivation. To better understand consumer attitudes, the authors conducted a survey that revealed a discrepancy between beliefs and preferences: While most Americans strongly prefer less expensive healthcare options, they do not see the value in shopping for care and underestimate the opportunity to save. The findings thus highlight an opportunity to educate patients about price variations and ways they can save.

What is the evidence? Primary data collected through an online survey administered to a census-matched sample of 1,539 Americans from December 15, 2021, to January 5, 2022.

Timeline: Submitted: August 14, 2022; accepted after review: September 23, 2022.

Cite as: Austin J. Triana, Lauren A. Hatcher, Stefan Koester, Dawn Iacobucci, Arthur B. Laffer, R. Larry Van Horn. 2022. Ignorance is Not Bliss: Discordant Beliefs and Preferences for Prices Among Healthcare Consumers in the United States. Health Management, Policy and Innovation (www.HMPI.org), Volume 7, Issue 3.

Appendix 1-3

Funding: This work was supported financially by the Vanderbilt Center for Healthcare Market Innovation and the 1065 Institute (the Laffer Center). Austin Triana received a stipend from the 1065 Institute as part of this work.

Conflict of interests: No other income derived from this work, and the authors have no potential conflicts of interest to disclose.

Ethics approval: This research was approved by the Vanderbilt University Institutional Review Board.

Introduction

Over the past decade, patient financial responsibility for healthcare has increased with a corresponding need for more transparency in price and quality for consumers.1,2 Three recent federal rules address this need. First, the Centers for Medicare and Medicaid Services (CMS) price transparency rule, effective January 1, 2021, requires hospitals to publicly disclose the negotiated rates for 300 “shoppable” services in a machine-readable file.3 Second, the No Surprises Act, effective January 1, 2022, establishes federal protection against surprise medical bills, requiring providers to deliver good-faith estimates for out-of-network medical care.4 Third, insurers are required to publicly disclose negotiated rates for in-network providers, effective July 1, 2022.5 Collectively, these three rules introduce a level of price visibility into healthcare markets that was previously opaque, with the hope of empowering patients to shop for low-cost, high-quality care.

With greater transparency, patients have become actors making choices with financial responsibility. Around 30% of American workers with insurance are on high-deductible plans.6 In addition, prices for the same service vary widely between different hospitals in the same city.7 Considering these factors, consumers could save a significant amount of money by shopping for medical care.8,9 However, several studies have shown low engagement with price transparency tools.10–14 Similarly, the usage of online quality tools remains low.2,15 The accessibility and reliability of these tools are highly variable, and the information contained within them is often incomplete.16 However, the low usage of these tools is likely multifactorial and is not well understood.

With low engagement, it appears that cost-sharing and comparison tools have had a limited impact in advancing consumer-driven healthcare.17 Empowering patients as consumers will require a deeper understanding of their perspective. If barriers to shopping are better understood, it may be possible for policymakers and healthcare organizations to better engage patients as consumers, allowing them to choose healthcare that best aligns with their own preferences. To fill these gaps, we assessed the attitudes, beliefs, and preferences of U.S. healthcare consumers using a multimodal survey. Our objective was to investigate and quantify barriers to consumer-driven healthcare in the United States in the setting of price transparency.

Methods

Study Design

This observational study was designed in two parts. In the first portion, demographic data was gathered, and respondents were asked in a survey about their attitudes and beliefs regarding healthcare utilization and prices. Using the Engel-Blackwell-Miniard Model, we assessed barriers at multiple stages of the consumer decision process, including awareness, motivation, information search, and comparison of alternatives.18

In the second portion of the study, we administered three discrete choice experiments (DCEs) to assess theoretical tradeoffs among respondents when purchasing healthcare. DCEs and choice-based conjoint analyses are commonly used to assess consumer preferences when making purchase decisions.19,20 In marketing, this approach is used to understand customer choices to determine the optimal price of a product for a given set of attributes. In the medical literature, this technique has been used extensively to understand preferences around intensive treatments, such as chemotherapy.21

We designed three separate DCEs to assess consumer preferences. In the first experiment, we asked respondents to choose a primary care provider for a routine visit or check-up based on their current state of health. In the second DCE, respondents were given a scenario in which they had severe knee pain and were asked to choose an imaging facility for an MRI of the knee. In the third DCE, female respondents were given a scenario in which they were pregnant and were asked to choose a hospital for the delivery. We studied these particular scenarios because the importance of several of the attributes was likely to vary, and we sought to test the relationships in multiple scenarios to improve external validity and generalizability.

For all three scenarios, our DCEs included four service attributes: price, quality, provider relationship, and convenience. The levels for each attribute are shown in Appendix 1. Prior work indicates that these four features heavily influence healthcare choices.20  In our experiments, price was described as the “out-of-pocket cost” for respondents. Healthcare prices can vary up to ten-fold between providers, so the out-of-pocket costs in these experiments reflect plausible price ranges that patients are often exposed to. 10,22–26 Quality was represented on a scale from one to five stars. We intentionally omitted a detailed description of quality to replicate the true experience that consumers face, as hospitals and providers are scored by many different rating agencies (including CMS, US News & World Report, Healthgrades, Yelp, Google, and others) on complex, nonstandard criteria. For example, the CMS star rating can reflect over 100 different individual quality measures.27 Convenience was represented by travel time from home, ranging from 15 to 90 minutes.

For the primary care and newborn delivery DCEs, three levels captured the provider relationship: 1) a doctor that you know, 2) a doctor that is recommended by a friend, and 3) a new doctor. For the knee MRI DCE, there were only two levels: 1) a facility that your doctor recommended and 2) a facility that you found online. We made this distinction because the physician usually does not interact with the patient during the imaging process, unlike a primary care visit or newborn delivery.

Participant population

This study received approval from our university’s institutional review board. Participants were recruited through CloudResearch Prime Panels, a survey fielding recruitment platform that aggregates several market research panels to ensure high-quality data collection.28 This method of recruitment enables data collection that is more representative of the U.S. population than other survey panels or microtask sites like MTurk. A total of 1,694 respondents completed the survey. Participants were excluded if they self-reported living outside the United States (n = 11), failed an attention check (n = 114), or sped through the survey questions at less than 30% of the median time (n = 30).29 The remaining 1,539 responses were distributed across the three DCEs as follows: 575 respondents in the primary care group, 540 respondents in the knee MRI group, and 424 respondents in the newborn delivery group. For the primary care and knee MRI groups, participants were at least 26 years old. In the newborn delivery group, all participants were females from 18 to 50 years old.

Survey Distribution and Data Collection

Data collection took place between December 15, 2021, and January 5, 2022. Once the survey was activated, respondents selected the job in the CloudResearch platform and were redirected to the survey. After completion, respondents were redirected back to the CloudResearch platform where they received credit and were paid $5.

Respondents were first asked about attitudes and beliefs regarding healthcare prices. Afterward for each DCE, respondents were given nine choice sets (or tasks) in which they had to choose one of three options (Appendix 2). Respondents were encouraged to pick the choice that best aligned with their own preferences for the scenario. In each task, respondents could select a fourth option if they would not choose any of the three options presented.

Sawtooth Software Lighthouse Studio, an application designed and validated for choice-based conjoint analysis, generated 300 permutations of the survey, each with nine tasks in which respondents had to choose one of three provider options.30 With this approach and a sample size of at least 400 respondents, the DCEs were powered for statistically significant main effects as well as interactions and subgroup analyses.31

Data Analysis

Data analysis was performed in Sawtooth software (version 9.13.1) and a statistical software package (R, version 4.0.1).

There are two common methods to analyze DCEs: multinomial logistic regression and hierarchical Bayes estimation.19 Despite different mathematical approaches, both methods estimate preferences based on observed choices among alternatives. In this study, both methods were used in the analysis.

First, multinomial logistic regression models were used to understand the marginal effect of choice attributes for the entire aggregated sample. The dependent variable was the consumer’s choice, and the independent variables were price, quality, convenience, and provider relationship. In the models, each of these input variables has a corresponding coefficient—also called a utility—which is a numerical score that reflects how much an input influences the consumer’s decision to choose a certain option.

After computing aggregate utilities for the entire sample, a hierarchical Bayes approach was used to estimate preferences for each respondent, as implemented by Sawtooth. In a hierarchical Bayes algorithm, individuals’ part-worth utilities are estimated two-fold with draws from a multivariate normal distribution in addition to a logit model. This introduces stochasticity that improves the accuracy of the final utility estimations and allows us to analyze the tradeoff preferences of each respondent.32 Once individuals’ part-worth utilities were calculated, it was possible to compare the importance of features by analyzing the differences in utility.30 Importance scores were calculated for each respondent, and respondents were grouped by their strongest preferences.

Results

A total of 1,539 respondents were analyzed. Most of the patients were female (69%) and white (72%) with a median age of 44 and a median household income of $44,000. Summary statistics with a comparison to the U.S. population are shown in Table 1.

Table 1: Demographic characteristics of survey respondents and representativeness of sample to U.S. population

Characteristic Survey respondents,

n = 1,539

US Populationa

n = 328,000,000

Median age 44 39
Median household income $44,000 $65,700
Gender
Female 69% 51%
Male 31% 49%
Raceb
White 72% 75%
Black 14% 14%
Asian 5% 6%
Hispanic or Latinx 13% 18%
Native American 2% 2%
Other 1% 6%
Educationc
Less than high school 4% 10%
High school graduate 28% 29%
Some college 36% 26%
4-year degree 22% 21%
Master’s degree or higher 11% 13%
Health Insurance
Uninsured 10% 9%
Medicaid 24% 18%
Medicare 25% 18%
Self-paid 8% 14%
Commercial 32% 54%

Source: Authors’ survey data, American Community Survey, United States Census. Notes: Data are expressed as median or %; aUS population data include children younger than 18; bCumulative percentage of race is greater than 100% because some respondents chose more than one race; cU.S. Population: educational attainment of adults aged 25 and older


We identified multiple barriers that likely obstruct shopping behavior in practice (Figure 1).

Figure 1: Attitudes and beliefs of survey respondents regarding prices and finances in healthcare

Source: Authors’ survey data. Notes: Respondents were given a five-point Likert scale (strongly disagree, somewhat disagree, neither agree nor disagree, somewhat agree, strongly agree).


Few respondents (24%) were aware that hospitals are required to publicly disclose prices for tests and treatments. Over half of respondents reported that they knew their insurance deductible, out-of-pocket maximum, and monthly premium, and 40% of respondents agreed that they did not have to compare prices for medical care because they had insurance. However, 40% of respondents agreed that they could save a significant amount of money by comparing prices for medical care. Only 32% of respondents reported knowing how to find prices for tests or treatments.

Respondents were asked to estimate the amount of price variation between providers within the same city (Figure 2).

Figure 2: Respondent expectations for price variation between hospitals in the same city

Most respondents (72%) expected price to vary less than 200% for the same test at two different hospitals in the same city. Nearly 15% of respondents expected price to vary up to 400%, and 13% of respondents expected price to vary more than 400% between hospitals.

Multinomial logistic regressions revealed the average marginal effects of each service attribute (Appendix 3). Across the three healthcare scenarios, respondents on average preferred providers who were less expensive, higher quality, more convenient, and more familiar. For all three DCEs, price was the most important variable for most respondents (59%), followed by quality (33%). Nearly all (93%) respondents preferred to pay less rather than more. Figure 3 shows that this finding was consistent in all three DCEs with some minor differences.

Figure 3: Feature Importance Analysis: Breakdown of respondents by which feature was most important in choosing a healthcare provider

Source: Authors’ discrete choice experiment data. Notes: Using individuals’ utility scores, it was possible to determine the most influential variable for each respondent. Overall, price was the most important variable for most respondents.

For a knee MRI, price was most important for 67% of respondents, more than double the number for which quality was most important (30%). For a newborn delivery, price was most important for 51% of respondents, slightly more than quality (42%). In all three DCEs, convenience and provider relationship were the most important factors for less than 10% of respondents.

Discussion

There has been a prevailing narrative that patients cannot or will not shop for medical care. Prior studies have shown that price information alone is important but unlikely to reduce patients’ spending.10,17,24 However, our study is unique in that we have quantified and compared prior beliefs with experimental behavior.

First, like other studies, we have shown that consumer-driven behavior is impacted by barriers at multiple levels: awareness, motivation, self-efficacy, health literacy, and technology literacy.33,34 Awareness of publicly available prices is a major hindrance, with less than a quarter of respondents knowing that hospitals are required to publicly disclose prices. However, it appears that awareness is rapidly improving, increasing from 9% to 25% in less than a year.35

In addition to awareness, we identified multiple factors influencing motivation to shop for care. Nearly half of the respondents felt that they did not need to shop for care because they had insurance. This is surprising given the prevalence of insurance plans with cost-sharing mechanisms. In other words, consumers feel protected by insurance and do not see the benefit of shopping for care. Similarly, 60% of respondents do not agree that they could save a significant amount of money by shopping for care. A large majority of respondents underestimated the amount of price variation between providers.

Regarding healthcare prices, ignorance is not bliss. Consumers do not feel motivated to shop for care, yet they could be significantly better off by shopping for care. It has been shown that healthcare prices regularly vary up to ten-fold between providers.7,22,36  Less than 15% of respondents are aware of this degree of price variation.

However, when respondents were shown this price variation experimentally in the DCEs, most respondents became price sensitive: Price was the most important factor for most consumers (59%), more so than quality, convenience, and the provider relationship. This experimental finding demonstrates discordant prior beliefs and demonstrated preferences among healthcare consumers. While most respondents were not aware of the degree of price variation, they reacted strongly to the information experimentally. When patients are given complete information that is easy to understand, they make economic trade-offs according to their own preferences, as they would when shopping for other goods and services outside of healthcare. Just as when shopping for milk or automobiles, patients can make rational choices if they can access the relevant information.

In our research, we also built upon the existing literature. Prior studies have shown mixed results in understanding the healthcare purchasing process. Some studies have shown that quality is more important to consumers than price.37,38 As we have replicated, other studies have shown the opposite.39 These contradictory findings are the result of different study samples and designs. More importantly, we have highlighted something that is actionable. Consumers are not aware of price transparency and price variation, yet their experimental behavior indicates that they would find this information highly valuable. Thus, patients with financial responsibility may start acting as price shoppers if they understood the potential benefit.

Limitations     

One limitation is that the study sample was not perfectly representative of the U.S. population, potentially limiting generalizability. By design, we created one DCE for women’s health; thus, the sample was skewed with more women than men. As discussed earlier, we believe this design improves generalizability, as our findings in Exhibit 4 were consistent across samples from different populations. However, in the future, it would be reasonable to include another DCE for men’s health to investigate how trade-offs apply for gender-specific healthcare. In addition, the study sample had a lower median income than that of the US population. It is likely that online workers tend to be more price sensitive than the average American, possibly confounding the study results.

Another limitation of this study is that respondents were not seeking care at the time of the survey. In other words, these were not real patients facing real healthcare decisions. It is possible that their preferences would be different when faced with these decisions outside of a research setting. This may be particularly important for patients with existing physician relationships, as they may value continuity of care and the provider relationship even more.

An additional limitation is that we did not collect data on survey interpretation and understanding. It is possible that some respondents did not completely understand the tasks, levels, or features, and that their choices did not reflect their true preferences. In addition, survey fatigue could have contributed to data noise. Furthermore, one weakness of DCEs is that the results are dependent on the design of the experiment. While the price levels in this study were evidence-based, the importance scores are thus in part related to the range of price levels. If this study were repeated with different price ranges, the importance scores may differ.

Conclusion

There have been great advancements toward consumer-driven healthcare in recent years, particularly in price transparency. Most patients value low prices more than quality, convenience, or provider relationship when purchasing health care. However, there are multilevel barriers that impede consumer-driven healthcare and price shopping behavior. Notably, consumers are not aware of the degree of price variation between healthcare providers.

This research highlights an unprecedented opportunity for policymakers and healthcare organizations to focus on consumer motivation. Most consumers are highly price sensitive, preferring lower prices. If consumers understand the amount of price variation between healthcare providers, a significant number of patients may become price shoppers, using price and quality comparison tools to realize savings in out-of-pocket costs.

As data and technology continue to improve, it is vital to enable patients as informed decisionmakers. Further research can build on this work by understanding barriers to consumer-driven healthcare, exploring interventions to empower patients as consumers, and investigating how patients make trade-offs in practice.

Appendix 1-3

References

  1. Taylor K. Embracing and Advancing the Consumerist Era in Healthcare. Front Health Serv Manage. 2019;36(2):15-25.
  2. Consumer Preferences and Online https://www.hsr.org/node/453119Comparison Tools Used to Select a Surgeon. JAMA Surgery. Accessed March 10, 2022. https://jamanetwork.com/journals/jamasurgery/fullarticle/2595025 
  3. New Year, New CMS Price Transparency Rule For Hospitals. Health Affairs. Accessed March 10, 2022. https://www.healthaffairs.org/do/10.1377/forefront.20210112.545531/full/
  4. Dec 10 KPP, 2021. No Surprises Act Implementation: What to Expect in 2022. KFF. Published December 10, 2021. Accessed July 19, 2022. https://www.kff.org/health-reform/issue-brief/no-surprises-act-implementation-what-to-expect-in-2022/
  5. Trump Administration Finalizes Transparency Rule For Health Insurers. Health Affairs. Accessed July 19, 2022. https://www.healthaffairs.org/do/10.1377/forefront.20201101.662872
  6. Nov 10 P, 2021. 2021 Employer Health Benefits Survey – Summary of Findings. KFF. Published November 10, 2021. Accessed July 19, 2022. https://www.kff.org/report-section/ehbs-2021-summary-of-findings/
  7. Kliff S, Katz J, Taylor R. Hospitals and Insurers Didn’t Want You to See These Prices. Here’s Why. The New York Times. https://www.nytimes.com/interactive/2021/08/22/upshot/hospital-prices.html. Published August 22, 2021. Accessed July 19, 2022.
  8. Does Enrollment in High‐Deductible Health Plans Encourage Price Shopping? HSR. Accessed July 19, 2022.
  9. Association of a national insurer’s reference‐1based pricing program and choice of imaging facility, spending, and utilization. HSR. Accessed July 19, 2022. https://www.hsr.org/node/57048
  10. Chernew M. Are Health Care Services Shoppable? Evidence from the Consumption of Lower-Limb MRI Scans. National Bureau of Economic Research; 2018.
  11. Desai SM, Hatfield LA, Hicks AL, Chernew ME, Mehrotra A, Sinaiko AD. What are the potential savings from steering patients to lower-priced providers? a static analysis. Am J Manag Care. 2019;25(7):e204-e210.
  12. Whaley CM, Vu L, Sood N, Chernew ME, Metcalfe L, Mehrotra A. Paying Patients To Switch: Impact Of A Rewards Program On Choice Of Providers, Prices, And Utilization. Health Aff (Millwood). 2019;38(3):440-447. doi:10.1377/hlthaff.2018.05068
  13. Patterns of Use of a Price Transparency Tool for Childbirth Among Pregnant Individuals With Commercial Insurance. JAMA Network Open. Accessed March 10, 2022. https://jamanetwork.com/journals/jamanetworkopen/fullarticle/2783178
  14. Mehrotra A, Dean KM, Sinaiko AD, Sood N. Americans Support Price Shopping For Health Care, But Few Actually Seek Out Price Information. Health Aff Proj Hope. 2017;36(8):1392-1400. doi:10.1377/hlthaff.2016.1471
  15. Public Awareness, Perception, and Use of Online Physician Rating Sites | Health Care Quality. JAMA. Accessed March 10, 2022. https://jamanetwork.com/journals/jama/fullarticle/1829975
  16. Berkowitz ST, Siktberg J, Hamdan SA, Triana AJ, Patel SN. Health Care Price Transparency in Ophthalmology. JAMA Ophthalmol. 2021;139(11):1210-1216. doi:10.1001/jamaophthalmol.2021.3951
  17. Desai SM, Shambhu S, Mehrotra A. Online Advertising Increased New Hampshire Residents’ Use Of Provider Price Tool But Not Use Of Lower-Price Providers. Health Aff (Millwood). 2021;40(3):521-528. doi:10.1377/hlthaff.2020.01039
  18. Gordon D, Ford A, Triedman N, Hart K, Perlis R. Health Care Consumer Shopping Behaviors and Sentiment: Qualitative Study. J Particip Med. 2020;12(2):e13924. doi:10.2196/13924
  19. Lancsar E, Louviere J. Conducting discrete choice experiments to inform healthcare decision making: a user’s guide. PharmacoEconomics. 2008;26(8):661-677. doi:10.2165/00019053-200826080-00004
  20. Eline M. van den Broek-Altenburg P, Adam J. Atherly P. Patient Preferences for Provider Choice: A Discrete Choice Experiment. Am J Manag Care. 2020;26(7):e219-e224. Published online July 15, 2020. Accessed March 10, 2022. https://www.ajmc.com/view/patient-preferences-for-provider-choice-a-discrete-choice-experiment
  21. Norman R, Anstey M, Hasani A, Li I, Robinson S. What Matters to Potential Patients in Chemotherapy Service Delivery? A Discrete Choice Experiment. Appl Health Econ Health Policy. 2020;18(4):589-596. doi:10.1007/s40258-020-00555-y
  22. The Transformative Potential for Price Transparency in Healthcare: Benefits for Consumers and Providers. HMPI. Published December 9, 2019. Accessed July 19, 2022. https://hmpi.org/2019/12/09/the-transformative-potential-for-price-transparency-in-healthcare-benefits-for-consumers-and-providers/
  23. What do we know about people with high out-of-pocket health spending? Peterson-KFF Health System Tracker. Accessed March 10, 2022. https://www.healthsystemtracker.org/chart-collection/know-people-high-pocket-spending/
  24. Saloner B, Polsky D, Kenney GM, Hempstead K, Rhodes KV. Most Uninsured Adults Could Schedule Primary Care Appointments Before The ACA, But Average Price Was $160. Health Aff Proj Hope. 2015;34(5):773-780. doi:10.1377/hlthaff.2014.1258
  25. Glass DP, Kanter MH, Jacobsen SJ, Minardi PM. The impact of improving access to primary care. J Eval Clin Pract. 2017;23(6):1451-1458. doi:10.1111/jep.12821
  26. Mehrotra A, Huckfeldt PJ, Haviland AM, Gascue L, Sood N. Patients Who Choose Primary Care Physicians Based On Low Office Visit Price Can Realize Broader Savings. Health Aff Proj Hope. 2016;35(12):2319-2326. doi:10.1377/hlthaff.2016.0408
  27. Overall hospital quality star rating. Provider Data Catalog. Accessed March 10, 2022. https://data.cms.gov/provider-data/topics/hospitals/overall-hospital-quality-star-rating/
  28. Chandler J, Rosenzweig C, Moss AJ, Robinson J, Litman L. Online panels in social science research: Expanding sampling methods beyond Mechanical Turk. Behav Res Methods. 2019;51(5):2022-2038. doi:10.3758/s13428-019-01273-7
  29. Greszki R, Meyer M, Schoen H. The impact of speeding on data quality in nonprobability and freshly recruited probability-based online panels. Online Panel Research. John Wiley & Sons, Ltd; 2014:238-262. doi:10.1002/9781118763520.ch11
  30. Lighthouse Studio Help. Accessed July 19, 2022. https://sawtoothsoftware.com/help/lighthouse-studio/manual/index.html?hid_web_getstart.html
  31. de Bekker-Grob EW, Donkers B, Jonker MF, Stolk EA. Sample Size Requirements for Discrete-Choice Experiments in Healthcare: a Practical Guide. The Patient. 2015;8(5):373-384. doi:10.1007/s40271-015-0118-z
  32. CBC/HB Technical Paper (2009). Accessed July 19, 2022. https://sawtoothsoftware.com/resources/technical-papers/cbc-hb-technical-paper
  33. Whaley C, Schneider Chafen J, Pinkard S, et al. Association between availability of health service prices and payments for these services. JAMA. 2014;312(16):1670-1676. doi:10.1001/jama.2014.13373
  34. Gourevitch RA, Desai S, Hicks AL, Hatfield LA, Chernew ME, Mehrotra A. Who Uses a Price Transparency Tool? Implications for Increasing Consumer Engagement. Inq J Med Care Organ Provis Financ. 2017;54:46958017709104. doi:10.1177/0046958017709104
  35. Jun 28 P, 2021. Poll: Few are Aware of Hospital Price Transparency Requirements. KFF. Published June 28, 2021. Accessed March 10, 2022. https://www.kff.org/health-costs/press-release/poll-few-are-aware-of-hospital-price-transparency-requirements/
  36. Oseran AS, Ati S, Feldman WB, Gondi S, Yeh RW, Wadhera RK. Assessment of Prices for Cardiovascular Tests and Procedures at Top-Ranked US Hospitals. JAMA Intern Med. 2022;182(9):996. doi:10.1001/jamainternmed.2022.2602
  37. Schwartz AJ, Yost KJ, Bozic KJ, Etzioni DA, Raghu TS, Kanat IE. What Is The Value Of A Star When Choosing A Provider For Total Joint Replacement? A Discrete Choice Experiment. Health Aff (Millwood). 2021;40(1):138-145. doi:10.1377/hlthaff.2020.00085
  38. Manik R, Carlos RC, Duszak R, Sadigh G. Costs Versus Quality in Imaging Examination Decisions. J Am Coll Radiol JACR. 2022;19(3):450-459. doi:10.1016/j.jacr.2021.11.015
  39. Mühlbacher AC, Bethge S, Reed SD, Schulman KA. Patient Preferences for Features of Health Care Delivery Systems: A Discrete Choice Experiment. Health Serv Res. 2016;51(2):704-727. doi:10.1111/1475-6773.12345


Improving Patient Satisfaction by Monitoring Hospital Service Quality

Steven G. Ullmann and Joseph Johnson, Miami Herbert Business School; Shaan Khosla, New York University; Jessica R. Griff, University of Miami Miller School of Medicine and Miami Herbert Business School; Sedona R. Webb, University of Miami School of Nursing and Miami Herbert Business School. 

Contact: sullmann@bus.miami.edu

Abstract

What is the message: Improving patient satisfaction is a key outcome sought by U.S. hospitals. Hospitals closely monitor and seek improvements to increase their patient satisfaction scores. However, merely monitoring and measuring standardized patient satisfaction scores does not improve patient satisfaction at a given hospital. Satisfaction can only improve if we monitor and measure the underlying drivers of satisfaction.

What is the evidence: The authors developed a method using social media data and text-mining algorithms to monitor service quality – the underlying driver of satisfaction.

Timeline: Submitted: June 9, 2022; accepted after review: September 22, 2022.

Cite as: Steven G. Ullmann, Joseph Johnson, Shaan Khosla, Jessica R. Griff, Sedona R. Webb. 2022. Improving Patient Satisfaction by Monitoring Hospital Service Quality. Health Management, Policy and Innovation (www.HMPI.org), Volume 7, Issue 3.

Introduction

U.S. hospitals seek to attract new patients as well as build patient loyalty through constant improvement of patient services. To facilitate these objectives, the Hospital Consumer Assessment of Healthcare Providers Survey (HCAHPS) has standardized the evaluation of patient satisfaction, which we term PSAT, after hospitalization through its 29-item questionnaire.  These publicly reported PSAT scores are now integrated into the reimbursement framework by the Center for Medicare and Medicaid Services to encourage value-based care for patients. Private insurers also use PSAT measures to negotiate reimbursement contracts with hospitals. These reports have incentivized hospitals to closely monitor and seek improvements in their PSAT scores.1 However, merely monitoring standardized satisfaction scores provided by outside agencies does not improve satisfaction at a given local hospital. To improve satisfaction, we need to ascertain the underlying drivers of satisfaction relevant to each hospital and then measure those drivers to improve satisfaction scores for a given hospital.  This is the goal of our paper.

Understanding the drivers of patient satisfaction is critical to creating solutions. Research in the consumer satisfaction literature shows that two fundamental drivers of satisfaction are: perceived quality of the product or service, and the price paid.2 Consumers weigh the quality of the offer against the price they have to pay to determine the value they receive.3 Similarly, in healthcare, perceived quality is driven by the quality of services as perceived by patients. This can include aspects such as perceived adequacy of time spent with physicians and having questions answered. The second determinant of patient satisfaction is perceived value, which becomes muddied in the healthcare setting due to a complex network of payers (government, employer, or individual) and fiscal intermediaries (insurers). As it currently stands, many patients do not know the true cost of their treatment, nor their actual financial responsibility, until after they leave the hospital.

Although the HCAHPS does measure some dimensions of service quality, several limitations of the current method make it unsuitable for measuring service quality dimensions. One issue with the current standardized satisfaction measures is that they do not identify the service quality components relevant to each individual hospital. Second, the HCAHPS measures are not specific enough to enable actionable policies and procedures. Different service dimensions may be prioritized differently for different hospitals. Third, the non-response bias inherent in the survey method used for HCAHPS can yield unreliable metrics. The non-response bias occurs when survey participants ignore survey requests. Patients, or their friends and family, are more likely to respond when they have negative feedback to share.4 Fourth, respondents are confined to the specific questions in the survey and cannot express themselves outside the confines of survey questions. Fifth, there is a considerable delay between the time of survey administration and the reporting of the findings.5 This delay makes it difficult to take timely corrective action. Relatedly, surveys are sent out on a predetermined calendar schedule. This makes it hard to detect service quality problems at the time when they occur.  Further, surveys impose a huge cost on hospitals.6

One workaround to the limitations posed by surveys is to use online data. With an increased reliance on real-time online ratings for making healthcare-related decisions, recent literature has analyzed online ratings and comments, and how that data can be efficiently used to supplement traditional surveys like the HCAHPS. Also, text data from social media is a promising alternative to survey data. Social media data is spontaneous, abundant, geographically spread out, less costly than surveys, and shared in real time. Scholars have already used such data to measure patient satisfaction. However, the technique used for satisfaction metrics known as Latent Dirichlet Allocation (LDA) does not suit our goal of measuring service quality for the following reasons: first, LDA is best suited to extract topics from a given corpora, not to measure how much of a given topic is present in a corpus. Second, once topics are extracted, we need subject matter experts to manually label the topics. Finally, LDA does not provide an indication as to whether the topics are toned negatively or positively.

In contrast to LDA, we seek to accomplish the opposite, namely, determining how much of a pre-specified topic (a dimension of service quality) is contained in a corpus. Additionally, we want to ascertain if the text is positive or negative. To achieve these goals, we propose an approach based on natural language processing techniques. First, we consult with personnel from a given hospital to establish the service quality dimensions that are important to them and create lexicons that describe each quality dimension. For example, in our empirical application we consulted with a large Southeastern hospital and developed lexicons for six service dimensions. Second, we accessed social media data from the hospital’s Twitter handle and Facebook page. Third, we developed an algorithm that classifies each sentence collected from the social media data and assigned it to one of the six dimensions of quality.  Fourth, we employed another algorithm to quantify the degree of positive or negative sentiment for each of the six dimensions and thereby quantify how well the healthcare provider is performing on those dimensions. We found that, using our approach, hospitals can measure how well they perform on different service quality dimensions. Further, our approach provides time series plots of service dimensions allowing the hospital to use it as control charts for service quality oversight and appropriate adjustments in their processes.

As such, we make three contributions to the healthcare measurement literature. First, we show how to derive service quality measures for individual hospitals. Second, by going beyond topic analysis, we extend the text-mining literature in healthcare. In particular, we show how to measure the amount of information contained in social media for a specific topic and the sentiment strength and positivity or negativity expressed at a given time for that topic. Hospital administrators can use our proposed approach for real-time tracking of service quality and use the information to make continuous changes that align with their goals. They can go beyond tracking service quality and track the feedback to their branding within a relevant geographic market. The remainder of the paper consists of three parts. In the next section, we discuss our method in detail. In the second section, we discuss our data and present our results. In the final section, we conclude the paper with a discussion of our findings.

Method

In this section, we explain our data, method, and results. Our data collection began with interviews of hospital administrators who were asked about the service dimensions that constituted their hospital’s service quality. They identified six service dimensions:

  1. General access
  2. Facilities and environment
  3. Billing and insurance
  4. Physicians
  5. Clinical staff
  6. Non-clinical staff

“General access” is the service dimension that refers to timeliness of care through timely scheduling, admissions, discharge, and transfer to and from other facilities. “Facilities and environment” refers to the parking facilities, location of hospital, noise level, lighting, cleanliness, comfort of ancillary facilities like waiting rooms, food services, gift shop and security. “Billing and insurance” refers to billing and pricing issues.  The dimension “Physicians” refers to the services and care physicians provide. The dimension “Clinical staff” relates to the service elements provided by nurses, therapists and other clinical technicians. The dimension “Non-clinical staff” refers to the services provided by other non-direct-care-related staff.

Each dimension is also composed of multiple underlying subdimensions which we call attributes. For example, the “Facilities and environment” category had the attributes of security, parking, noise, location, lighting, gift shop, food services, brochures, comfort, and cleanliness. As in the case of the broad dimensions, we obtained descriptions for the attributes.  Then, for each of the dimensions and attributes we extracted the nouns from the description provided. The set of nouns formed our lexicons, which we used to analyze the social media data. We next discuss how we sourced social media data.

Data

We gathered posts and tweets from Facebook and Twitter respectively for the 27-week period from the 23rd week of 2020 to the 49th week of 2020. We selected Facebook and Twitter as our data sources for three reasons. First, these are the most widely used social media platforms by people and companies. Of the roughly 3,200 social media accounts owned by the Fortune 100 companies, about 50% are Facebook accounts, and 30% are Twitter accounts. The second reason for selecting Facebook and Twitter is that they have different demographic users. For example, Twitter has more male users than female users, while Facebook has a balanced gender distribution of users. Lastly, the nature of text varies across platforms. Twitter imposes strict limits to the amount of text that can be written in a “tweet” compared to what can be written in a Facebook post. There are also differences in syntactic and grammatical structure across platforms. Facebook has more topics per post than Twitter has for tweets. Twitter has more concise text than others. Hence aggregating text across these social media platforms is essential. Although it is possible to retrieve posts and tweets using application program interfaces, we were provided the necessary data by the hospital via a third-party vendor named Avatar. Table 1 provides a sample of our data. The first column in Table 1 contains the post, the second contains the words in the post, the third is the cumulative sentiment score of the words, the fourth is the highest similarity score between the words of the post and the words of the different service dimensions and the fifth names the corresponding service dimension

Table 1: Example of Tweets and Calculations and Classification

Feedback Tokenized Words Sentiment Strength Similarity Service Dimension
Dr. Parekh has an excellent “”bedside manner””: she listens, answers questions clearly, explains what my medical situation is and how we are going to deal with it. She is warm and caring.”
Bad billing bad ethics bad experience no help” [‘bad’, ‘billing’, ‘bad’, ‘ethics’, ‘bad’, ‘experience’, ‘help’] -1 0.519 Billing And Insurance
Excellent institution. Best doctors and nurses. Great attention to the patient’s well-being.” [‘excellent’, ‘institution’, ‘best’, ‘doctors’, ‘nurses’, ‘great’, ‘attention’, ‘patient’, ‘well’] 2 0.483 General Feedback For Clinical Staff

Table 2 shows, for each of the six service dimensions, the mean score, the standard deviation and the count of sentences used to derive the mean and standard deviation. We find that the service dimension “Clinical Staff” has the highest mean, signifying this is where the institution is doing well. The lowest score is for “Billing and Insurance,” reflecting that this is where the institution is perceived to be doing poorly. Importantly, the variance around the mean is large for all dimensions signifying that consistency of said service has not been achieved.

Table 2: Descriptive Statistics

Service Dimension      Mean Score Std_Dev     Count
General Access -0.033 0.491 388
Facilities and Environment 0.093 0.376 604
Billing and Insurance -0.087 0.401 512
Physicians 0.026 0.431 840
Clinical Staff 0.130 0.472 1549
Non-Clinical Staff -0.058 0.481 331

The results in Table 2 give a time-aggregated picture of the service that the hospital provides and does not indicate whether the services were trending upward, downward or level during the analysis period. To do so, we need to analyze how the services changed over time. We do not find any systematic upward or downward trend in the time series plots for most of the service dimensions. This signifies that the service dimensions remained stable through our sample period.  In some cases, like the services of the non-clinical staff, we observe changes in the variance over time. One exception to the stable service time trend is the services provided by nurses over time. We see a marginal downward trend in nurse services over the sample period. Importantly, the variance for nurse services increases over time. Further, the increasing variance coincides with declining services. We conjecture that the COVID crisis may have contributed to the decline in nurses’ services.

Conclusion

Patient satisfaction is a crucial outcome of healthcare service. Insurance reimbursements to providers are partially dictated by PSAT scores. However, merely measuring PSAT does not help hospitals improve the services they provide. To improve PSAT, we must monitor aspects of service quality that are the operational drivers of PSAT. Further, unlike current PSAT measurements which are done at specific time periods, we need real-time or at least near-real-time measurements of service quality dimensions for it to benefit hospitals. Such near-real-time measurements will be sensitive to changes in quality levels. Also, we cannot rely on the conventional survey technique to monitor services because running services continually is impractical and cost prohibitive. Finally, standardized surveys do not account for differences in service quality dimensions that could arise across geographic locations.

In this paper, we provided a method that overcomes several of the limitations described previously by using managerial input to develop the relevant service quality metrics for a given hospital. We then developed a natural language-based algorithm and used it on social media data to measure and monitor the service dimensions for the hospital. We contributed to both the theory of PSAT measurement as well as the methodology in practice. Regarding theory, our approach shows how to extract service quality as a distinct construct separate from PSAT. For practitioners, we develop a tool that they can use to monitor the service quality their institutions deliver.

Discussion

A notable feature of our research is the collection and analysis of the abundant social media text data to track the quality of hospital service. Taken together, the positive means in Table 2 for facilities, clinical staff and physicians show that the hospital we analyzed does a better job in these service dimensions compared to general access, billing and non-clinical staff service. The hospital can take these findings and initiate process improvements. At a minimum, the findings can serve as inputs into Plan-Do-Study-Act (PDSA) cycles to gain insight into problem areas. For example, physicians can improve service quality by increasing the time spent with patients or through better communication protocols.  As for nurses, their area of improvement was pain management, which may not be fully under the control of nurses. Pain management is now one of the more difficult aspects of medical care to treat and monitor given the significant sensitivity to opiate addiction. The non-clinical staff at the hospital need to improve their listening skills.

We found that patients thought that the noise levels at the hospital were too high. The adverse health effects of noise on patients who are receiving treatments and undergoing recovery are well documented.15 Exposure to high levels of noise disrupts sleep and therefore has negative healing effects for patients. Also, patients using earplugs (to reduce noise effects) in the intensive care unit (ICU) had lowered incidence of confusion — a key symptom of delirium.16 Also, a nocturnal sound-reduction protocol in the ICU found that the incidence of delirium was significantly reduced after the implementation of the protocol.17  The U.S. Environmental Protection Agency recommends sound levels should not exceed 45 dB in hospitals.  However, many reports have shown hospital noise levels to be well above this recommendation.

Another service aspect the hospital is weak in is related to insurance coverage and financial implications. This could be a function of the type of patients that the hospital attends to. The complex third-party payer system that we have adopted in the United States may exacerbate the frustration that patients have with billing and insurance. The attributes that scored lowest include price transparency, payment options, and insurance coverage. The dissatisfaction with these attributes is not surprising, considering healthcare costs are usually retroactive, received after discharge, sometimes months later, leading to confusion, surprise costs, and perhaps even catastrophic costs if a patient accidentally sees a provider outside of their insurance network. It also reflects the significant focus on the need for price transparency in healthcare.

In a secondary analysis we wanted to assess the overall patient care the hospital was delivering. As in our previous analyses, we began with descriptive phrases of what the hospital administrators considered overall patient care as determined by interviews with patients. Using the same data source as for our main analysis, we found 1,914 sentences pertaining to the patient care delivered by the hospital. This dimension has 10 underlying attributes. The hospital scores positive on six of the 10. The most positive score is for the attribute “loyalty” and the most negative is for the “length of stay” attribute.   

Figure 1 shows the time trend of overall patient care. We find that the overall patient care is stable over the portion of the graph spanning weeks 23 to 32, after which we find a marginal decline. The latter part of this decline coincides with the declining nurse services of the hospital. The variance of the patient care score is stable over time (Figure 1). The figure also reflects that health care organizations are designed to produce the results they achieve. The lack of statistical variation in scores is important; managers shouldn’t chase changes in mean scores, when there is no difference between periods, as changes in the means are noise.

Figure 1: Time Trend for Overall Patient Care

The overall level of patient care shows, that while patients find value in the services that they receive from the hospital, they find problems with the length of stay, pain management, side effects of medications, and follow-up care. Of these, length of stay may be partially under the control of the hospital. The positive loyalty score shows that patients are loyal to the hospital despite the negative scores.

In summary, we find that there are a significant number of service-quality dimensions that are under the hospital’s operational control while there are some, such as side effects of medications, where managed control is more limited. The high variance we see in both the aggregate and temporal analysis is customary in service industries. This is because services, unlike product quality, are delivered by people at the point of consumption.

Implications. The main implication of our study is that the data and analysis we show can form the input of a PDSA cycle. Using time-series graphs as shown in Figure 1, hospitals can identify problems in specific areas when they occur. Then, health system administrators can determine underlying causes of the problems and devise interventions. One example is to test interventions, such as changing staffing ratios, to see the effects on service quality.

Such an approach can provide the data needed for gap analysis where the hospital can ascertain the gap between what they plan to deliver and what they deliver. Further, by examining the attributes that patients really care about, hospital administrators can find out if there are service dimensions that they need to monitor but are not currently doing so.

Future research. Our study provides several avenues for extensions and further research. First, individual hospitals need to set acceptable and achievable levels for each of the service dimensions. Second, researchers can use our approach to initiate a PDSA cycle for different service dimensions and develop a scoring system that helps them track service quality. 18  Third, researchers can study how the improving levels of service increase repeat patient visits and patient retention, which in turn will increase the customer lifetime value of patients. Finally, the variance around the means in Figure 1 implies that much of the feedback is noise and organizations must act only after statistically validating the inputs from our system with external measures of satisfaction, such as PSAT.


References

  1. Glickman SW, Boulding W, Manary M, et al. Patient satisfaction and its relationship with clinical quality and inpatient mortality in acute myocardial infarction. Circ Cardiovasc Qual Outcomes. 2010;3(2):188-195.
  2. Fornell C, Johnson MD, Anderson EW, Cha J, Bryant BE. The American customer satisfaction index: nature, purpose, and findings. Journal of marketing. 1996;60(4):7-18.
  3. Mittal V, Kamakura WA, Govind R. Geographic patterns in customer service and satisfaction: An empirical investigation. Journal of Marketing. 2004;68(3):48-62.
  4. Tyser A, Abtahi A, McFadden M, Presson A. Evidence of non-response bias in the Press-Ganey patient satisfaction survey. BMC health services research. 2016;16(1):1-6.
  5. Ranard BL, Werner RM, Antanavicius T, Schwartz HA, Smith RJ, Meisel ZF, et al. Yelp reviews of hospital care can supplement and inform traditional surveys of the patient experience of care. Health Affairs. 2016;35(4):697-705.
  6. Jordan H, White A, Joseph C, Carr D. Costs and benefits of HCAHPS: final report. Cambridge, MA: Abt Associates Inc. 2005.
  7. Chakraborty S, Church EM. Social media hospital ratings and HCAHPS survey scores. Journal of health organization and management. 2020;34(2):162-72.
  8. Campbell L, Li Y. Are Facebook user ratings associated with hospital cost, quality and patient satisfaction? A cross-sectional analysis of hospitals in New York State. BMJ Quality & Safety. 2018;27(2):119-29.
  9. Timian A, Rupcic S, Kachnowski S, Luisi P. Do patients “like” good care? Measuring hospital quality via Facebook. American journal of medical quality. 2013;28(5):374-82.
  10. Bardach NS, Asteria-Peñaloza R, Boscardin WJ, Dudley RA. The relationship between commercial website ratings and traditional hospital performance measures in the USA. BMJ quality & safety. 2013;22(3):194-202.
  11. Greaves F, Laverty AA, Cano DR, Moilanen K, Pulman S, Darzi A, et al. Tweets about hospital quality: a mixed-methods study. BMJ quality & safety. 2014;23(10):838-46.
  12. Greaves F, Pape UJ, King D, Darzi A, Majeed A, Wachter RM, et al. Associations between Internet-based patient ratings and conventional surveys of patient experience in the English NHS: an observational study. BMJ quality & safety. 2012;21(7):600-5.
  13. Glover M, Khalilzadeh O, Choy G, Prabhakar AM, Pandharipande PV, Gazelle GS. Hospital evaluations by social media: a comparative analysis of Facebook ratings among performance outliers. Journal of general internal medicine. 2015;30(10):1440-6.
  14. Brown SW, Swartz TA. A gap analysis of professional service quality. Journal of marketing. 1989;53(2):92-8.
  15. Cristensen M. The physiological effects of noise: considerations for intensive care. Nursing in Critical Care. 2002;7(6):300-5.
  16. Rompaey BV, Elseviers MM, Drom WV, Fromont V, Jorens PG. The effect of earplugs during the night on the onset of delirium and sleep perception: a randomized controlled trial in intensive care patients. Critical Care. 2012.16:R3.
  17. Pol VI, Iterson MV, Maaskant J. Effect of nocturnal sound reduction on the incidence of delirium in intensive care unit patients: An interrupted time series analysis. The effect of earplugs during the night on the onset of delirium and sleep perception: a randomized controlled triel in intensive care patients. Intensive and Critical Care Nursing. 2017.18-25.
  18. Glickman SW, Boulding W, Roos JM, Staelin R, Peterson ED, Schulman KA. Alternative pay-for-performance scoring methods: implications for quality improvement and patient outcomes. Med Care. 2009;47(10):1062-1068.


Improving Healthcare Productivity by Using Technology Strategically

David Scheinker, Clinical Excellence Research Center, Stanford University, and Roger E. Bohn, Clinical Excellence Research Center, Stanford University, and University of California San Diego

Contact: dscheink@stanford.edu

Abstract

What is the message? Hospitals are facing a growing workforce crisis fueled by staff burnout and less time for patient care as providers spend more of their day interfacing with the time-consuming electronic medical records (EMR). Software as a service (SaaS) has driven significant productivity gains across numerous industries and in hospitals, SaaS is used from revenue management to employee scheduling. Healthcare technology innovation strategies that expand the use of SaaS to both redesign workflows and ensure technical integration with the EMR, could increase productivity and help mitigate workforce challenges.

What is the evidence? The authors analyze existing EMR-integrated decision-support tools and illustrate the benefits of a provider-focused approach.

Timeline: Submitted: , 2022; accepted after review: , 2022.

Cite as: David Scheinker, Roger E. Bohn. 2022. Improving Healthcare Productivity by Using Technology Strategically. Health Management, Policy and Innovation (www.HMPI.org), Volume 7, Issue 3.

Introduction

United States healthcare costs, especially the cost of hospital care, have grown far faster than those of other countries or corresponding improvements in quality.[1] A long-brewing workforce shortage has been exacerbated by the COVID-19 pandemic.[2] Hospitals are facing a workforce crisis, in addition to the perennial problems of “unsustainably” high costs and poor consumer experience. Care providers such as physicians and nurses are trapped in a vicious cycle: burnout increases workforce attrition,[3] attrition and staff turnover leads to more work for those remaining, more work increases stress, and more stress leads to more burnout. The implementation of electronic medical record (EMR) systems have increased care provider documentation burden, aggravated provider burnout, and failed to provide hoped-for productivity gains or to provide interoperability across sites or systems.[4] As a result of reduced productivity and COVID-created demand surges, many hospitals and clinical programs are struggling to maintain access to care while suffering operating losses.

Hospital EMRs often lack basic functions needed to optimize workflows. Single-institution studies of low-value interactions with the EMR (interactions that have been eliminated without impacting patient care or essential documentation), found that these activities can be reduced by more than an hour per 12-hour nurse shift.[5]  Specific EMR tasks, such as admitting a patient to a hospital, could be shortened by an average of 30%.[6] In a survey of over 70,000 nurses, about 71%  said that the way orders were handled in the EMR impeded patient care, nurse efficiency, or both.[7]

Software as a service (SaaS) companies have driven significant productivity gains across numerous industries. In hospital care, SaaS is available for essentially every other aspect of hospital operations except patient care workflows; SaaS is common for revenue management, data visualization or business intelligence, and staff scheduling. In theory, EMR should improve productivity through enhanced analytics enabling more efficient workflows, and through better patient outcomes. In practice, the difficulties of changing workflows and of integrating new analytics with the EMR are major barriers to achieving this vision. Over the last two decades, academic researchers and technology companies have designed thousands of machine learning, optimization, and other powerful analytical models[8] with the potential to improve the value of hospital clinical care, but very few have been usefully implemented or scaled.[9,10]

Low-productivity technologies are those that add elements to existing workflows and business processes, and serve to sustain existing business models.[11] In most cases, these innovations end up adding cost to the healthcare system, such as using CAT scans instead of routine X-rays. Reducing healthcare costs requires the adoption of high-productivity technology: technology that changes business processes, substitutes away from low-value care, reduces overhead and management costs, or disrupts existing business models. Most technology innovation in healthcare seems to be in the low-productivity category when we desperately need innovation in the high-productivity category. There is limited understanding of why the massive investments in health information technology have not been more successful. There are two dimensions to process improvements involving information technology: technology integration and care provider workflows (Figure 1). Most information technology innovation strategies focus first on the technology and then, if at all, on workflows. We examine efforts to implement process innovation across both dimensions.

Figure 1: Quadrants of institutional effort required for full implementation

The Technology-First Approach

The few EMR-integrated decision-support tools that have been adopted into provider workflows are exceptions that illustrate the rule. The most common approach is to train or develop models on historical data, integrate the model into the EMR, or deploy the model on a server that pulls data from the EMR, and then attempt to integrate the model into the workflow of the care providers. Several examples demonstrate the limited success, difficulty, or reliance on specialized tools, and expense of this approach.

Sepsis is a bacterial infection that can lead to organ failure and death if not recognized and treated early. It is a leading cause of death in hospitalized patients. Thus, early recognition of patients with sepsis has the potential for significant improvement in clinical outcomes. In theory, clinical data from an EMR can be used to identify sepsis, integrating laboratory data, medications, clinical condition, and patient vital sign information. Single-site studies have suggested the potential for adoption of machine learning algorithms using data from EMRs.[12] On the other hand, a proprietary sepsis prediction model tied to EPIC and implemented in hundreds of hospitals turned out to perform poorly when it was studied carefully.[13] It identified only 7% of those sepsis patients who were missed by clinicians. Meanwhile it generated sepsis alerts on 18% of patients, most of which were false alarms. It is common to see analytical models exhibit worse performance in practice than in development due to the reduced quality and quantity of data available during patient care. A different sepsis early warning system was successful[14], but its success was so unusual that an additional paper was written about its development and adoption.

A system for automated predictions of acute kidney injury depended on the infrastructure provided by the custom EMR used at the Department of Veterans Affairs and a specialized mobile medical assistant and alerting system.[15] Another healthcare system calculated the cost to validate and integrate a single algorithm for chronic kidney disease detection into clinical workflow was $217,138.[16]

Far more common, though less likely to be reported in prestigious journals or advertised by companies, are interventions that fail to make a difference such as a program to improve statin prescriptions.[17] These efforts are instead reported as a proof of concept.

Such efforts face two closely related barriers that prevent hospitals from effectively leveraging SaaS to redesign workflows with software integrated into their EMR. Care providers resist changes to their workflows, based on legitimate concerns about the uncertain performance of new technology. The larger the proposed change in workflow, the greater the odds that it will create unanticipated problems and the more effort is needed for development and testing (Vertical axis of Figure 1). Second, technical integration with the EMR is prohibitively time-consuming and expensive (Horizontal axis of Figure 1).[16]

Since hospital operations are based around EMR workflows, reducing reliance on EMR integration often necessitates reducing the extent to which new tools can reshape workflows. Numerous research groups and healthcare companies have turned to process redesigns that allow care providers to keep their current workflows and require only limited interaction with the EMR, such as a single initial data extract of historical EMR data stored in a data warehouse, a much lower bar than requiring EMR integration (Bottom left quadrant Figure 2).

The multibillion-dollar healthcare operations consulting industry often follows this strategy, typically performing historical analyses followed by suggestions for one-time processes redesigns. The value of the work of consultants depends on their skill, and there is little scale economy from one project to the next. This leads to slower improvements than from technology and software in other industries where a software developer can invest tens of millions of dollars to provide improvements to all users.

Technology companies serving hospitals have been forced to balance the efficiencies of improving software with the costs of providing consulting services. Technology startup LeaNTaaS was originally conceptualized as a SaaS company to improve productivity using EMR data, but the company was forced to pivot to a model with only a one time pull of historical EMR data to optimize the templates that schedulers use for infusion appointments.[18] The optimized templates are then manually entered into the EMR in a one-time update. The infusions clinic or hospital resumes its original workflows, and the templates facilitate more efficient scheduling. Similarly, QVentus, an early healthcare analytics SaaS company, transitioned to a software-empowered consulting model where its customers are “partners.”[19] A variety of academic groups have pursued one-time, data-driven updates to: surgical preference cards (supply lists) to reduce errors, and surgical blocks to improve access for emergency surgery or reduce variation in hospital census.[20–22]  The simplicity of such approaches facilitates their implementation, but limits their potential to transform care delivery (Figure 2 diagonal).

An alternative approach to easing the barriers to implementation is to focus on tools that change only the software that care providers use, not their workflows or processes (Figure 1 tope left quadrant), or the tools that information services use (Figure 1 bottom right quadrant). This is the target of SaaS companies that focus on revenue management, data visualization or business intelligence, or staff scheduling. The Tableau data visualization software is increasingly popular with hospitals to save time generating and interacting with dashboards. Dashboards are suitable primarily for retrospective data review for managers, not for the implementation of more efficient, software-supported real-time workflows. Hospitals commonly use staff scheduling software that does not integrate with the EMR. Industry-leading scheduling tools such as Kronos require manual data entry, lack functionality compared to a tool that integrates with the EMR, and sometimes use paper timecards.[23] Such solutions have achieved significant scale across hospitals, but have limited relevance to more efficient, labor saving care delivery.

Figure 2: Tradeoffs between the effort required for implementation and the potential of the tool to transform care delivery

 A Provider-First Approach

An alternative is to reverse the tech-first, workflow later approach. We propose meeting care providers and their workflows where they are by starting with the simplest possible version of the tool, or a one-time process redesign, and then iterating up along the workflow, EMR-integration diagonal. Such an approach reduces risk with an easier initial deployment and has the benefit of collecting data and feedback to improve in subsequent stages. It comes at the cost of a more labor-intensive and collaborative development process than e.g., building a ML model based on historical data in isolation from workflows or the constraints of the EMR.

We recently reported on the design and deployment of an algorithm-enabled care model for personalized care at population scale.[24] TIDE (Timely Interventions for Diabetes Excellence) reduces provider screen time,[25] effectively analyzes data from continuous glucose monitors (CGMs) to identify patients in need of care provider attention, and is associated with improved type 1 diabetes management (lower HbA1C).[26] The key to the current success of TIDE is its iterative co-design by a team of care providers and engineers. TIDE started out as a simple, data visualization tool running locally on care provider laptops based on historical data manually pulled from the CGM manufacturer portal (Figure 3A).[25] It is currently an interactive dashboard that displays data generated by sophisticated algorithms, pulls data from the servers of the CGM manufacturer, and is hosted on a server with access to EPIC data (Figure 3B).

Figure 3: Initial and current versions of TIDE

3A Initial version of TIDE, no analytics, run locally on laptops, and requiring manual data downloads

Reproduced from [25] with the permission of the authors

 3B Current version of TIDE, data pre-processed with sophisticated analytics, run on institution server, and automated data pulls

The initial, minor improvements in user workflows generated enough enthusiasm that providers participated in improving TIDE, and adapting their workflows based on those improvements. The data collected in the USE of TIDE were used to update TIDE’s algorithms and improve its specificity without any impact to workflows. Subsequent demonstrations of time savings for providers and improved clinical outcomes, generated enough institutional enthusiasm to dedicate the information resources to facilitate a more robust deployment of TIDE, and provided resources and priority to allow integration of TIDE with the EMR. At each step, the changes required, and the risk of failure, were significantly smaller than they would have been when asking an institution to adopt and integrate the final version of TIDE (Figure 4). The final version of TIDE is now available as an open-source tool for other institutions to use freely to manage their type-1 diabetes patient populations. It is designed for an initial launch of more limited, simpler functionality that expands along with the needs and the comfort level of the clinical team.

Figure 4: Transition from an an initial implementation of a modest tool that preserved workflows to a partially EMR-integrated tool that shapes workflows

Conclusions

 These challenges of improving productivity with new technology are not unique to healthcare. Several decades ago, many industries faced similar problems with slow and awkward software development that resulted in expensive, inflexible and late system deliveries. This led to a collection of methods for rapid, less formal, user-centric, and incremental development under a number of labels such as “agile software development” and DevOps.[27]  Reducing the effort required for software integration with the EMR will lower the barrier to technology adoption and lead to a pathway to high productivity innovation. Pressuring large EMRs to comply with the rules of the 21st Century Cures Act against data blocking would be a meaningful step in this direction.[28] It remains an open question how much IT companies that purchased EMR vendors will redesign EMRs to fit into the broader technical infrastructure of healthcare.

In the meantime, productivity efforts focused on care providers provide an opportunity for meaningful improvement. The agile, multi-stage, and co-development paradigms mitigate the risk of adoption failure without sacrificing the final impact of the use of the tool.


References

References
1. Papanicolas I, Woskie LR, Jha AK. Health Care Spending in the United States and Other High-Income Countries. JAMA. 2018;319(10):1024-1039. doi:10.1001/jama.2018.1150
2. Johnson S. Staff Shortages Choking U.S. Health Care System. US News & World Reports. Published online July 28, 2022. Accessed October 3, 2022. https://www.usnews.com/news/health-news/articles/2022-07-28/staff-shortages-choking-u-s-health-care-system
3. West CP, Dyrbye LN, Shanafelt TD. Physician burnout: contributors, consequences and solutions. J Intern Med. 2018;283(6):516-529. doi:10.1111/joim.12752
4. Sahni NR, Huckman RS, Chigurupati A, Cutler DM. The IT Transformation Health Care Needs. Harvard Business Review. Published online November 1, 2017. Accessed October 2, 2022. https://hbr.org/2017/11/the-it-transformation-health-care-needs
5. Lindsay MR, Lytle K. Implementing Best Practices to Redesign Workflow and Optimize Nursing Documentation in the Electronic Health Record. Appl Clin Inform. 2022;13(3):711-719. doi:10.1055/a-1868-6431
6. Sutton DE, Fogel JR, Giard AS, Gulker LA, Ivory CH, Rosa AM. Defining an Essential Clinical Dataset for Admission Patient History to Reduce Nursing Documentation Burden. Appl Clin Inform. 2020;11(3):464-473. doi:10.1055/s-0040-1713634
7. The Nurse EHR Experience 2020 – Arch Report. Accessed October 2, 2022. https://klasresearch.com/archcollaborative/report/the-nurse-ehr-experience-2020/336
8. Mateen BA, Liley J, Denniston AK, Holmes CC, Vollmer SJ. Improving the quality of machine learning in health applications and clinical research. Nat Mach Intell. 2020;2(10):554-556. doi:10.1038/s42256-020-00239-1
9. Emanuel EJ, Wachter RM. Artificial Intelligence in Health Care: Will the Value Match the Hype? JAMA. 2019;321(23):2281-2282. doi:10.1001/jama.2019.4914
10. Simonite T. When It Comes to Health Care, AI Has a Long Way to Go. Wired. Accessed October 2, 2022. https://www.wired.com/story/health-care-ai-long-way-to-go/
11. Cahan EM, Kocher B, Bohn R. Why Isn’t Innovation Helping Reduce Health Care Costs? Health Affairs Forefront. doi:10.1377/forefront.20200602.168241
12. Sendak MP, Ratliff W, Sarro D, et al. Real-World Integration of a Sepsis Deep Learning Technology Into Routine Clinical Care: Implementation Study. JMIR Med Inform. 2020;8(7):e15182. doi:10.2196/15182
13. Wong A, Otles E, Donnelly JP, et al. External Validation of a Widely Implemented Proprietary Sepsis Prediction Model in Hospitalized Patients. JAMA Internal Medicine. 2021;181(8):1065-1070. doi:10.1001/jamainternmed.2021.2626
14. Bates DW, Syrowatka A. Harnessing AI in sepsis care. Nat Med. 2022;28(7):1351-1352. doi:10.1038/s41591-022-01878-0
15. Tomašev N, Glorot X, Rae JW, et al. A clinically applicable approach to continuous prediction of future acute kidney injury. Nature. 2019;572(7767):116-119. doi:10.1038/s41586-019-1390-1
16. Sendak MP, Balu S, Schulman KA. Barriers to Achieving Economies of Scale in Analysis of EHR Data. Appl Clin Inform. 2017;8(3):826-831. doi:10.4338/ACI-2017-03-CR-0046
17. Maddox TM. Clinical Decision Support in Statin Prescription—What We Can Learn From a Negative Outcome. JAMA Cardiology. 2021;6(1):48-49. doi:10.1001/jamacardio.2020.4756
18. iQueue Software for Infusion Centers – Healthcare Software. iQueue for Infusion Centers. Accessed October 3, 2022. https://leantaas.com/products/iqueue-for-infusion-centers/
19. Qventus Expert Services. Qventus, Inc. Accessed October 3, 2022. https://qventus.com/services/
20. Zenteno AC, Carnes T, Levi R, Daily BJ, Dunn PF. Systematic OR Block Allocation at a Large Academic Medical Center: Comprehensive Review on a Data-driven Surgical Scheduling Strategy. Annals of Surgery. 2016;264(6):973-981. doi:10.1097/SLA.0000000000001560
21. Zenteno AC, Carnes T, Levi R, et al. Pooled Open Blocks Shorten Wait Times for Nonelective Surgical Cases. Ann Surg. 2015;262(1):60-67. doi:10.1097/SLA.0000000000001003
22. Scheinker D, Hollingsworth M, Brody A, et al. The design and evaluation of a novel algorithm for automated preference card optimization. Journal of the American Medical Informatics Association. 2021;28(6):1088-1097. doi:10.1093/jamia/ocaa275
23. Kronos Alternative for Workforce Management. Smartlinx Solutions. Accessed October 3, 2022. https://www.smartlinx.com/kronos-alternative-workforce-management-software/
24. Scheinker D, Prahalad P, Johari R, Maahs DM, Majzun R. A New Technology-Enabled Care Model for Pediatric Type 1 Diabetes. NEJM Catalyst. 3(5):CAT.21.0438. doi:10.1056/CAT.21.0438
25. Scheinker D, Gu A, Grossman J, et al. Algorithm-Enabled, Personalized Glucose Management for Type 1 Diabetes at the Population Scale: Prospective Evaluation in Clinical Practice. JMIR Diabetes. 2022;7(2):e27284. doi:10.2196/27284
26. Prahalad P, Ding VY, Zaharieva DP, et al. Teamwork, Targets, Technology, and Tight Control in Newly Diagnosed Type 1 Diabetes: the Pilot 4T Study. J Clin Endocrinol Metab. 2022;107(4):998-1008. doi:10.1210/clinem/dgab859
27. DevOps. In: Wikipedia. ; 2022. Accessed October 3, 2022. https://en.wikipedia.org/w/index.php?title=DevOps&oldid=1111007463
28. Information Blocking. AHIMA. Accessed October 3, 2022. https://www.ahima.org/news-publications/trending-topics/information-blocking/

Telehealth’s Role in Preserving Access for Medicare Beneficiaries During and After the Public Health Emergency

Devin A. Stone, Jennifer A. Ohn, Luis Arzaluz, and Mara B. McDermott, McDermott+Consulting

Contact: DAStone@mcdermottplus.com

Abstract

What is the message? During the pandemic, telehealth provided Medicare patients access to care and helped minimize their exposure to COVID-19. Post pandemic, telehealth has the potential to provide a promising pathway to achieve improved and equitable access to care, and to help mitigate the current healthcare workforce shortage. Congress should therefore consider proposals to extend telehealth flexibilities beyond the pandemic public health emergency.

What is the evidence? U.S. government Medicare administrative claims data documenting telehealth utilization among Medicare fee-for-service beneficiaries, as well as American Community Survey data from the U.S. Census on broadband access in counties nationwide.

Timeline: Submitted: July 18, 2022; accepted after review: October 1, 2022.

Cite as: Devin A. Stone, Jennifer A. Ohn, Luis Arzaluz, Mara B. McDermott. 2022.Telehealth’s Role In Preserving Access for Medicare Beneficiaries During the Public Health Emergency. Health Management, Policy and Innovation (www.HMPI.org), Volume 7, Issue 3.

Introduction

Spurred by the COVID-19 pandemic during which patients needed to find care that was safe and effective, while also helping to “flatten the curve,”[1] telehealth provided an important avenue for patients to maintain access to care and for both patients and providers to avoid unnecessary exposure to the virus.[2] Out of necessity, telehealth was adopted at a rapid clip, with over 14 million Medicare fee-for-service (FFS) beneficiaries receiving care via telehealth in 2020, compared to fewer than 211,000 Medicare FFS beneficiaries in the year prior. Telehealth was commonly used by patients regardless of their age, sex, race, and ethnicity, but upon closer analysis, telehealth was most commonly used by patient groups that traditionally incur high healthcare costs.[3] Through the rapid proliferation of telehealth services, this mode of care delivery has proven to not only maintain care access and mitigate the spread of infection by minimizing COVID-19 exposure, but it has delivered cost-effective and efficient care.[2] Furthermore, telehealth presents the potential to improve overall access to healthcare services. [2],[4] In this paper, we analyze the impact of the COVID-19 pandemic on telehealth utilization among Medicare beneficiaries and the telehealth policy implications.

Prior to the pandemic, Medicare reimbursed telehealth services when they were administered at qualifying originating sites (e.g., practitioner office, hospital, rural health clinic) and located in rural areas (geographic site requirements). However, the Coronavirus Preparedness and Response Supplemental Appropriations Act passed by Congress in 2020, permitted the waiver of the originating site requirements during the emergency period. Additionally, the Coronavirus Aid, Relief, and Economic Security (CARES) Act provided the Secretary of Health and Human Services (HHS) the authority to waive the statutory requirements related to Medicare coverage of telehealth services during the public health emergency (PHE). Key waivers necessary to allow for the proliferation of telehealth are set to expire five months after the close of the PHE. Given the impending expiration action by Congress and CMS, it is necessary to ensure that patients can permanently access care provided virtually. As of July 2022, the House passed the Advancing Telehealth Beyond COVID-19 Act (H.R. 4040) to extend COVID telehealth flexibilities in the Medicare program through the end of 2024. Despite a crowded legislative calendar, inclusion of a telehealth bill in a larger end-of-year legislative package is a possibility.

2019-2020 Medicare Beneficiary Telehealth Utilization Analysis

To understand which patient groups have been using telehealth, we estimated the total number of unique beneficiaries and patient days when a Medicare FFS beneficiary received care for one or more services provided via telehealth using the CMS 5% Medicare carrier (physician) and outpatient limited data set (LDS) standard analytic files for 2019 and 2020. Physician and outpatient claims were defined as telehealth if they contained a place-of-service code or modifier for telehealth, or a Healthcare Common Procedure Coding System (HCPCS) that expanded beneficiary access via phone, video, or the internet. We also analyzed pre-pandemic emergency room and inpatient claim diagnoses among unique Medicare beneficiaries using the 5% Medicare outpatient and inpatient LDS files. Broadband access at the county level was determined using American Community Survey (ACS) 2020 data. Since our Medicare claims analyses were derived from a 5% sample of Medicare FFS beneficiaries, our estimates are extrapolated by a factor of 20 to represent 100% of the Medicare FFS population. Our analysis represents 32 million Medicare fee-for-service beneficiaries, with demographic information available for this population in the Appendix. Although there were no clear relationships in telehealth use by age, our analysis did find that 47% of females had at least one telehealth encounter in 2020 compared to only 41% of males.

Medicare Beneficiaries with Higher ER Utilization Are More Likely to Use Telehealth

Beneficiaries with the highest emergency room use prior to the pandemic were more likely to use telehealth in 2020. As shown in Figure 1, among Medicare beneficiaries with five or more ER visits between March 2019 through February 2020 (the 12 months prior to the PHE), 38% had a telehealth visit during April 2020, compared to only 15% of beneficiaries who had zero ER visits in the same 12-month period prior to the PHE. Telehealth provided these patients with an opportunity to safely meet with their doctor at a time when there was great uncertainty over the safety of in-person visits.

The number of unique beneficiaries accessing telehealth each month began to decline as more beneficiaries pursued in-person care from July through the end of the year. As more beneficiaries returned to in-person care, telehealth continued to play a vital role for patients that historically had high ER use. Among patients who had five or more ER visits in the year prior to the pandemic, 24% had at least one telehealth visit in December of 2020, compared to just 9% who had no ER visits in the year prior to the pandemic.

Figure 1. Percent of Medicare FFS Beneficiaries With 1+ Telehealth Encounter in March/April 2020 and December 2020 by Prior ER Use

*There was a statistically significant association between telehealth use and emergency room visits pre pandemic (Χ2(3) = 14,538, p < .0001). Chi-squared test based performed for the month of December 2020, using a 5% sample of Medicare FFS beneficiaries.

Medicare Beneficiaries with Chronic Conditions Are More Likely to Use Telehealth

Medicare beneficiaries with certain chronic health conditions were much more likely to adopt telehealth at the start of the PHE. Although only 20% of Medicare beneficiaries relied on telehealth during March or April of 2020, 44% of patients with a prior diagnosis for chronic pain syndrome used telehealth during the same two-month period, as shown in Table 1. Telehealth played an important role in expanding access to medical care for a substantial portion of Medicare patients with health conditions requiring continuous medical care.

Table 1. Percent of Medicare FFS Beneficiaries that used Telehealth by prior Diagnosis

Among Beneficiaries With a Diagnosis Between
March 2019 – February 2020 for:
ICD-10-CM % of Medicare Beneficiaries That Used Telehealth in March/April 2020
Chronic pain syndrome G894 44%
Major depressive disorder, recurrent, moderate F331 43%
Fibromyalgia M797 42%
Generalized anxiety disorder F411 38%
Sleep apnea, unspecified G4730 37%
Chronic diastolic (congestive) heart failure I5032 37%
Pulmonary hypertension, unspecified I2720 35%
Type 2 diabetes mellitus with diabetic chronic kidney disease E1122 35%
Chronic kidney disease, unspecified N189 34%
Chronic obstructive pulmonary disease, unspecified J449 32%

As was the case at the start of the PHE, telehealth use in December of 2020 was common among patients with major depressive disorder, chronic pain syndrome, fibromyalgia, and generalized anxiety disorder, where one in four relied on telehealth (descriptive table not shown). These findings suggest telehealth continues to be a valuable tool for Medicare patients, especially for those with diagnoses for chronic pain and many other conditions.

Telehealth Flexibilities Are Key for ESRD and Dual Eligible Patients

Medicare beneficiaries with End Stage Renal Disease (ESRD), dual-eligible, and those who originally or currently qualify for Medicare through disability, strongly relied on telehealth visits during 2020. The share of Medicare beneficiaries with at least one telehealth visit among these patient groups is substantially larger compared to their larger Medicare population counterparts, as shown in Figure 2.

Figure 2. Percent of Medicare FFS Beneficiaries with at least one Telehealth Visit by Beneficiary Group

*Differences are statically significant among groups, ESRD (Χ2(1) = 2,789, p < .0001), Dual (Χ2(1) = 10,841, p < .0001), Disability (Χ2(1) = 8,277, p < .0001). Chi-squared test based on a 5% sample of Medicare FFS beneficiaries.

Expanding Broadband Could Further Improve Access to Telehealth Services

Over 10 million Medicare FFS beneficiaries reside in counties where less than 80% of households have broadband access, underscoring the need to improve broadband access. Telehealth use prior to the pandemic was more common in areas with limited broadband access, most likely due to originating and geographic site restrictions which limited telehealth use to primarily rural areas. Telehealth use increased for Medicare beneficiaries living in counties where less than 80% of the population has access to broadband, from 0.04 telehealth encounter days per beneficiary in 2019 to 1.11 in 2020. Telehealth use increased at a much higher rate during the pandemic for counties with stronger broadband access, most likely due to the waiving of geographic and originating site requirements. Although counties with limited broadband access had lower rates of telehealth in 2020 compared to counties with high broadband access, beneficiaries in areas with limited broadband access continued to benefit from telehealth.

Table 2. Telehealth Encounter Days per Medicare FFS Beneficiary by Broadband Access

Telehealth Is Changing Healthcare and the Policy Landscape

Indicated by this analysis, uptake of telehealth delivery did not meet its potential prior to the pandemic. Through the pandemic, we saw systems and infrastructure in place to support telehealth services at levels previously unseen. [5] Aided by legislative and regulatory fast-track changes, providers and patients were able to subvert traditional challenges and pre-COVID barriers, including originating site and geographic requirements.

CMS also added several qualifying telehealth services for the duration of the PHE. Established in the CY 2021 Medicare Physician Fee Schedule (MPFS) final rule, CMS provided coverage for more than 100 services in the Medicare Telehealth List on a temporary (Category 3) basis to last until the end of the PHE.  CMS then extended coverage for these Category 3 services through the end of CY 2023 through the 2022 MPFS final rule. The originating site and geographic restrictions, however, will apply to these extended telehealth services for five months after the PHE ends. Congressional action therefore is the only way to permanently revise the originating site requirements and the other barriers to Medicare reimbursement of telehealth services.

As noted previously, CMS provided flexibilities around the originating site and geographic site, which refer to the location of the beneficiary at the time the service is provided. Pre-COVID statute restricts the delivery of telehealth services to certain rural areas of the country (geographic site restrictions) and certain physical locations such as hospitals and physicians’ offices (originating site restrictions). During COVID-19, Medicare and many Medicaid programs expanded coverage so providers may deliver telehealth services to patients in their homes and other locations and in any area of the country. Continuing these flexibilities after the close of the public health emergency may better allow traditionally underserved patient populations to receive care from providers that may be geographically distant. [6]

Public perception of telehealth is improving with patients and providers expressing interest.[7],[8] A literature review found that telehealth is commonly associated with patients being satisfied or highly satisfied with telehealth. Investment in virtual health is increasing.[9],[10] One report estimates that $250 billion of U.S. healthcare spend could shift to virtually enabled care.[11] Under pre-pandemic geographic site restrictions, only two of every 100 Medicare beneficiaries live in counties eligible to receive telehealth services.[12] Through telehealth, there is an opportunity to achieve shared goals of equitable care and improved access. As the nation faces workforce shortages for healthcare providers, telehealth provides a promising pathway to address these provider shortages, particularly by addressing geographic and originating site flexibilities. To preserve access, it’s important that Congress consider proposals to extend telehealth flexibilities beyond the PHE.

Appendix

Table 1. Beneficiary Demographics

Demographics N (%)
Total 32,279,317 (100)
Age
Under age 65  5,292,128 (16)
Age 65 to 74  15,445,643 (48)
Age 75 and older  11,541,545 (36)
Sex
Male  17,632,670 (55)
Female  14,646,647 (45)
Race
Asian  729,598 (2)
Black  2,839,098 (9)
Hispanic  736,755 (2)
North American Native  183,002 (1)
Other  547,342 (2)
Unknown  787,158 (2)
       White 26,456,363 (82)
% Of Patients by Total Telehealth Encounter Days in 2020
Zero  18,085,245 (56)
One to Two  8,801,940 (27)
Three to Four  2,739,708 (8)
Five or More  2,652,423 (8)


References

[1] Tsai TC, Jacobson BH, Jha AK. American Hospital Capacity And Projected Need for COVID-19 Patient Care. Health Aff Forefront. 2020. doi: 10.1377/hblog20200317.457910.

[2] Garfan S, Alamoodi AH, Zaidan BB, Al-Zobbi M, Hamid RA, Alwan JK, Ahmaro IY, Khalid ET, Jumaah FM, Albahri OS, Zaidan AA. Telehealth utilization during the Covid-19 pandemic: A systematic review. Comput Biol Med. 2021 Nov 1;138:104878.

[3] Hamadi HY, Zhao M, Haley DR, Dunn A, Paryani S, Spaulding A. Medicare and telehealth: The impact of COVID‐19 pandemic. J Eval Clin Pract. 2022 Feb;28(1):43-8.

[4] Maese JR, Seminara D, Shah Z, Szerszen A. Perspective: What a Difference a Disaster Makes: The Telehealth Revolution in the Age of COVID-19 Pandemic. Am J Med Qual. 2020 Sep;35(5):429-31.         .

[5] Chang JE, Lai AY, Gupta A, Nguyen AM, Berry CA, Shelley DR. Rapid transition to telehealth and the digital divide: implications for primary care access and equity in a post‐COVID era. Milbank Q. 2021 Jun;99(2):340-68.

[6] Predmore ZS, Roth E, Breslau J, Fischer SH, Uscher-Pines L. Assessment of patient preferences for telehealth in post–COVID-19 pandemic health care. JAMA Netw Open. 2021 Dec 1;4(12):e2136405-.

[7] Holtz BE. Patients Perceptions of Telemedicine Visits Before and After the Coronavirus Disease 2019 Pandemic. Telemedicine and e-Health. 2021;27(1). https://doi.org/10.1089/tmj.2020.0168.

[8] Devitt M. Survey, FP Expert Agree: Interest in Telehealth on the Rise. AAFP News. 2019. Accessed from: https://www.aafp.org/news/practice-professional-issues/20190514telehealth.html.

[9] Kruse CS, et al. Telehealth and patient satisfaction: a systematic review and narrative analysis. BMJ Open. 2017;7:e016242. doi:10.1136/bmjopen-2017-016242.

[10] Krasniansky A, Zweig M, Evans B. H1 2021 digital health funding: Another blockbuster year…in six months. Rock Health. 2021. Accessed from: https://rockhealth.com/insights/h1-2021-digital-health-funding-another-blockbuster-year-in-six-months/.

[11]  Bestsennyy O, et al. Telehealth: A quarter-trillion-dollar post-COVID-19 reality? McKinsey & Company. 2021. Accessed from: https://www.mckinsey.com/industries/healthcare-systems-and-services/our-insights/telehealth-a-quarter-trillion-dollar-post-covid-19-reality.

[12] Partnership to Advance Virtual Care. Response to U.S. Senate Committee on Finance Request for Information (RFI) Regarding Bipartisan Behavioral Health Care Legislation [letter]. 2021. Accessed from: https://www.finance.senate.gov/imo/media/doc/PAVC%20Response%20to%20RFI%20on%20Mental%20Health%20-%20November%2010%202021.PDF.