HMPI

A Transparent, Mathematical Model to Evaluate Proposals for Healthcare Reform

Gabriel M. Knight, BA, Northwestern University Feinberg School of Medicine; Kevin Schulman, MD, Arnold Milstein, MD, MPH, Clinical Excellence Research Center, Stanford University School of Medicine; Sheridan Rea, BS; Giovanni Malloy, BS; Usman Khaliq, BEng; David Scheinker, PhD, Stanford University School of Engineering

Abstract

Contact: David Scheinker dscheink@stanford.edu

Cite as: Gabriel M. Knight, Kevin Schulman, Arnold Milstein, Sheridan Rea, Giovanni Malloy, Usman Khaliq, David Scheinker. 2019. A Transparent, Mathematical Model to Evaluate Proposals for Healthcare Reform. Health Management Policy and Innovation, Volume 4, Issue 3.

The U.S. Needs Transparent, Mathematical, Prospective Analyses of Policy Proposals

The United States spends nearly twice as much as other high-income countries on healthcare despite similar utilization rates and access to fewer services. [1] American health expenditures are expected to continue to increase by an average of 5.8 percent annually through at least 2024 if current laws and practices persist. [1–3] Moreover, the cost of healthcare, whether preventive services or the treatment of illness, profoundly impacts nearly every American’s life, making the issues of healthcare costs and access a deeply personal and often emotional subject of discussion. There is significant intellectual debate about efforts to reform and restructure the healthcare system in the country.

We suggest that the current healthcare policy debate would be less partisan and more effective if there were a means to separate questions of principle from technical implementation. Issues of principle in the debate include whether access to healthcare is a right or whether it is a discretionary consumer service; where the appropriate boundary between personal responsibility and social support lies; and how society should allocate healthcare resources to those with and without means. Clearly, these issues engender personal, passionate debate.

The issues of technical implementation include quality, efficiency, and cost; current and proposed incentives; the timeline of implementation; and other economic considerations. These are technical issues that engender much less passionate response on the part of the public—though experts may still have passionate disagreements about some of these factors. Developing a public, transparent model could force health policy analysts to discuss the technical aspects of policy proposals early, so that when policy proposals are released to the public, there would be less conflation of principle and technical arguments.

The nonpartisan Congressional Budget Office (CBO) produces a detailed quantitative report estimating the impact of proposed legislation. However, the models used by CBO are often not broadly available for outside interrogation or modification. Furthermore, while the CBO is a nonpartisan support arm of the United States Congress, some parameters of their models do reflect political influence, as was the case, for instance, in the debate over dynamic modeling of the 2017 tax cuts. [4]

Many proposed health policies can be readily parameterized, including reimbursement rates, the start and duration of the implementation period, and the subset of the industry to which various provisions apply. Modern data simulation and visualization technology make it possible to create relatively simple, flexible models suitable for simulating a large range of policy proposals and economic scenarios. If even a fraction of the debate around healthcare reform involved elements of shared models, the public could become more engaged in the discussion.

We propose a real-time simulation and visualization model to guide and assess basic structural questions underlying healthcare policy. We illustrate the idea of how such a tool may function by drawing on a recently published paper describing a proposed version of Medicare for All (MFA). [5-8] The attention paid to this proposal suggests it is an interesting example to explore.

This essay has three goals. We first describe three properties of a good health policy model. Second, we catalog sources of data. Third, we develop a simple proof-of-concept version of the MFA tool and explore basic questions about this proposed policy.

Parameterizing Health Policy: An Illustration Using Variants of “Medicare for All” (MFA)

Properties of a useful policy simulation tool

A useful policy simulation model has three characteristics. First, the model must illustrate policies through an easy-to-use visual interface. While no useful tool can simulate all healthcare reform policies, users could consider the high-level components of many proposals as dynamic parameters. Second, it should incorporate values and parameters for which evidence is uncontroversial, such as the number of hospitals in the U.S. and the revenue of each hospital. For the values and parameters for which no consensus exists, such as the time needed to adopt a reform or changes in efficiency that result from the reform, the model must allow dynamic manipulation. Third, the model should be transparent, so that people interested in testing other policies or assumptions can modify it. This is necessary to address criticisms such as “the model fails to account for these phenomena.”

Feasibility: Data sources

Several public and private sources provide data for the model we propose. Data on payments (private, public, out-of-pocket) and costs (e.g., labor, supply, infrastructure, subsidies) broken down by hospital are necessary to model how reforms affect hospitals and systems across different entity types (e.g., academic versus community, nonprofit versus for-profit) and locations (e.g., regions, states, urban vs rural). Below we describe which data are available and which, if made available through policy changes or research, would help create the model.

First consider cost versus payment data. Data on costs for hospitals and providers is more readily available than data on payments—particularly prices paid by private insurers, which involve high price variation and little transparency. Cost data are available from the Centers for Medicare & Medicaid Services (CMS) Hospital Cost Report, which contains total costs for hospitals for fiscal years 2014–2017. [9] Additionally, the CMS Market Basket dataset, which is a hospital input price index, reflects price inflation facing providers of medical services.

Despite the limits of existing payment data, payments by specific hospitals or groups of hospitals could be estimated using data sources such as the CMS Case Mix File Hospital Inpatient Prospective Payment System. This file contains hospitals’ case mix indices, representing the average diagnosis-related group relative weight for that hospital, as well as the number of cases at the hospital for 2014–2017. [10] This data could then be multiplied by payer mixes for individual hospitals, which exist in Definitive Healthcare’s Essential Data on Hospitals and IDNs database. [11] This, in turn, could be multiplied by approximate reimbursement rates as a percentage of the Medicare reimbursement rate for specific payer mixes or diagnosis-related groups. The Medicare reimbursement rate could be estimated using the CMS Physician Fee Schedule as well as recently published data about average disparities between Medicare and private reimbursements for different procedure types. [5,12]

To the best of our knowledge, detailed datasets reporting payments and reimbursement rates associated with individual hospitals and systems do not exist. Future efforts should create this information. A recently proposed rule from the Department of Health and Human Services would require hospitals publish the prices that they charge private insurers, which would facilitate the analyses we propose. [13]

Subsidy data has mixed availability. Estimates exist regarding total dollars associated with some subsidy programs, such as the 340B drug pricing program and Disproportionate Share Hospital payments for hospitals that serve relatively large numbers of Medicaid and uninsured individuals. [14–16] However, we lack granular data on subsidies and other savings afforded to certain centers of care. Fortunately, because subsidies represent a small fraction of healthcare spending, this has limited impact on the power of the model.

Additional data about hospital characteristics will be needed to allow users to explore how certain reforms might affect different types of hospitals. For example, to filter key demographic information, U.S. Census data could be cross-walked with zip codes, cities, or other localizing data associated with which patients visit which hospitals. The type of entity (e.g., academic versus community, nonprofit versus for-profit) could be obtained from Definitive Healthcare’s Essential Data on Hospitals and IDNs database. [11] For users interested in evaluating how reforms will affect locales associated with different health outcomes, data could be extracted from Robert Wood Johnson Foundation County Health Rankings data. [17] Similar approaches could be applied to many other factors.

Ultimately, a trustworthy simulation model should move beyond dollars to forecast impact on all six aims of healthcare that the Institute of Medicine’s famous “Crossing the Quality Chasm” report highlights. [18] To achieve this, we will need access to electronic health record data as well as key patient-reported outcomes such as patient experience. While our proposed model focuses on economic and operational effects, it could serve as the foundation for a more comprehensive effort.

A simple proof of concept: Exploring variants of “Medicare for All”

The focus of our MFA model is the impact of reimbursement changes on hospital financial and performance. We consider both sources of funds, including insurance payments and other payments and subsidies, as well as uses of funds, including property, plant and equipment, labor, and medications and supplies. Costs were further divided into variable costs and committed cost. [24] To allow the user to simulate variants of the MFA proposal by Schulman and Milstein, [5] we used modifiable parameters of: the duration of the transition period to the new payment model, the policy payment rate as a percentage of Medicare payment rates, and changes in hospital productivity in response to a policy change. We discuss these in more detail below.

Measurement Parameters

Policy parameters

  • Reimbursement rate as percent of Medicare prices. In the proposed MFA policy, the reimbursement rate is set, implicitly, to 100 percent. One may readily imagine policies that set all private prices to a higher percentage of Medicare prices. For example, in her proposed MFA plan, Senator Elizabeth Warren has argued in favor of setting reimbursements to 110 percent of the current Medicare rate. [19]
  • The start and duration of the implementation period. Schulman et al.’s proposal explored the hypothetical change if the policy was implemented from one year to the next. [5] In practice, a transition would likely be set to start several years in the future and phase in over several more years.
  • The rate at which reimbursement changes over the years of the implementation period. This rate is partly determined by the total reimbursement change and the duration of the implementation period.
  • The sizes and characteristics of hospitals to which various versions of the policy apply. While the original proposal grouped all hospitals together, different MFA proposals would likely apply differently across categories of hospitals such as critical-access hospitals.

Impact parameters

  • The rate at which hospitals improve efficiency in response. The premise of the original proposal, supported by empirical evidence, is that hospitals would respond to price pressure by reducing costs. Though the original proposal did not explore this explicitly, a simulation model could incorporate this as a parameter.
  • The rate at which hospitals convert revenue shortfalls into full-time equivalent (FTE) reductions. The original paper calculated the number of FTEs hospitals would have to reduce to offset the entire projected revenue shortfall associated with a transition to MFA. In practice, hospitals would likely find a variety of ways to respond to revenue shortfalls. For example, price pressure might force hospitals to increase FTEs in areas associated with productivity improvement.

Calculated outcomes

  • The costs and revenues of each hospital in each year.
  • Total healthcare spending at the national and local levels.
  • The change in the number of FTEs and the corresponding job creation and losses across various parts of the country.

Figures

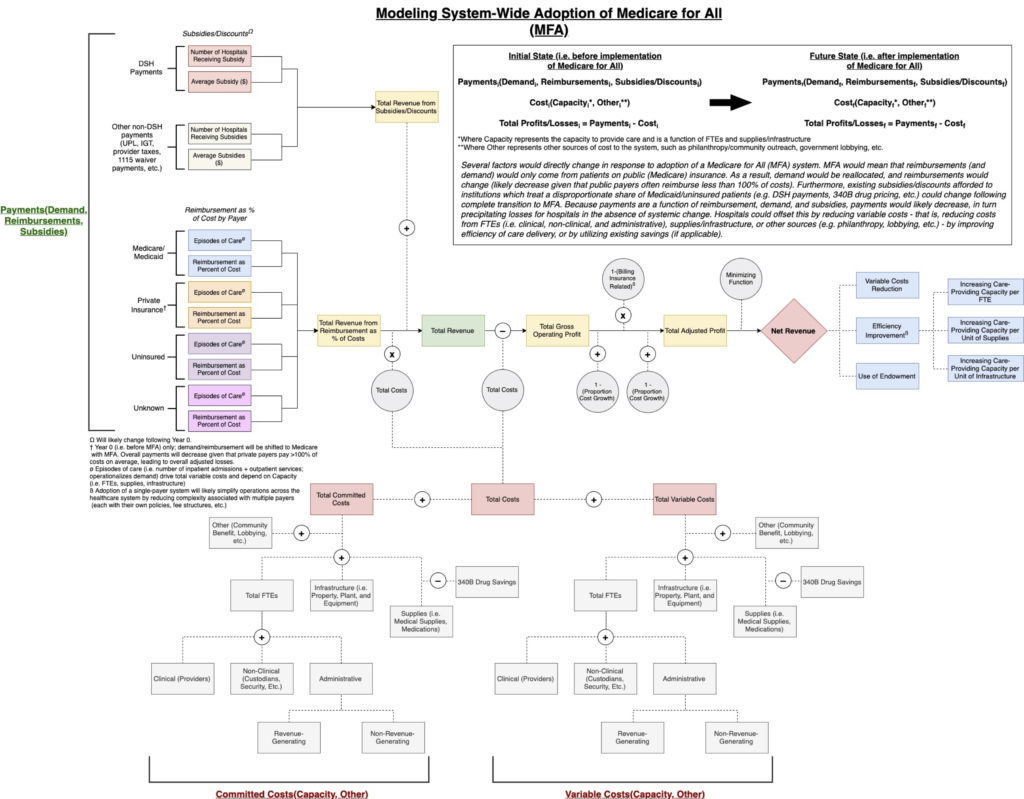
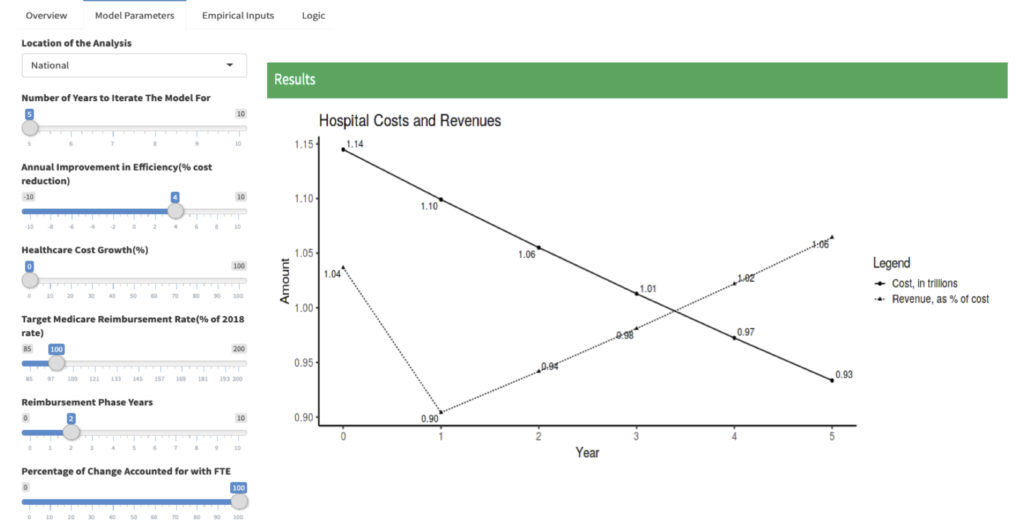
Several figures depict the core ideas. Figure 1 provides a schematic illustrating the logic underpinning a proof-of-concept framework for adoption of MFA. Figure 2 is a more detailed logic diagram. Figure 3 offers a sample data visualization of the model output. In the model, users can modulate: (1) the number of years for which to iterate the model; (2) annual efficiency improvement (i.e., % cost reduction) in response to reform; (3) annual healthcare cost growth; (4) target Medicare reimbursement rate (as a percentage of the 2018 rate); (5) years needed to fully phase in reform and accompanying reimbursement models; and (6) percentage of change in hospital revenue addressed by FTE changes. For this proof-of-concept, we have set values for these parameters to those found in Schulman and Milstein’s essay on MFA. [5] In particular, the target reimbursement rate is 100 percent of the 2018 Medicare rate and the percentage in revenue changes addressed by FTE changes to 100%. [6]

Download a PDF of the MFA Model_


Figure 1. A general schematic illustrating the logic underlying a model for adoption of Medicare for All.


Figure 2. A more detailed schematic illustrating the logic underlying a model for adoption of Medicare for All.


Figure 3. A proof of concept. This model would allow users to dynamically modulate key parameters in which they are interested or for which no consensus currently exists.


While designed for one specific, simple proposal, this sample model could readily be modified to apply to other policies recently proposed. In addition to “Medicare for all,” examples include (1) a new national health insurance program for all U.S. residents with an opt-out for qualified coverage; (2) a new public plan option that would be offered to individuals through the Affordable Care Act (ACA) marketplace; (3) a Medicaid buy-in option that states could elect to offer to individuals through the ACA marketplace; and (4) a Medicare buy-in option for older individuals not yet eligible for the current Medicare program. [20]

The plans proposed by the 2020 Democratic presidential candidates all involve extending public insurance. [20,21] These proposals would likely have a number of direct effects that can be estimated, including: (1) overall payments to hospitals and health systems; (2) impact of changes to hospital subsidies such as the 340B drug pricing program; and (3) decreasing certain labor and infrastructure costs associated with a complex, multi-payer system, where each payer has its own policies and procedures. [5,22,23] Each of these proposals would precipitate these changes and an effective model would allow the user the ability to quickly and clearly change the values for the different parameters that distinguish these different reforms in order to objectively and meaningfully compare them and evaluate their impacts.

Looking Forward: Create an Objective Model for Technical Implementation

The debate over healthcare reform would be less partisan with explicit distinctions between matters of principle and technical implementation. An objective, transparent, and versatile simulation and visualization model could simulate the results of a variety of technical policy proposals. Such a model would allow policymakers and the public to compare the potential impact of various healthcare reform proposals. We demonstrated the feasibility of such a model and the availability of much of the necessary data with a simple proof-of-concept. A commitment to making data more available and developing a more robust model are necessary steps toward a more fruitful debate on healthcare reform.


Notes and References

[1] Papanicolas I, Woskie LR, Jha AK. Health care spending in the United States and other high-income countries. Journal of the American Medical Association 2018;319(10):1024-1039.

[2] Morgan, L. U.S. healthcare annual spending estimated to rise by 5.8% on average through 2024. American Health & Drug Benefits 2015;8(5):272.

[3] McCarthy M. U.S. healthcare spending will reach 20% of GDP by 2024, says report. British Medical Journal 2015 August 3;351(3):h4204.

[4] Tax Policy Center. Briefing book. Urban Institute & Brookings Institution 2019. Available at: https://www.taxpolicycenter.org/briefing-book/what-are-dynamic-scoring-and-dynamic-analysis

[5] Schulman KA, Milstein A. The implications of “Medicare for All” for U.S. hospitals. Journal of the American Medical Association 2019;321(17):1661-1662.

[6] Rosenthal E. ‘Medicare for All’ could kill two million jobs, and that’s O.K. The New York Times 2019 May 16. Available at: https://www.nytimes.com/2019/05/16/opinion/medicare-for-all-jobs.html.

[7] Rosenthal E. That beloved hospital? It’s driving up health care costs. The New York Times 2019 September 1. Available at: https://www.nytimes.com/2019/09/01/opinion/hospital-spending.html.

[8] Abelson R. Hospitals stand to lose billions under ‘Medicare for All’. The New York Times 2019 April 21. Available at: https://www.nytimes.com/2019/04/21/health/medicare-for-all-hospitals.html?smid=nytcore-ios-share.

[9] The National Bureau of Economic Research. Healthcare Cost Report Information System (HCRIS) data. The Centers for Medicare & Medicaid Services 2019. Available at: https://www.nber.org/data/hcris.html.

[10] The National Bureau of Economic Research. CMS Casemix File Hospital Inpatient Prospective Payment System (IPPS). The Centers for Medicare & Medicaid Services 2017. Available at: https://www.nber.org/data/cms-casemix-file-hospital-inpatient-prospective-payment-system-ipps.html.

[11] Definitive Healthcare. Hospitals and IDNs database. Definitive Healthcare, LLC, 2019. Available at: https://www.definitivehc.com/product/our-databases/hospitals-and-idns.

[12] CMS.gov. Physician Fee Schedule. Centers for Medicare & Medicaid Services 2019. Available at: https://www.cms.gov/Medicare/Medicare-Fee-for-Service-Payment/PhysicianFeeSched/index.html.

[13] Uhrmacher K, Schaul K, Firozi P, Stein J. Where 2020 Democrats stand on Medicare-for-all. The Washington Post 2019 December 2. Available at: https://www.washingtonpost.com/graphics/politics/policy-2020/medicare-for-all/.

[14] Dickson S, Coukell A, Reynolds I. The size of the 340B Program and its impact on manufacturer revenues. Health Affairs 2019 August 8. Available at: https://www.healthaffairs.org/do/10.1377/hblog20180807.985552/full/.

[15] Lagasse J. Hospitals saved an average of $11.8 million due to 340B drug discount program. Healthcare Finance 2019 June 17. Available at: https://www.healthcarefinancenews.com/node/138838.

[16] Bristol N. Medicaid DSH Payment cuts could add to financial woes of safety-net hospitals. The Commonwealth Fund 2012. Available at: https://www.commonwealthfund.org/publications/newsletter-article/medicaid-dsh-payment-cuts-could-add-financial-woes-safety-net.

[17] County Health Rankings & Roadmaps. 2019 County Health Rankings. Robert Wood Johnson Foundation, 2019. Available at: https://www.countyhealthrankings.org/explore-health-rankings/rankings-data-documentation.

[18] Institute of Medicine. Crossing the quality chasm: A new health system for the 21st Century. National Academy of Sciences 2001. Available at: http://www.nationalacademies.org/hmd/~/media/Files/Report%20Files/2001/Crossing-the-Quality-Chasm/Quality%20Chasm%202001%20%20report%20brief.pdf.

[19] Sanger-Katz M, Kliff S. Elizabeth Warren’s ‘Medicare for All’ math. The New York Times 2019 November 11. Available at: https://www.nytimes.com/2019/11/01/upshot/elizabeth-warrens-medicare-for-all-math.html.


[20] KFF Health Reform. Comparing Medicare-for-all and public plan proposals. Kaiser Family Foundation 2019. Available at: https://www.kff.org/interactive/compare-medicare-for-all-public-plan-proposals/.


[21] Uhrmacher K et al. Where 2020 Democrats stand on Medicare-for-all. The Washington Post 2019 December 2. Available at: https://www.washingtonpost.com/graphics/politics/policy-2020/medicare-for-all/.


[22] Liu JL, Eibner C. National health spending estimates under Medicare for All. RAND 2019. Available at: https://www.rand.org/pubs/research_reports/RR3106.html.


[23] Jawani A. et al. Billing and insurance-related administrative costs in United States’ health care: Synthesis of micro-costing evidence. BMC Health Services Research 2014;14:556.


[24] Though certain costs are fixed for years at a time, labor costs are never truly fixed, so we use the term “committed” as suggested by Professor Robert Kaplan of Harvard Business School.

 

Are Healthcare Access and Quality Compatible? Insights from Peer Countries

Will Mitchell, Rotman School of Management, University of Toronto

Abstract

Contact: Will Mitchell william.mitchell@Rotman.Utoronto.Ca

Cite as: Will Mitchell. 2019. Getting to Bi-Partisan Healthcare Solutions by Agreeing on Goals and Principles. Health Management Policy and Innovation, Volume 4, Issue 3.

The Debate About Healthcare Reform in the U.S. Is Dysfunctional

The current debate about health reform in the U.S. highlights conflicting structural initiatives—Medicare for all, Medicare for all who want it, adding to the Affordable Care Act, cutting back on the Affordable Care Act, ad infinitum. The likelihood that our current debate will reach broad agreement and, in turn, encourage stakeholders to collaborate across the country to implement any initiative, is close to zero. How do we get out of this impasse?

Here is an approach that can work. Before debating structural solutions, let’s agree on goals. While we will not reach 100 percent agreement about healthcare objectives and major building blocks, we can come far closer than the current acute disagreement about structures. Then, building on shared understanding of goals, we can build policy initiatives that have bipartisan support and actually have a chance of working.

Three Shared Goals

The healthcare tripod: Access, efficiency, quality

Let’s start with a healthcare tripod of three goals that are likely to have broad-based support: access, efficiency, and quality.

Access: First, regardless of political affiliation, most people in the country want people to have access to health and healthcare services when they need them. This does not mean that everyone receives all services, all the time, every time that they want them. Instead, it means that services are as available as broadly as possible when people are ill and, even better, when they have opportunities to stay healthy. As part of this objective, there is general agreement that we want access to appropriate services to be timely, without long waiting periods. While there inevitably will be rationing of services—whether by price, queue, or some other rationing mechanism—most people in the country share the goal of providing broad-based access.

Efficiency: Second, we want the healthcare system to use money and other resources efficiently. We want reasonable outcomes for the investments and payments that we make to purchase healthcare goods and services, as well as the administrative support that manages healthcare activities. And most of us agree that the people and organizations involved in creating and providing healthcare good services—whether commercial, public, or nonprofit organizations—need enough financial return to be able to continue to operate. Although we may debate how much financial return is necessary, most will agree that net income is appropriate. As a slightly longer version of this goal, then, let’s call this the goal of profitable cost-effectiveness.

Quality: Third, we want products and services with a strong mix of quality, safety, and innovation, which we can short-hand as high healthcare quality. We want devices, medicines, clinicians, support staff, and other elements of healthcare that deliver what they are designed to do. We want use of the goods and services to be safe, without side effects and damage to our health. And we want an ongoing stream of innovations that provide new solutions to long-standing health and healthcare issues. Again, this is the goal of healthcare quality.

Not all people will agree that we should seek these three goals. But most people from across the political spectrum view these as desirable aspirations for the U.S. healthcare system. The three goals provide a base for designing a bipartisan solution.

Can we excel on all three goals?

Before we consider healthcare choices, let’s ask whether it is reasonable to seek to excel on all three goals. Or, instead, do we need to settle for doing well on one or two of the legs of the healthcare tripod, while giving up on another? For instance, do higher quality or better access inevitably mean lower cost-effectiveness?

One way to consider this question is to look at international data about health systems. The Commonwealth Fund regularly compares healthcare in multiple developed economies. [1] The details of the comparisons can be compiled in terms of the access, efficiency, and quality goals. [2]

The Commonwealth Fund data offer two insights: about U.S. performance and about potential compatibility of the three goals. First, since the beginnings of the rankings, in 2004, the U.S. health system has fared poorly. For the overall score in each year of the comparison, the U.S. has finished last. Moreover, the country has finished near the bottom on most of the individual access-efficiency-quality dimensions.

In 2017, with the most recent rankings of 11 countries, the U.S. finished last in overall scoring and access, tenth in administrative efficiency (ahead of only France), fifth in quality of care processes, and last in health outcomes. To achieve these dismal results, the U.S. spent the highest percentage of GDP on healthcare (17.2%), by far outstripping the number two country, Switzerland (12.3% of GDP). [3] Quite simply, the U.S. does badly in healthcare comparisons with international peers.

Second, we can look for correlations among the three goals across the eleven countries. Positive correlations would indicate that goals are compatible with each other. Negative correlations would suggest that trade-offs are common.

In practice, we find weak to strong compatibility among the three goals. When we correlate the compiled measures for access, administrative efficiency, and process quality across the 11 countries in 2017, none of the correlations are negative and all three are at least weakly positive: access-quality (0.01), efficiency-quality (0.18), and access-efficiency (0.56). One needs to be careful in interpreting the correlations—they are based on a small number of countries and report only associations, not causal relationships. Nonetheless, in the minimum, the relationships do not identify dominant trade-offs in which one goal tends to go down when another goes up. This pattern suggests that we can seek to improve on all three healthcare goals.

Do Sources of Healthcare Payment Correlate with the Goals?

Now let’s consider how health policy choices about sources of payment might relate to the three goals.

The core question of the debate about the U.S. healthcare system is what form of payment we should stress in the country. Strong-form proposals in the “Medicare for All” range seek a dominant role for public payment. Proposals in the realm of “Medicare for All Who Want It” offer a mix of increased public payment, with a major continuing role for private third-party payment such as through insurance offered through employment. Those who seek to cut back on the Affordable Care Act want to reduce public payment, with greater stress on private third-party insurance and out-of-pocket expense.

Share of payment by source: Public payer, private payer, out-of-pocket

Commonwealth Fund data offer an international snapshot of payment sources. Consider three sources: public, private third-party, and out-of-pocket payments. The U.S. is lowest in public share, highest in private third-party, and near the bottom in out-of-pocket payment.

Public payment: In the U.S., the public payment share through Medicare, Medicaid, the Veteran’s Administration, and other programs is substantial, at 49 percent in 2017. Nonetheless, the U.S. public share is substantially lower than in the ten international peers. [4] Switzerland is the second lowest, with 63 percent, while Germany and Norway have the highest share of public payment, at 85 percent.

Private third-party: Conversely, the U.S. ranks by far the highest in share of private third-party payment, at 40 percent in 2017. Canada is second, at 15 percent, while the private third-party share in Norway is less than 1 percent.

Out-of-pocket: Finally, out-of-pocket payment for deductibles, copays, and uninsured costs is near the bottom in the U.S., at 11 percent in 2017. France was the lowest, at 10 percent, while Switzerland was the highest, at 29 percent.

Hence, across countries, the three payment sources vary. In turn, it is worth investigating possible relationships with the three healthcare goals.

Let’s consider whether shares of the three types of payment sources across countries correlate with the healthcare goals. Again, we need to be cautious in interpreting these relationships. Nonetheless, with appropriate care, the correlations provide useful insights.

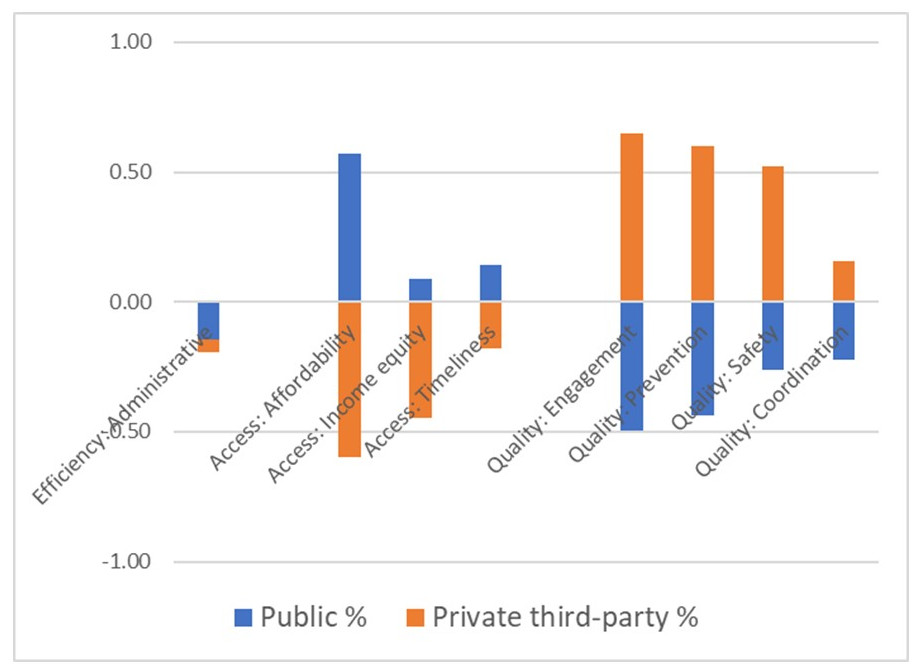
Figure 1 reports correlations of public and private payment shares with multiple aspects of the efficiency, access, and quality goals for the ten countries other than the U.S. The analysis focuses outside the U.S. in order to seek insights from alternative approaches to healthcare policy.

Figure 1. Correlations of Goals with Public and Private Payment Sources: 10 Countries

Source: Commonwealth Fund, 2017
Countries: Australia, Canada, France, Germany, Netherlands, New Zealand, Norway, Sweden, Switzerland, U.K.
Note: The figure does not report correlations with out-of-pocket payment, which have low relationships with the goals.


Efficiency: For administrative efficiency, there are only limited relationships with either public or private third-party share. Both correlations with efficiency are weakly negative. As a side note, the omitted case of out-of-pocket payment is weakly positive, which is consistent with research showing that copays improve system efficiency. [5]

Access: Now consider three aspects of healthcare access: affordability, income equity (how evenly different income levels have access to healthcare), and timeliness. Public share of payment has at least a weak positive correlation with all three measures of access. By contrast, private third-party share has negative relationships with all three elements of access.

Quality: Finally, consider four aspects of quality: engagement, prevention, safety, and coordination of care. Private third-party payment has at least weak positive relationship with quality, while public share has negative relationships with the quality measures.

The comparisons highlight a possible substitution between public and private payment. Strikingly, there may be a trade-off in which high share of public payment associates with improved access but may under-perform on key aspects of process quality.

We can speculate about two mechanisms that might underlie such a trade-off between access and quality. First, public payment, by design, provides access to people who lack other sources of payment. Second, third-party payers may provide higher average payments to providers or engage in more targeted relationships with providers and so provide resources and knowledge needed to invest in the processes that underlie higher quality healthcare services. While other mechanisms also may be relevant, these provide a useful baseline.

Other factors also may be relevant, such as a political pressure mechanism. It is possible that public systems tend to focus first on voters and their demands for broad-based access to healthcare services. By contrast, private third-party papers may be more responsive to people with severe illness because benefit managers do not want to risk someone with a catastrophic disease putting pressure on their employer to change insurers. [6]

Nonetheless, no matter what the mechanisms, is a trade-off of access and quality inevitable? If so, we are likely to remain at loggerheads in our health reform debates. Instead, if there is a way to gain the benefits of both the public and private forces, then we have opportunities to converge on two-part proposals that will advance the three goals.

Converging on Potential Solutions

What solutions might gain wins toward all three goals? For this question, the international comparisons provide only partial insights. The three countries in the Commonwealth Fund analysis with the highest combinations of access, efficiency, and quality are Australia, the Netherlands, and the U.K. Across those three countries, there are two very different patterns of payment shares. Australia has below-average public payment and above-average private third-party. The U.K. and the Netherlands have slightly above-average public payment and average or below-average third-party payment. Clearly, there are multiple paths to higher performance on the three goals.

What path might make sense for the U.S.?

One logical pathway in the U.S. is an extension of the current two-part system in a way that takes advantage of the strengths of both public payment and private third-party payment. Public payment appears to facilitate access, while private payment may offer resources and pressures for quality. Let’s consider reforms that combine these two benefits.

As a starting point, imagine a reform of the U.S. health system that built on the current combination of public and private payment. An expansion of broad-based public payment would provide access to people who lack desirable private payment. This is clearly a benefit. At the same time, though, the risk is that the public payment system would be so broad-based that it missed opportunities to fine-tune healthcare services for particular contexts.

Now add continued availability of private coverage for people who want and have access to that option. This has the potential to provide targeted features and so avoid the risk of over-standardizing care. Hence, a potential two-part solution is intriguing.

Risks of a two-part solution

But the two-part solution faces two risks, concerning short time horizons and divergent standards of care.

Time horizons: First, private third-party care often has short-term horizons, because people are likely to leave an insurance pool when they move or change jobs. Hence, private payers may under-invest in the life cycle of longer-term care. By contrast, in theory at least, public payment has greater incentive to consider the life cycle of care because the public payer will be on the hook for illnesses and issues that arise later in a person’s life.

Standards of care: Second, there is a risk that we would exacerbate some of the challenges of the current two-track health system in the U.S. Currently, those with stable employment often receive one standard of care, while those who rely on public coverage often receive a different standard of care. This may be acceptable to some people but is repugnant to many. A stronger solution would lead to similar high standards of care whether one receives public or private payments.

How can we address the two risks in a two-part payment system?

Consider two viable approaches to addressing these risks.

Time horizon challenge: The solution to the life-cycle horizon challenge that is common in private payment is to make it easy enough for people to switch between providers and payers if an alternative provider will provide superior life-cycle care for their needs. This might be a switch to a more suitable private payer. Or it might be a switch to a public payer that has greater incentive to consider longer-term horizons.

Standards of care challenge: A reassuring point is that the presence of different payment sources does not mean that patients receive different care from a provider. Indeed, research suggests similar approaches to treatment when providers care for both public and private third-party patients. [7] Hence, part of the challenge is to make sure that people have access to similar providers whether they are covered by public or private payers.

The knee-jerk approach here is to require the public system increase payments for coverage that providers are more willing to enroll patients from the public system. But, as we have seen, the U.S. already has high costs of healthcare. Simply adding to costs has real limits.

A stronger long-term solution is to allow providers that include patients from both public and private payer pools to take advantage of the scale of the public system and piggy-back contracts with vendors, such as pharmaceutical, lab test, supplies vendors, and other companies. This part of the solution creates strong incentives to combine public and private payer populations within providers, and so help provide consistent care.

So far, the two-part approach seems feasible. Yet the solutions we have discussed so far rest on two principles that need to be central to robust reform.

Two principles: Patients as decision-makers and information transparency

The solutions rest on the assumption that people can switch between providers. To make this possible, we need to adhere to two principles: patients as partners in healthcare decision-making, plus transparency of healthcare information.

Patients as partners

First, we have largely moved past the era of passive patients in which we expected physicians and other clinicians to tell us what healthcare services we need. Instead, there is increasing agreement that individuals want and need to be active partners in deciding what medical services they need and how to engage with the services. As active agents, people are more likely to identify appropriate services for themselves and their families. Perhaps even more importantly, active agents are more likely to follow up with relevant compliance and post-care activity—so that the healthcare services we consume have a chance of working well.

This first principle of patients as decision-makers is somewhat controversial, perhaps most commonly among clinicians. Some physicians resist viewing patients as decision-makers—even worse, as customers—fearing that they will shop for healthcare fads or over-consume healthcare services. Yet most health policy analysts expect better outcomes if patients are actively engaged in deciding what healthcare services to use and how to engage with their use.

Transparent information

Second, for people to make effective decisions, they need transparent information. We need information about the benefits and risks of different treatments in different contexts. We need comparative information about outcomes from different providers and institutions. We need information about prices that we will pay for services. Quite simply, if we have limited information about price and quality, we will not be able to be active decision-makers about healthcare services.

This second principle—of transparent information—is not controversial but is nowhere near present in current healthcare practice. Outcome information is obscure, at best. Pricing is often a surprise that shows up in bills after receiving medical services. The relative benefit of different healthcare treatments and health activities is often ambiguous. Even if we agree on the benefits of the principle of transparency, we are nowhere near achieving it. Indeed, achieving full transparency is unlikely, due to technical barriers in measurement. Yet, based on current technical status of healthcare services, we could achieve substantially greater clarity of healthcare prices, quality, and outcomes.

Looking Forward: Build Structural Solutions Around Shared Goals

Clearly, we need to develop potential solutions in more detail. In doing so, we need to encourage solutions that facilitate product innovations and organizational innovation that facilitate ongoing changes in the healthcare delivery system. The point here is that there are feasible structural solutions that are consistent with three widely shared goals, of access, efficiency, and quality. These are important parts of conversations in political debates, Congress, the administration, and state and local institutions.

The international comparisons provide starting points for thinking about a two-part solution to U.S. healthcare reform. In turn, the two principles—of increasing the role of patients as partners and providing greater transparency in information—provide the starting point for creating a robust two-part solution. The more that we can focus the debate on goals and principles, with the intent to approach a shared understanding of them, the more fruitful our ongoing discussion and implementation of structural reforms will be.


References

[1] In 2017, the 11 countries in the comparisons included Australia, Canada, France, Germany, the Netherlands, New Zealand, Norway, Sweden, Switzerland, the U.K., and the U.S.
See The Commonwealth Fund. Mirror, mirror 2017: International comparison reflects flaws and opportunities for better U.S. health care. 2017 July 14. https://interactives.commonwealthfund.org/2017/july/mirror-mirror/

[2] I use the following items from the Commonwealth Fund data to assess the three goals: access (equity, affordability, timeliness); cost-effectiveness (administration efficiency); quality (preventive care, patient engagement, coordination, safety).

[3] Tikkanen R. Multinational comparisons of health. The Commonwealth Fund 2018 December 3.
https://www.commonwealthfund.org/publications/other-publication/2018/dec/multinational-comparisons-health-systems-data-2018

[4] Tikkanen R, above.

[5] See Pauly M: https://pnhp.org/news/mark-pauly-cost-effectiveness-depends-on-cost-sharing/

[6] See Ogbechie-Godec OA, Wiske CP, Schulman KA. Decomposing the value of health insurance. Health Management Policy and Innovation 2019 May;4(1). https://hmpi.org/2019/04/21/decomposing-the-value-of-health-insurance/

[7] Mortensen K, Hu T, Vitale A, Kuttner H. Characteristics of providers serving Medicaid and private patients. Health Management Policy and Innovation 2018 October;3(2).
https://hmpi.org/2018/10/08/characteristics-of-providers-serving-medicaid-and-private-patients/


Private and Public Incentives for Hospitals to Improve the Quality and Reduce the Cost of Care

Xiaole Liu, Columbia University,  and Kevin Schulman and David Scheinker, Stanford University

Abstract

Contact: David Scheinker, PhD, dscheink@stanford.edu

Cite as: Xiaole Liu, Kevin Schulman, David Scheinker. 2019. Private and Public Incentives for Hospitals to Improve the Quality and Reduce the Cost of Care. Health Management Policy and Innovation, Volume 4, Issue 3.

The U.S. Needs a Hospital Quality-Cost Comparison Tool

Improving the quality of care while reducing spending is one of the few healthcare goals that enjoys near universal bipartisan political support. Hospitals account for over one third of all U.S. healthcare spending. [1] Yet a large percentage, over 50 percent by some estimates, of hospital spending growth results from price increases unrelated to the quality of the care provided and from wasted spending. [2, 3] The challenge, then, is to provide proper incentives for hospitals to improve quality and reduce costs. [4–10]

There are successful, though imperfect, examples of how such incentives may be driven by public and private sources of data. Hospital ratings programs such as the Center for Medicare and Medicaid Services Stars Rating System (public) and US News & World (private) are available. Hospital costs, though not prices, are available from sources including the CMS Cost Report (public) and the American Hospital Association Survey (private). This essay argues that a more reliable, comprehensive, and interactive hospital quality, cost, and price comparison tool should be developed and used to incentivize simultaneous improvement in all three areas.

We propose that, unlike current incentive schemes that focus primarily on quality or cost, hospitals should have competitive incentives to invest in structural operational improvements and contractual negotiations that also reduce price. We review empirical literature to argue that such incentives may be effective, but only if designed to account for differences in populations and prevent gaming. We document the availability of relevant data, identify data that must be made available, and demonstrate the feasibility of this approach with a proof-of-concept version of a quality-cost measurement tool. We use our tool to produce a simple, interpretable metric to incentivize competitive improvement. We conclude by proposing a public and a private incentive that a more mature version of such a tool would facilitate.

Evidence: Incentives Can Control Quality, Cost, and Price

Empirical studies suggest that hospitals can control quality, cost, and price when faced with the proper incentives. Laurence Baker provides evidence that vertical integration of hospitals and physician practices increases providers’ market power and results in higher hospital prices and spending. [4] James Robinson finds that based on market concentration, hospitals shift costs to private insurers facing Medicare shortfalls, while in competitive markets hospitals focus on cutting costs. [5] Chapin White shows that some high-price hospitals enjoy significant financial margins and high rankings while scoring low on some measures of quality, but that these are largely based on reputation as they belong to systems with large market shares. [6]

These and similar analyses, though sometimes controversial, accord with the widely accepted economic theory that firms facing limited competition will set prices to maximize profits. They also match empirical evidence that U.S. healthcare services, including those provided in hospitals, are priced significantly higher than those of other rich nations. [7,8] The analyses also accord with well-accepted economic theory and empirical observation that firms with pricing power have weaker incentives to control costs and are less effective at controlling costs.

If incentives are to be used to drive down costs and prices while improving quality, they must be designed to account for heterogeneous populations and potential gaming. Work by Ashish Jha and colleagues shows that the socioeconomic status of the patient population is strongly associated with hospital quality and must be considered when designing incentives. [9] They categorize hospitals into groups such as the “best” (high-quality, low-cost institutions) and the “worst” (low-quality and high-cost) and show that they serve markedly different populations, with the former serving significantly lower percentages of elderly black, Hispanic, and Medicaid patients.

Hamsa Bastani shows that hospitals are less likely to game incentives when performance is closely monitored. [10] They provide quantitative evidence that over 10,000 out of nearly 60,000 annually reimbursed claims for present-on-admission infections (18.5%) were misreported hospital-acquired infections resulting in an added cost burden of $200 million to Medicare and that the prevalence of misreporting is closely associated with the quality of monitoring. They develop a framework to create a more effective pay-for-performance mechanism.

Creating a Quality-Cost Comparison Tool

Sources of data

Meaningful comparison of the efficiency—including quality, cost, and price—of U.S. hospitals must account for the significant differences in the services provided and the populations served. A variety of the data necessary for comparing quality are publicly available although data about prices are lacking.

We produced a proof-of-concept tool using five publicly available sources of data that provide a relevant baseline for cost-quality measurement. Current sources include (1) The 2014–2017 Hospital Compare data, which is created by the Centers for Medicare & Medicaid Services and contains Hospital Compare Overall Hospital Quality Star Rating data; [11]  (2) the CMS Hospital Cost Report, which contains total cost variable of hospitals for fiscal year 2014 to 2017; [12] (3) the CMS Casemix File Hospital Inpatient Prospective Payment System, which contains hospitals case mix indexes representing the average diagnosis-related group relative weight for that hospital and number of cases for 2014–2017; [13]  (4) the CMS Market Basket data, which is also known as hospital input price index, reflecting input price inflation facing providers in the provision of medical services ;[14]  and (5) U.S. News 2018–2019 Best Hospitals Honor Roll, which listed 20 hospitals. [15]

More precise estimates of quality and cost could be developed using detailed state-specific data sources such as OSHPD, which produces datasets and data products in topics including Cost Transparency and Healthcare Quality, [16] as well as several proprietary national data sources such as the MarketScan Databases, which track millions of patients throughout the healthcare system; [17] the American Hospital Association Annual Survey, which contains data on hospital characteristics such as operations and expenses; [18] and the Agency for Healthcare Research and Quality, which contains encounter-level information on inpatient stays, emergency department visits, and ambulatory surgery in U.S. hospitals. [19] If enacted, a recently proposed rule from the Department of Health and Human Services would make available the prices hospitals charge private insurers. [20]

Proof-of-concept: An interactive quality-cost comparison tool

We produced an interactive tool for comparing hospital efficiency based on costs adjusted for case mix, hospital input price index, and inflation and quality as measured by the CMS star-rating system. If price data were available, these would be an important additional value to incorporate into the tool or to replace cost; institutions remain viable only if their costs are lower than their prices. Figure 1 shows, at the hospital level, the time trend from 2014 to 2017 of the relationship between cost and quality for those hospitals that improved their rating while increasing costs and those hospitals that maintained the highest possible star rating while decreasing costs.

Figure 1.

Top: Hospitals that improved their CMS star rating while increasing costs.
Bottom: Hospitals that had a star rating of 5 for all years and decreased costs.

This tool provides a baseline of quality-cost measurement. The tool allows for real-time, interactive comparison of quality ratings and hospital costs as well as changes over time in quality and cost. The tool allows for relevant peer-to-peer comparison by allowing the user to filter, in real time, for hospitals in a given region, of a certain size, and from a specific list. Selecting or zooming in on the points or lines corresponding to a specific hospital or searching for a hospital by name reveals more detailed information. For instance, in Figure 1, the highlighted hospital, Summit Medical Center in California, saw an increase from 2014 to 2017 in its case mix adjusted costs per day with an increase in its CMS quality star rating.

The appendix depicts examples of the potential of the tool to identify highly performing hospitals include hospitals that: (1) made the U.S. News 2018–2019 Best Hospitals Honor Roll and (2) improved their star rating while decreasing costs. These visual and underlying algorithmic analyses reveal quality-cost relationships and allow for meaningful comparisons. For example, The Mayo Clinic in Rochester, Minnesota is consistently ranked as one of the top-performing hospitals in the country and was identified by the interactive tool as having maintained a 5-star rating for all years while decreasing costs.

An interpretable quality-cost metric

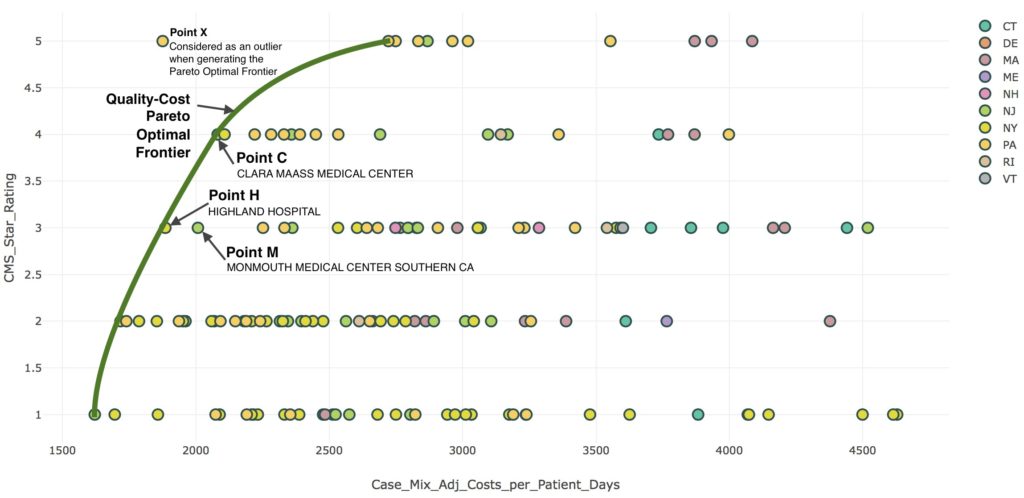
Comparing hospital efficiency using quality, cost, and price may allow for a single, hospital-specific metric that approximates the potential for a given hospital to improve and can be used to identify specific opportunities for improvement. We propose categorizing a hospital as highly efficient (HE) if, when compared to an appropriate peer group, its quality and cost performance is Pareto optimal, meaning that no other hospital has both better quality and lower costs. We propose using the tool to define, for each appropriate peer group, the HE hospitals whose performance constitutes the Pareto-optimal frontier. For each non-HE hospital, the opportunity to improve is defined as the average of the cost and quality differences to the three closest HE hospitals. This metric quantifies the magnitude of improvement a hospital should strive for. The practices of the HE hospitals identified in the comparison provide a guide for potential improvement efforts.

Figure 2 depicts this metric for hospitals in the Northeast with 200 to 500 beds. The Pareto-optimal cost-quality frontier is shown with a green line. This frontier excludes an exceptionally efficient, high-quality hospital X, which the figure reports as an outlier. Hospitals H (Highland Hospital) and C (Clara Maass Medical Center) are on the Pareto-optimal quality-cost frontier since no hospital has both higher quality rating and lower costs. Hospital M (Monmouth Medical Center) is not on the frontier since it has higher costs or lower quality rating than each of these. Correspondingly, Hospital M should face incentives to invest in operational changes that allow it to reduce costs and improve quality, while containing costs, to move toward an operational profile similar to that of hospitals H or C.

Figure 2 Quality-cost Pareto optimal frontier for hospitals in the Northeast with 200-500 beds

Incorporating prices into the metric

The current tool incorporates only costs since hospital-specific private insurance price data generally are not publicly available. If price data become available, as has recently been proposed by the Department of Health and Human Services, the tool would have the options for using cost or price for the x-axis. [20] If private and public insurers, patient advocacy groups, and employers have direct access to price data, they could more effectively incentivize hospitals to pass cost savings on in the form of lower prices.

Looking Forward: Public and Private Incentive Schemes

Given a metric to guide hospitals on how to improve efficiency, there are numerous potential public and private schemes to incentivize hospitals to do so. Public and private payers already make efforts to incentivize efficiency improvements. The CMS Merit-based Incentive Payment System and Advanced Alternative Payment Models tie hospital payments to quality and cost metrics. Health insurance companies negotiate with hospitals to reduce unnecessary care and guide patients toward lower-cost providers. Both types of efforts could benefit from an analytical approach more focused on systemic efficiency improvements.

This proposal has bipartisan appeal. There is political consensus on the need to reduce healthcare spending without compromising quality. Academic and professional literature identify the most viable approaches as targeting improvements in prices, waste, and efficiency. A number of Democratic proposals favor increasing competition through the use of a public option or pricing schemes that will exert downward pressure on hospital prices and insurance premiums. [20,21] A number of Republican proposals favor the same goal through price-transparency. [22] There is even bipartisan legislation around regulating pricing practices. [23,24]

Outside of healthcare, firms differentiate goods and services such as cars and flights based on price and quality. In competitive markets, firms offering non-Pareto-optimal goods and services such as lower-quality, more expensive cars are either driven to improve or forced out of the market. Creating incentives for hospitals to compete on quality, cost, and price would produce dynamics comparable to those that emerge naturally in competitive markets. Such a market-inspired approach should find support across the political spectrum.


References

[1] CMS.gov, National Health Expenditures 2017 Highlights. Centers for Medicare & Medicaid Services, available at:https://www.cms.gov/Research-Statistics-Data-and-Systems/Statistics-Trends-and-Reports/NationalHealthExpendData/Downloads/highlights.pdf. Accessed on 10/13/2019.

[2] Dieleman JL, et al. Factors associated with increases in U.S. health care spending, 1996–2013. Journal of the American Medical Association 2017;318(17):1668-1678.

[3] Shrank WH, Rogstad TL, Parekh N. Waste in the U.S. health care system: Estimated costs and potential for savings. Journal of the American Medical Association 2014;315(16):1750-1766.

[4] Baker LC, Bundorf MK, Kessler DP. Vertical integration: Hospital ownership of physician practices is associated with higher prices and spending. Health Affairs 2014;33(5):756-763.

[5] Robinson, J., 2011. Hospitals respond to Medicare payment shortfalls by both shifting costs and cutting them, based on market concentration. Health Affairs 2011;30(7):1265-1271.

[6] White C, Reschovsky JD, Bond, AM. Understanding differences between high- and low-price hospitals: Implications for efforts to rein in costs. Health Affairs 2014;33(2):324-331.

[7] Anderson GF, Reinhardt UE, Hussey PS, Petrosyan V. It’s the prices, stupid: Why the United States is so different from other countries. Health Affairs 2003;22(3):89-105.

[8] Anderson GF, Hussey P, Petrosyan V. It’s still the prices, stupid: Why the U.S. spends so much on health care, and a tribute to Uwe Reinhardt. Health Affairs 2019;38(1):87-95.

[9] Jha AK, Orav EJ, Epstein AM. Low-quality, high-cost hospitals, mainly in south, care for sharply higher shares of elderly black, Hispanic, and Medicaid patients. Health Affairs 2011;30(10):1904-1911.

[10] Bastani H, Goh J, Bayati M. Evidence of upcoding in pay-for-performance programs. Management Science 2018;65(3):955-1453.

[11] Medicare.gov. Hospital Compare Website. Hospital Compare Datasets, the Centers for Medicare & Medicaid Services 2019. Available at: https://data.medicare.gov/data/hospital-compare.

[12] The National Bureau of Economic Research. Healthcare Cost Report Information System (HCRIS) data. The Centers for Medicare & Medicaid Services 2019. Available at: https://www.nber.org/data/hcris.html.

[13] The National Bureau of Economic Research. CMS casemix file hospital Inpatient Prospective Payment System (IPPS),” the Centers for Medicare & Medicaid Services 2017. Available at: https://www.nber.org/data/cms-casemix-file-hospital-inpatient-prospective-payment-system-ipps.html.

[14] CMS.gov. Market basket data. Centers for Medicare & Medicaid Services 2019. Available at: https://www.cms.gov/Research-Statistics-Data-and-Systems/Statistics-Trends-and-Reports/MedicareProgramRatesStats/MarketBasketData.html.

[15] U.S. News & World Report. U.S. News 2018–19 Best Hospitals Honor Roll. U.S. News & World Report August 14, 2018. Available at: https://www.usnews.com/info/blogs/press-room/articles/2018-08-14/us-news-announces-2018-19-best-hospitals.

[16] California’s Office of Statewide Health Planning and Development (OSHPD), 2019. Available at: https://oshpd.ca.gov/data-and-reports/.

[17] IBM MarketScan Research Databases. Available at: https://www.ibm.com/us-en/marketplace/marketscan-research-databases. Accessed on 09/23/2019.

[18] AHA Annual Survey Database™, 2019, American Hospital Association. Available at: https://www.ahadata.com/aha-annual-survey-database-asdb/.

[19] Healthcare Cost and Utilization Project, 2018, HCUP Databases. Agency for Healthcare Research and Quality 2018. Available at: https://www.hcup-us.ahrq.gov/databases.jsp. Accessed on 09/23/2019.

[20] Uhrmacher K, Schaul K, Firozi P, Stein J. Where 2020 Democrats stand on Medicare-for-all. The Washington Post 2019 December 2. Available at: https://www.washingtonpost.com/graphics/politics/policy-2020/medicare-for-all/.

[21] Nisen M, He E. The Democrats are fighting for your health in 2020. Bloomberg 2019 October 14. Available at: https://www.bloomberg.com/graphics/2019-opinion-democratic-presidential-medicare-debate/.

[22] 21st Century Cures Act: Interoperability, information blocking, and the ONC health IT certification program. A proposed rule by the Health and Human Services Department 2019 April 3. Available at https://www.federalregister.gov/documents/2019/03/04/2019-02224/21st-century-cures-act-interoperability-information-blocking-and-the-onc-health-it-certification. Accessed on 09/23/2019.

[23] Huetteman E. Legislation to end surprise medical bills has high public support—in both parties. Kaiser Health News 2019 September 12. Available at: https://khn.org/news/legislation-to-end-surprise-medical-bills-has-high-public-support-in-both-parties/.

[24] KHN Morning Briefing. Long-awaited drug pricing bill from Senate Finance Committee would cap Medicare ‘Part D’ copays for first time. Kaiser Health News 2019 July 24. Available at: https://khn.org/morning-breakout/long-awaited-drug-pricing-bill-from-senate-finance-committee-would-cap-medicare-part-d-copays-for-first-time/.


Appendix

Figure A1. Hospitals that were U.S. News 2018-19 Best Hospitals Honor Roll

Figure A2. Hospitals that improved their CMS star rating while reducing costs

Mandate Outcomes Reporting

Robert S. Kaplan and Michael E. Porter, Harvard Business School

Abstract

Contact: Robert Kaplan rkaplan@hbs.edu 

Cite as: Robert S. Kaplan, Michael E. Porter. 2019. Mandate Outcomes Reporting. Health Management Policy and Innovation, Volume 4, Issue 3.

Problem and Solution: Limited Measurement of Health Outcomes

Variation in health outcomes

Currently, wide variation exists in the outcomes produced by healthcare providers when treating patients for the same medical condition. This wide variation, though documented in peer-reviewed literature, remains hidden to patients, payers, and even most providers. The lack of outcomes measurement leads to four problems.

  • Attempts to introduce price transparency without outcomes transparency could trigger a “race to the bottom.”
  • Should Medicare coverage be expanded to non-elderly populations, as currently advocated by several Democratic presidential candidates, its much lower reimbursements will create pressure on providers to lower their spending in ways that produce even worse outcomes.
  • Even without Medicare expansion, the lack of systematic outcomes measurement has made the migration from fee-for-service to value-based reimbursements, especially bundled payments, less effective and more difficult to implement.
  • Hidden variation in outcomes prevents providers from learning from others how to produce better outcomes for their patients.

Proposed solution

The solution to this problem is straightforward. Healthcare providers and other stakeholders need to begin the process of measuring and reporting outcomes that matter to patients. Since such outcomes are, in general, condition specific, the process must set priorities for the conditions for initial implementation of mandated outcomes reporting.

Background: Measuring Healthcare Activity—From Inputs to Outcomes

Measuring inputs, processes, and incidence of harm

Outcomes measurement has made limited progress in the 100+ years since Dr. Ernest Codman advocated that “every hospital should follow every patient it treats, long enough to determine whether or not the treatment has been successful.” [1] Historically, hospitals responded not by measuring outcomes but by measuring the quality of inputs used to treat patients. Input measures included the qualifications of physicians, such as board certification, staffing ratios, and types of equipment and operating rooms available. These measures helped to ensure that patients were treated by qualified clinicians at facilities appropriately staffed and equipped for their conditions, but they did not assess the treatments’ success.

During the 1990s, healthcare introduced process metrics, such as checklists that measured compliance and conformance to evidence-based treatment protocols. The compliance and process metrics helped to standardize care for patients with similar conditions, and improved patient treatments. But as with input measures, they failed to create transparency and accountability on whether the treatments alleviated or cured the condition that caused patients to seek care.

More recently, with leadership from the Centers for Medicare and Medicaid Services (CMS) and the American College of Surgeons NSQIP (National Surgical Quality Improvement Program), providers have begun to systematically track the condition-specific incidences of harm to patients through safety incidents, medical errors, complications, infections, and readmissions. [2] These “do not harm” metrics helped track and lower the adverse consequences to patients seeking care, and have improved this aspect of care quality.

The next step: Measure outcomes that matter to patients

Input, conformance, process quality, and “do no harm” metrics fall short of Codman’s goal to measure whether the patient’s treatment “has been successful.” After all, patients seek treatment not to have standardized, evidence-cased care, or to avoid medical errors, infections, and readmissions. Patients seek care for muscular-skeletal pain to have the pain alleviated and restore their ability to resume normal activities of daily life, including work, exercise, and recreation. Patients who seek treatment for prostate cancer are interested in survival and the duration of remission, and in avoiding adverse side effects such as incontinence, impotence, and bowel disorders.

Outcomes that matter to patients must be measured at the condition level, not at the level of a hospital, health system, health plan, or population. [3] The relevant outcome metrics for patients being treated for prostate cancer are different from those being treated for breast cancer, diabetes, spinal stenosis, or coronary artery disease. Some of the outcomes that matter to patients can be measured clinically, such as strength, range of motion, mobility, and absence of detectable cancerous cells. But many outcome measures must come from the patients themselves.

Patients care the most about outcomes such as functionality, pain, mental health, and ability to return to normal activities. Patient-reported outcomes provide the crucial feedback about whether “the treatment has been successful.” Patient-reported outcomes also give patients the potential to have a voice in their own care and identify progress on the outcomes most important to them. [4]

Unfortunately, measuring condition-specific outcomes has been challenging along several dimensions, which is why it has yet to be done broadly and systematically. Unlike the mass production of standardized products, such as automobiles or electronic devices, healthcare outcomes depend on patients’ individual circumstances including presenting disease severity, age, obesity, substance use, demographics, socioeconomic status, comorbidities, and adherence. Fortunately, the increased availability of electronic health records and sophisticated data analytics will make it easier to calculate condition- and patient-specific risk-adjustments. As inter-operative data sharing becomes widespread, the risk adjustment can be done using all a patient’s medical, pharmacological, and socioeconomic information.

Nonetheless, while difficult, determining the appropriate risk-adjustments for patient outcomes at the medical condition level has already been accomplished in some conditions. Key examples include treating conditions requiring organ transplants and several types of surgeries. Strikingly, as these outcomes data become publicly available, patient outcomes improve.

The payer for any service, including the government, has the right to receive feedback on the quality and effectiveness of the service it has purchased. Broader and more robust measurement and reporting of outcomes is the most important feedback for those paying for healthcare services.

Bipartisan Reform Proposal

We propose that the Congress elected in November 2020 mandate the Centers for Medicare and Medicaid Services to begin requiring outcomes measurement by all providers reimbursed under government Medicare and Medicaid programs. CMS should begin by selecting an initial set of medical conditions for mandatory outcomes reporting to start in calendar year 2023, with optional reporting starting one year earlier.

Relevant conditions

The medical conditions for initial reporting should satisfy the following four properties:

  1. High current spending for treating the condition. CMS can identify the top 20 or top 50 conditions on which it is currently spending the most and select from that set.
  2. Standardized instruments already exist to measure clinical, functional, and patient-reported outcomes for treating the condition. Many high-volume conditions already have standardized outcomes sets developed by the International Consortium of Health Outcomes Measurement (ICHOM) and medical societies, such as Society of Thoracic Surgeons and American College of Surgeons.
  3. Evidence-based pathways are present for successfully treating or mitigating the condition. Measuring outcomes for a condition without evidence-based pathways, such as Alzheimer’s disease, is not likely to yield better patient outcomes. In contrast, as an example, extensive evidence already exists for treating patients with type 2 diabetes.
  4. Outcomes measurement will have immediate impact. The improved outcomes from effective treatment of the condition occur within periods measured in months, not years or decades.

Implementation

Implementing this proposal is straightforward. CMS, advised by committees of physicians, other caregivers, payers, patients, and patient advocates, will select the standardized outcomes to be measured for the initial set of conditions. It will, for each condition, select the measurement instruments including patient survey questions, and technology to facilitate the patients’ responses. CMS will, advised by expert clinical committees, develop the preliminary risk adjustments for the condition, enabling the outcomes to be interpreted and compared for patients with similar risk characteristics and across different patient populations.

Benefits of Mandated Outcomes Reporting

Mandating outcomes reporting will substantially improve healthcare practices. The reports will encourage providers and clinicians to take ownership for their results and to manage the patient’s complete cycle of care for chronic and acute care conditions. With transparency and accountability for their outcomes, providers and clinicians will be motivated to align and integrate their care prior to and subsequent to their principal treatment event. In that way, patients would be better prepared for the actual treatment, and providers will help patients become more compliant with their recovery and maintenance of health subsequent to the actual treatment. Providers could also adjust treatment protocols for the social determinants of health that influence successful outcomes.

Four benefits of universal outcomes measurement

  1. Improve care delivery. Providers and clinicians will receive actual evidence of the quality of care they deliver and how it compares to others. This will enhance the incentive to organize multi-disciplinary teams to deliver integrated and comprehensive care that improves patient outcomes.
  2. Best practices. Best practices, condition-by-condition, could be identified and transferred to those currently delivering poorer outcomes.
  3. Transparency. Patients and payers would have far greater transparency when seeking the best providers for treating their condition.
  4. Value-based payments. CMS, employers, and private health plans could rapidly implement new reimbursement models, such as outcomes-contingent bundled payments, [5] to pay for treatments of covered conditions.

These benefits will lead to major improvements. Mandated reporting will greatly reduce the currently high variation in patient treatments and outcomes. The convergence to best practices will dramatically improve patient outcome. It will also, through fewer complications, readmissions, and revision treatments, significantly lower society’s total healthcare costs.

Bipartisan appeal

Outcomes reporting is not ideological. Transparency and accountability for outcomes is a goal that all citizens, providers, payers, and politicians should care about. It should not depend upon whether the 2020 election yields a Democratic, Republican, or mixed administration.

Market-oriented Republicans believe that competition improves performance—greater value to consumers at lower cost—of companies in any industry. They should welcome the value-based competition stimulated among providers to improve the outcomes that patients receive. Republicans should also value the expanded opportunities for informed consumer and employer choice in how they select providers for treating a specific medical condition.

Democrats want to reduce inequities in the quality of care currently received by low-income, marginalized, and high-risk populations. They should welcome the opportunity to validate that the poor and unemployed are treated by providers who deliver excellent outcomes. When providers improve their outcomes by delivering integrated and accountable care, the effective capacity of the healthcare system expands, allowing greater access at lower cost to currently disadvantaged populations.

Looking Forward: Mandate Outcomes Reporting

Mandating outcomes-based reporting should be independent of whether the U.S. shifts to some version of a Medicare-for-all funding scheme or maintains the existing public-private system. All payers, whether public or private, will benefit enormously when they receive quantitative data on the outcomes their patients achieve. Universal reporting and measurement of patients’ condition-specific outcomes is the single most important step the U.S. government can take to improve the access, cost, and quality of healthcare delivery.


References

[1] Codman EA. A study in hospital efficiency: As demonstrated by the case report of the first five years of a private hospital. Boston: Th. Todd Co.; 1918.

[3] Porter ME. What is value in health care? New England Journal of Medicine 2010 December 23;363(26):2477-2481.

[4] Pusic AL et al. Patient-reported outcome measures in plastic surgery: Use and interpretation in evidence-based medicine. Plastic Reconstruction Surgery 2011 March;127(3):1361-1367.

[5] Porter ME, RS Kaplan. How to pay for health care. Harvard Business Review 2016 July-August 2016;94(7-8):88-98, 100, 134.


A Public Option Can Be a Triple Win for U.S. Healthcare

Regina Herzlinger, Professor, Harvard Business School and Richard Boxer, Professor, UCLA School of Medicine

Abstract

Contact: Richard Boxer rboxer@mednet.ucla.edu

Cite as: Regina Herzlinger, Richard Boxer. 2019. A Public Option Can Lower U.S. Healthcare Costs while Improving Access and Quality. Health Management Policy and Innovation, Volume 4, Issue 3.

A Public Option Will Help Achieve Efficiency, Quality, and Access to Healthcare

The United States needs to control healthcare costs and quality while reaching universal coverage. The strongest choice is a public option that allows people to choose between Medicare and private payers. But a public option needs sustainable financing mechanisms that allow fair competition with private insurers.

This article explains why universal care coverage is important and outlines principles that will allow a public option and private insurance firms to compete appropriately. In turn, sustainable competition will expand access and improve cost and quality. These arguments extend a recent article by Regina Herzlinger and Richard Boxer. [1]

Universal Coverage: Life or Death

Universal healthcare coverage is necessary in the United States. Americans without healthcare coverage commonly die, go bankrupt, or unnecessarily become disabled. Others stay in bad jobs because they offer insurance. Despite paying a higher proportion of GDP than any other nation and creating world-class medical resources, the U.S. has the highest rate of preventable deaths among developed nations. [2]

Universal coverage has a long history throughout the world, beginning in the 1880s in Germany and then expanding across Western and Eastern Europe, Latin America, Africa, Asia, and Canada. These universal coverage systems involve multiple combinations of public, nonprofit, and for-profit payers.

In the 1960s, the U.S. introduced publicly financed coverage for those over 65 through the Medicare program and partial coverage for the low-income population through Medicaid, but remained the only exception among developed countries in ensuring population-wide coverage. Finally, in 2010, Congress passed the Affordable Care Act (ACA)—not full coverage, but a significant reduction in the 45 million Americans who lack insurance.

The ACA has had real successes. From 2008 to 2016, the uninsured percentage of the population declined from 17 percent to 10 percent. [3] Medical expenses cause fewer financial shocks. [4] Early data suggest that the ACA is helping make Americans healthier and more secure. [5]

But the ACA also has problems. Many people have found that they unexpectedly needed to switch plans or doctors. For the 14.7 million insured through Medicaid, the Oregon Health Insurance Experiment reported improvements in mental health status, but no effect on health status. [6, 7] Many cannot afford coverage, as premiums on ACA exchanges rose by 26 percent. Many face high deductibles. [8] Because few insurers offer ACA policies, there is little pressure to reduce prices and out-of-pocket expenses, or to provide wide choices of providers. [9]

Americans are reasonably clear about what they need and want from healthcare reforms. They want lower premiums and out-of-pocket costs, from multiple competing insurers. They want coverage of pre-existing conditions, no lifetime caps, and for parents’ policies to cover children to 26 years old. [10, 11] The best way to achieve these goals is a public option that would allow Americans to select either private or public coverage from insurers that compete on an even playing field.

How a Public Option Will Be a Win for U.S. Healthcare

For the public option to improve healthcare affordability and provide better access to quality providers, in parallel with continued private insurance, the public component requires rates based on credible investment costs plus accurate cost accounting.

Medicare is hugely popular yet financially unsustainable. The program satisfies 85 percent of Medicare members. [12] But beneficiaries pay only a limited share of the costs as, on average, beneficiaries receive $310,000 more in benefits than they pay. [13] At last count, $37 trillion in expenses have been shifted to the future. [14] The Galen Institute calculates that the Medicare deficit is a third of the annual U.S. federal debt. [15]

Despite the financial challenges, Medicare’s scale creates efficiencies. Medicare’s administrative costs are up to seven times lower than private insurers. [16] The program’s market power allows it to pay hospitals 40 percent less and providers 2 to 3.5 times less than private insurers for equivalent services. [17] Although some believe that providers simply shift Medicare and Medicaid’s unpaid costs to private payers, the claim of cross-subsidization does not appear to hold. [18] Instead, Medicare’s pressure appears to help cut one third of healthcare costs that experts often view as unnecessary. [19]

A public option can leverage Medicare’s efficiencies. To be sustainable, though, it needs to avoid financing subsidies that have shifted Medicare costs into the future and created an uneven playing field for competition with private insurers.

To ensure sustainable competition among insurers, public-financing norms must match private insurers in three ways. First, a public option must be financed by current users—like private insurance, it needs to be pay-as-you-go. Second, public-option accounting needs to encompass all relevant expenses, such as liabilities for Medicare employees’ post-retirement benefits. Third, just as private insurers must pay to build infrastructure, a public option must account for investments in Medicare’s buildings, equipment, and workers. To make this work, a public option’s financial statements needs to be audited in the same way as those of private insurers.

With a level playing field, a public option would create appropriate competitive pressures for private insurers to improve pricing, service, and quality. Insurers might offer lower-cost policies that bring people in high-cost locations to receive services in lower-cost, high-quality locations such as Utah. Or, like Ashley Furniture has done, they might send enrollees to lower-cost Mexico for orthopedic procedures, including sending an American surgeon who was well paid for her services. [20] To help private insurers gain efficiencies, new legislation should permit bundles of health, life, casualty, disability, and other products, as well as the ability to sell policies in multiple states. These expansions would enhance competition among payers—helping reduce costs, increase access to coverage, and improve care quality.

One viable approach would be for the United States to follow Germany, Switzerland, and the Netherlands, which achieve high-quality universal coverage while emphasizing non-government payers and spending far less than the U.S. on healthcare. [21, 22] These three countries are stronger fiscally than nations such as Canada and the United Kingdom that rely more heavily on single-payer health insurance systems. But such models, which typically give people vouchers to purchase private insurance policies, would be politically untenable in the U.S. because the proposals would eliminate highly popular Medicare.

Looking Forward: The Public Option

The public option is a reasonable alternative approach for the United States. It allows choice between Medicare and private insurers, while creating incentives to control costs and increase quality. To achieve the public option will require legislative and administrative discipline along with independent oversight that ensures the public option reaches these objectives appropriately.


References

[1] Herzlinger R, Boxer R. The case for the public option over Medicare for all. Harvard Business Review 2019 October 10.

[2] https://www.thelancet.com/journals/lancet/article/PIIS0140-6736(18)30994-2/fulltext

[3] https://www.kff.org/uninsured/fact-sheet/key-facts-about-the-uninsured-population/

[4] https://www.nber.org/papers/w22170

[5] https://jamanetwork.com/journals/jamainternalmedicine/fullarticle/2542420

[6] https://www.nejm.org/doi/full/10.1056/NEJMsa1212321

[7] https://www.nber.org/papers/w17190

[8] https://www.healthcare.gov/glossary/high-deductible-health-plan/

[9] https://www.kff.org/health-reform/issue-brief/insurer-participation-on-aca-marketplaces-2014-2019/

[10] https://www.kff.org/health-reform/poll-finding/kff-health-tracking-poll-july-2019/

[11] https://www.pollingreport.com/health.htm

[12] https://www.ncbi.nlm.nih.gov/pmc/articles/PMC4193523/

[13] https://www.urban.org/sites/default/files/publication/99232/social_security_and_medicare_lifetime_benefits_and_taxes_2018_update.pdf

[14] https://www.govinfo.gov/content/pkg/CHRG-112hhrg67303/html/CHRG-112hhrg67303.htm

[15] https://www.forbes.com/sites/gracemarieturner/2019/05/03/the-lefts-utopian-health-care-promises/#5756b2712d60

[16] https://urldefense.proofpoint.com/v2/url?u=http-3A__cepr.net_blogs_cepr-2Dblog_overhead-2Dcosts-2Dfor-2Dprivate-2Dhealth-2Dinsurance-2Dkeep-2Drising-2Deven-2Das-2Dcosts-2Dfall-2Dfor-2Dother-2Dtypes-2Dof-2Dinsurance&d=DwMF-g&c=UXmaowRpu5bLSLEQRunJ2z-YIUZuUoa9Rw_x449Hd_Y&r=gtZnG0rPAGsWKoErSh9xcEVXTELCexX33pQ1FKJCQrM&m=HGBWgDYaiN81T2EYdEmqyvWA1IeHJjrflbBbdPDhJGE&s=5ZAca2tVVBx67u0iHcsb22l782rtwOvs-_Lp7dV2ha8&e=

[17] https://urldefense.proofpoint.com/v2/url?u=https-3A__www.cbo.gov_system_files_115th-2Dcongress-2D2017-2D2018_presentation_52818-2Ddp-2Dpresentation.pdf&d=DwMF-g&c=UXmaowRpu5bLSLEQRunJ2z-YIUZuUoa9Rw_x449Hd_Y&r=gtZnG0rPAGsWKoErSh9xcEVXTELCexX33pQ1FKJCQrM&m=HGBWgDYaiN81T2EYdEmqyvWA1IeHJjrflbBbdPDhJGE&s=x4P27lahHb68xG1-3KRZN-6oVXCggzdE9u0bhBSiU0w&e=

[18] https://newsatjama.jama.com/2017/01/04/jama-forum-hospitals-dont-shift-costs-from-medicare-or-medicaid-to-private-insurers/

[19] https://jamanetwork.com/journals/jama/fullarticle/1148376

[20] https://khn.org/news/to-save-money-american-patients-and-surgeons-meet-in-cancun/

[21] https://www.commonwealthfund.org/press-release/2017/new-11-country-study-us-health-care-system-has-widest-gap-between-people-higher

[22] https://regiherzlinger.blogspot.com/2019/09/budget-debt-results-of-public-vs.html


Slowing Health Spending Growth and Expanding Coverage: A Bipartisan Solution

Joseph Antos, Wilson H. Taylor Scholar in Health Care and Retirement Policy, American Enterprise Institute

Abstract

Contact: Joseph Antos JAntos@AEI.org

Cite as: Joseph Antos. 2019. Slowing Health Spending Growth and Expanding Coverage: A Bipartisan Solution. Health Management Policy and Innovation, Volume 4, Issue 3.

The Next Health Reform Should Build on Our Mixed Private/Public Insurance System

A common theme leading up to the 2020 election is that the Affordable Care Act (ACA) should be repealed and replaced. The political extremes of the Republican and Democratic parties want to repeal the ACA, but for opposite reasons. Republicans believe the ACA went too far in expanding government control over private insurance markets. Democrats think the law did not go far enough. Starting over again, either through a Supreme Court decision in Texas v. United States that makes the ACA unconstitutional or through future legislation that replaces the ACA with Medicare for All or some variant of a single-payer system, is the common element supported by those furthest from the political center. Neither approach leads to a reformed system that could gather wide public support.

Whatever the motivation, ripping out the current system by the roots is not a formula for real reform of our health system. To achieve lasting bipartisan support, the next health reform should build on our mixed private/public insurance system and focus on specific policies that can help slow unnecessary growth in health spending, expand insurance coverage, and promote better health—not just more insurance—for all Americans.

Extreme Proposals Would Not Work

There is broad public agreement, regardless of one’s political views, about the goals of health reform. Health insurance should be affordable and accessible for everyone, including those with pre-existing health conditions. Healthcare should also be affordable in terms of the out-of-pocket costs families pay net of insurance benefits. Low-income families should be given financial support for their health costs. The health system should be oriented to produce value over volume. Policies should promote efficiency, quality of care, and medical innovation.

These goals all require processes that spur improvement and resolve problems as progress is being made. The most important goals are works in progress rather than simple metrics that can be met with simple one-time solutions. Substantial reforms require significant changes in the business and practice of medicine. Although policy analysts often talk about needing to disrupt the system, the average American is not eager to have his or her own insurance and medical arrangements disrupted.

Affordable Care Act repeal?

Republicans faced these issues in attempting to agree on an ACA replacement plan in 2017 that would reduce federal control over insurance markets, give states more flexibility in running their Medicaid programs, and promote greater consumer choice and responsibility. They developed numerous proposals to repeal, defund, or delay provisions of the ACA. Despite majorities in both houses of Congress, only the ACA’s individual mandate was repealed as part of the Tax Cuts and Jobs Act. [1]

A major reason for the lack of consensus among congressional Republicans was the impact of new reforms on popular ACA provisions, including pre-existing conditions protections and other policies that expanded insurance coverage. The Congressional Budget Office predicted that Republican proposals would reduce ACA protections for those with pre-existing conditions, significantly reduce funding to states for Medicaid, and increase the number of uninsured. [2]

The prospect that the courts might declare the ACA unconstitutional in Texas v. United States poses a painful, if unlikely, challenge for Republicans during the upcoming election campaign. [3] Public support for major ACA insurance provisions such as the exchanges, insurance subsidies, and the Medicaid expansion remains strong. [4] Health costs are a top issue for voters, regardless of party, and significant disruption would raise fears that insurance might become less available and more expensive. [5]

Medicare for All?

Leading Democrats seeking their party’s presidential nomination have adopted their own versions of repeal and replace in the hope of winning primaries that largely attract voters with more extreme policy views than average. Senator Bernie Sanders’ Medicare for All (M4A) plan would eliminate private health insurance, Medicaid, and other coverage—including, ironically, Medicare. Americans would be required to enroll in a government plan with far broader benefits than any insurance available today with no premiums or cost-sharing. [6] Despite the $32 trillion 10-year price tag and no clear plan on raising the money to implement M4A, the bill was cosponsored by other contenders for the nomination, including Senators Elizabeth Warren, Kamala Harris, and Cory Booker. [7]

M4A is a thinly disguised government price-setting scheme. Supporters correctly point out that U.S. prices for health services are far higher than in other developed countries. [8] They hope that full government price controls would lower the cost of healthcare without reducing access to care or medical innovation.

That overlooks the dominance of politics over pricing formulas. Medicare’s Sustainable Growth Rate (SGR) is a case in point. Under the SGR, excessive growth in Medicare physician payments was supposed to trigger across-the-board reductions. [9] That occurred once, in 2002—the first year that the SGR was to take effect—with a reduction of 4.8 percent. After that, Congress overrode the SGR formula until 2015 when, in the face of a 21.2 percent payment reduction, the SGR was repealed. One could expect a similar pattern with M4A: initial price restraint, followed by legislated increases in response to industry and patient complaints.

That leaves M4A with two unpalatable outcomes. Either price controls work, which threatens to disrupt access to care, or they do not work, which means that health spending continues to rise at economically unsustainable rates. In either case, hundreds of millions of Americans would be forced to give up coverage they know for promises that might not be kept.

Public option?

A seemingly more moderate alternative to M4A is a public option available as an alternative to private insurance. Opinion polls strongly indicate that Americans like the idea of having access to a federal plan without being forced to drop their current coverage. [10] But a public option cannot succeed without adopting policies that reduce cost to consumers while maintaining a broad provider network. Such policies eventually would put private insurers out of business.

The Medicare Exchange Health Plan (or Medicare-X) proposed by Senator Michael Bennet has the key features of a public option plan that could gain political traction during an election year. [11,12] Federally approved Medicare-X plans would be offered as an additional insurance option alongside private insurers through Affordable Care Act (ACA) exchanges.

To keep costs down, Medicare-X would pay providers at Medicare rates, which are 30 to 60 percent lower than commercial rates paid by private insurers on the exchanges. [13] To ensure a broad network, the government would require all healthcare providers who have either Medicare or Medicaid patients to accept Medicare-X enrollees, with the penalty being loss of their entire Medicare and Medicaid business.

Consequently, Medicare-X plans would be able to offer lower premiums and broader provider networks than their private competitors—but only because the government put its thumb on the scales. Private insurers could try to match the public option’s premiums by lowering their payment rates, but hospitals and doctors could reject those terms. Private insurers who cut payments too low would be left with provider networks inadequate to meet the needs of patients.

Medicare-X would quickly drive private plans out of the exchanges. Once established, advocates would open the program to more consumers. Employer coverage would be vulnerable too. In time, the public option would crowd out the space available for private insurance and make hospitals and doctors dependent on payments controlled by the federal government. Tight eligibility limits on the public option would delay this breakdown, but only if policymakers resist the temptation to expand the program.

M4A or a public option would achieve universal or near-universal coverage. But that would not guarantee access to necessary services or one’s provider of choice. Sharply lower payments would drive some providers out of medicine and discourage others from making the investment necessary to become a physician or build a medical facility. Cost growth would slow, but access, quality, and innovation would suffer.

Bipartisan Strategy: Building on What Works

A bipartisan strategy to slow health spending growth, increase insurance coverage, and promote value over volume in healthcare builds on our existing healthcare system with its mix of private and public financing, markets, and regulation. Rather than one grand plan, this calls for a series of policies aimed at correcting specific problems in the way healthcare is financed and delivered. Real reform is an ongoing process, and it is more likely to be successful if solutions are developed in local markets rather than dictated from Washington.

Such a strategy would rely on four main tools. [14]

  1. Information: Greatly improving information about prices and outcomes to spur cost-reducing pressure from patients and help consumers, providers, and insurers make more cost-effective choices.
  2. Bundled payments: Shifting away from fee-for-service payment where possible, holding organized provider groups responsible for the cost and quality of the treatment provided to patients.
  3. Competition: Removing barriers to competition among insurers and healthcare providers, using the power of competitive markets to drive toward cost-effective healthcare delivery.
  4. Targeted regulation: Appropriate regulation and direct intervention where markets are demonstrably not workable.

Within that framework, what problem could Republicans and Democrats agree to address through federal legislation? Surprise billing, state proposals to tie Medicaid expansion to work requirements, price transparency, and other issues that have received attention from legislators on both sides of the aisle are the most likely possibilities.

Example: Revising Medicare Part D

As a relevant example, we focus on a long-needed reform of Medicare Part D prescription drug benefit that would have a major impact on what seniors pay for their prescriptions. [15] Moreover, correcting a major defect in this government program would reduce price distortions that affect all purchasers in the private market.

Part D operates through competing private plans. In principle, the plans have strong incentives to negotiate low prices for the drugs on their formularies. However, flaws in Part D’s design blunt that incentive, increase program spending, and expose beneficiaries to the risk of high out-of-pocket costs.

Under the 2019 standard benefit structure, Part D enrollees are responsible for a $415 deductible, 25 percent co-insurance for covered drug expenses up to $3,820, and 5 percent of costs above a $5,100 catastrophic limit. [16] Medicare provides a per-enrollee direct subsidy to Part D plans based on the national average of plan bids. This is a prospective subsidy—similar to a capitation payment—putting the plans at risk for managing costs below the catastrophic threshold.

The program also subsidizes 80 percent of covered drug spending above the catastrophic threshold through individual reinsurance, with Part D plans paying 15 percent and enrollees paying the remaining five percent with no cap on their out-of-pocket costs. This approach was adopted to avoid having Part D plans design their formularies and benefits to avoid enrolling individuals with exceptionally high expense, but it reduces the incentive for plans to manage costs above the threshold since much of their potential liability is shifted to the taxpayer.

It has also led to a dramatic shift in the way prescription drugs are priced. Instead of negotiating for a low up-front price, plans have an incentive to negotiate higher list prices and receive rebates from manufacturers. With higher list prices, more beneficiaries are exceeding the catastrophic spending level and federal payments for reinsurance have ballooned. Between 2007 and 2016, reinsurance payments increase from $8 billion to $35 billion while the direct subsidy dropped slightly from $18 billion to $16 billion. [17]

This shift to higher list prices and larger rebates has had an impact on the entire pharmaceutical market. Since insurers typically base the amount enrollees pay in co-insurance on list prices, consumers outside the Medicare program are also seeing their out-of-pocket payments increase sharply.

Congress has advanced several proposals to lower prescription drug costs, including proposals to redesign the Part D benefit. [18] They have several features in common, including placing a true catastrophic cap on the maximum out-of-pocket costs that a senior could pay and a shift in costs above that cap from Medicare to drug manufacturers and Part D plans.

While there is wide agreement about the general problem, more time is needed to settle on the details of a reform that can be tolerated by the major actors, including the pharmaceutical industry. Such a deal can be struck, but not in the heat of a presidential election.


References

[1] Jost T. The tax bill and the individual mandate: What happened, and what does it mean? Health Affairs 2017 December 20. https://www.healthaffairs.org/do/10.1377/hblog20171220.323429/full/.

[2] Congressional Budget Office. H.R. 1628, American Health Care Act of 2017, Cost Estimate. 2017 May 21. https://www.cbo.gov/publication/52752; Congressional Budget Office. H.R. 1628, Better Care Reconciliation Act of 2017, Cost Estimate 2017 June 26. https://www.cbo.gov/publication/52849.

[3] Zhou L. The latest legal challenge to the Affordable Care Act, explained. 2019 July 10. https://www.vox.com/policy-and-politics/2019/7/9/20686224/affordable-care-act-constitutional-lawsuit-fifth-circuit-court-texas-district-court.

[4] Kaiser Family Foundation. Potential impact of Texas v. U.S. decision on key provisions of the Affordable Care Act. 2019 March 26. https://www.kff.org/health-reform/fact-sheet/potential-impact-of-texas-v-u-s-decision-on-key-provisions-of-the-affordable-care-act/.

[5] Kirzinger A, Wu B, Muñana C, Brodie M. Kaiser health tracking poll—late summer 2018: The election, pre-existing conditions, and surprises on medical bills. 2018 September 5. https://www.kff.org/health-costs/poll-finding/kaiser-health-tracking-poll-late-summer-2018-the-election-pre-existing-conditions-and-surprises-on-medical-bills/.

[6] U.S. Congress. S.1129—Medicare for All Act of 2019. 2019 April 10. https://www.congress.gov/bill/116th-congress/senate-bill/1129.

[7] Blahous C. The costs of a national single-payer healthcare system. Mercatus Center 2018 July 30. https://www.mercatus.org/publications/government-spending/costs-national-single-payer-healthcare-system; Congress.gov. S.1129—Medicare for All Act of 2019. 2019 April 10. https://www.congress.gov/bill/116th-congress/senate-bill/1129.

[8] Anderson GF, Reinhardt UE, Hussey PS, Petrosyan V. “It’s the prices, stupid: why the United States is so different from other countries. Health Affairs 2003 May/June. https://www.healthaffairs.org/doi/full/10.1377/hlthaff.22.3.89.

[9] Fontenot K, Brandt C, McClellan MB. A primer on Medicare physician payment reform and the SGR. Brookings Institution 2015 February 2. https://www.brookings.edu/blog/usc-brookings-schaeffer-on-health-policy/2015/02/02/a-primer-on-medicare-physician-payment-reform-and-the-sgr/.

[10] Kaiser Family Foundation. Public opinion on single-payer, national health plans, and expanding access to Medicare coverage. 2019 September 12. https://www.kff.org/slideshow/public-opinion-on-single-payer-national-health-plans-and-expanding-access-to-medicare-coverage/.

[11] Hellmann J. Democratic senators unveil ‘Medicare X’ bill to expand coverage. The Hill 2019 April 2. https://thehill.com/policy/healthcare/436936-bennet-kaine-unveil-bill-to-expand-medicare.

[12] Antos J, Capretta JC. The heavy hand of the public option. RealClear Policy 2019. https://www.realclearpolicy.com/articles/2019/06/18/the_heavy_hand_of_the_public_option_111222.html.

[13] Shatto JD, Clemens, MK. Projected Medicare expenditures under an illustrative scenario with alternative payment updates to Medicare providers. Centers for Medicare and Medicaid Services 2019 April 22. https://www.cms.gov/Research-Statistics-Data-and-Systems/Statistics-Trends-and-Reports/ReportsTrustFunds/Downloads/2019TRAlternativeScenario.pdf.

[14] Antos J, Rivlin A. A new vision for health reform. AEI and Brookings Institution 2019 September. https://www.aei.org/research-products/report/a-new-vision-for-health-reform/.

[15] Antos J. The cost of rising prescription drug prices. Statement before the House Committee on Ways and Means 2019 February 12. https://www.aei.org/research-products/testimony/testimony-the-cost-of-rising-prescription-drug-prices/.

[16] Medicare Payment Advisory Commission. Part D payment system. 2019 October. http://www.medpac.gov/docs/default-source/payment-basics/medpac_payment_basics_19_partd_final_sec.pdf .

[17] Medicare Payment Advisory Commission. March 2018 report to the Congress: Medicare payment policy. 2018 March 15. http://medpac.gov/docs/default-source/reports/mar18_medpac_ch14_sec.pdf.

[18] O’Neill Hayes T. Competing proposals to reform Medicare Part D. American Action Forum. 2019 September 23. https://www.americanactionforum.org/insight/competing-proposals-to-reform-medicare-part-d/.


Word from the Editors

This issue of HMPI draws insights about health challenges and opportunities from multiple countries. George Stalk and Joe Manget describe healthcare disruptions that can improve access, quality, and efficiency, using examples from Canada. Elizabeth Ndichu and Kevin Schulman use evidence from Nigeria to highlight the need for cross-national regulatory initiatives. Andrea Prado, Priscilla Rodriguez, and Alvaro Salas describe the transformation of Costa Rican health care into a high-performing system. Will Mitchell highlights the role of generic and biosimilar drugs in providing pricing discipline in Europe, North America, and elsewhere. Indira Laothamatas and David Nash describe initiatives to improve leadership training of physicians in multiple countries. Together, the articles offer insightful pathways to seizing robust opportunities for building stronger healthcare systems.

A thread that links these arguments is the need for organizational innovations that break down national and international silos in health and healthcare. This is a challenging task, but one fully within the competence of existing healthcare and life sciences policy and commerce. Our highlighted case in this issue, “Apple Health Records”, offers one step toward feasible integration, based on commercial innovation in electronic data systems.

As always, the solutions to our health care challenges will stem more from organizational gains than simply from technological improvements. The opportunities for these organizational solutions lie very much within the reach of leaders in the health policy and commercial life sciences sectors. HMPI seeks to provide insights that will help leaders act strongly and effectively.

As a teaser for the next issue of HMPI, please stay tuned for our special issue on bipartisan solutions to health care reform in the U.S. We are excited about the strong set of perspectives and suggestions that are in the line-up.

Will Mitchell
Professor of Strategic Management
Anthony S. Fell Chair in New Technologies and Commercialization
Rotman School of Management, University of Toronto

Regi’s ‘Innovating in Health Care’ Case Corner

This issue of the Case Corner focuses on a case co-written by Kevin Schulman, Stanford University, and Magda Rosenmöller, IESE Business School

Case: Apple Health Records

Authors: Kevin Schulman, Stanford University, and Magda Rosenmöller, IESE Business School

Background: Apple has developed a novel feature for its iPhone, Health Records, a personal health record platform. Apple has used a standards-based approach to the development of this technology, and has established linkages to hospitals to transfer records to the platform. For Apple, this platform could represent a major effort to create a novel health care services business model using high-quality data available in Health Records.

Based on data through calendar year 2018, the case details the importance of a data architecture built around patients to achieve connectivity in an individual’s health records, and the economic benefits of such an architecture.  However, there are competitors among the other technology giants also interested in entering the health care space, each with their own strategy and capabilities.

Abstract

The case focused on three questions:

  • How should Apple view its investments in this health care platform?
  • Can coopetition help accelerate the growth of this market?
  • In the end, can Apple built a successful business in this market?

IESE case number: IESE P-1777

Ordering information: https://www.iesepublishing.com

The Anatomy of a Disruptor

George Stalk, Jr., Senior Advisor and Fellow, The Boston Consulting Group; Joe Manget, Chair and CEO, Edgewood Health Network, Canada

Contact: George Stalk, Jr. stalk.george@advisor.bcg.com

Abstract

What is the message?

There is much talk these days about disruption and disruptors. However, almost nothing is offered to executives on how to respond to a disruptor or even how to be a disruptor. In this article, the authors explain the science and methods of disruptors and, through a case study, EHN Canada, provide an example of a disruptor in action.

What is the evidence?

The observations and conclusions are based on the strategy consulting experiences of George Stalk and Joe Manget at The Boston Consulting Group and the military theories of Col. John Boyd of the USAF and Gen. Heinz Guderian of the German High Command in WW II. Manget is the CEO of EHN Canada that is disrupting its corner of the healthcare industry.

Submitted: May 27, 2019; accepted after review: July 8, 2019.

Cite as: George Stalk, Joe Manget. 2019. The Anatomy of a Disruptor. Health Management Policy and Innovation, Volume 4, Issue 2.

Disruption: Getting from talk to action

When it comes to the risk of disruption, there is more talk than action in the corporate C-suite. Unfortunately, when legacy companies do not take action, disruption becomes a threat rather than an opportunity.

To thwart possible disruption, pundits give legacy companies such advice as “disrupt yourself before you get disrupted” or “put frontline employees in charge of strategy and execution.” This counsel is of little help.

In this case study, Canadian company, Edgewood Health Network (EHN Canada) is an example of a disruptor in action.

Case Study:  Edgewood Health Network (EHN)

We are in a healthcare crisis, and “more of the same” will not work.  For the first time in recent history, life expectancy in several western countries has flattened or even started to decline.  As a society, we have made huge strides in dealing with infectious diseases and, more recently, with chronic diseases, and our average life expectancy has increased each year.  However, that progress has stopped, primarily because of an increase in mental health issues leading to suicide, overdose, and other addiction-related issues.  Most western countries are now seeing a measurable decrease in life expectancy.

In addition, we have an aging population that is notably less healthy than previous generations, with the incidences of diabetes, Alzheimer’s, obesity, and dementia steadily increasing.

Our healthcare systems are failing to keep up with these increases in demand.  Our governments simply to not have enough resources to continue spending the way they have spent on healthcare.  Despite all of the hype about digital healthcare and value-based healthcare, healthcare costs per capita are not declining.  “More of the same” clearly is not working.

A disruptive model:  Applying operations principles to improve cost, quality and time in healthcare

Imagine if in any industry a provider came up with a customer solution that was one-third the cost, with three times better quality, and only took one-sixth the time of the “status quo” competitive offering.  If this could be scaled, it could completely disrupt the industry.

Well, this potential to disrupt today’s healthcare system is real.  A Canadian company, Edgewood Health Network (EHN Canada), has incorporated leading-edge business and operations practices that dramatically reduce cost, increase positive patient outcomes, and deliver a better patient experience in far less time than the status quo, which in Canada is the public system.

In a previous life, the current CEO of EHN Canada ran the global Operations Practice at The Boston Consulting Group.  He has seen business model innovation cross the boundaries of many industries, and was excited to be able to apply these principles to healthcare.  EHN Canada operates inpatient, outpatient, and digital mental health and addiction services across the country, but with a next-generation business model.  This new model starts with a singular focus on patient outcomes.  Any part of the business that does not impact patient outcomes is minimized or eliminated.  All resources are directed towards front-line staff and clinical programming.  As a result, EHN Canada operates with 95% fewer administrative resources than its public “competitors”, or about one third the operating cost per bed per day.  It does this while providing an average of seven hours per day of patient programs, whereas the public system typically provides only one or two hours.  The result is that patient outcomes are significantly better than in the public system, and patient satisfaction is close to 100 percent.

EHN Canada also did extensive research into post-treatment outcomes and saw to key drivers of superior outcomes:  attending some sort of aftercare for at least one year, and a family/home situation that is supportive of the individual’s recovery.  Given the importance of these two factors, EHN Canada decided to bundle them into patient care – one full year of aftercare, in-person or digital, plus a several-day family program where family members come into the facilities to learn more about treatment and recovery and how they can help that process.  EHN Canada’s costs are still one third the cost of the public system, which does neither of these.

The other major difference between the new model and the status quo is time. A patient going through the public system for mental health and addiction typically has to wait up to a year for treatment that is higher cost with lower quality outcomes.  EHN Canada can treat the same patient in one-sixth of the time of its legacy competitors and gets them back to a productive life faster.  Increasingly, some employers are seeing the value of getting an employee suffering from mental health and addiction back to work faster, and are bypassing the public system and seeing real improvements in cost, quality, and timeliness of treatment.

EHN disruption business model: Four key levers  

Patient outcomes: The first is the singular focus on patient outcomes.  That drives results and gives the company a clear purpose.  It also simplifies decision-making and focuses all resources on patient care.

Operational efficiency: The second is a relentless focus on operational efficiency, which requires real-time data and analytics on how each part of the business is operating, whether measuring web traffic or employee morale.  Decisions are made quickly based on real-time data, as patient outcomes are improved and non-essential tasks are automated and/or eliminated.

Rapid innovation: The third is rapid innovation.  EHN Canada is able to bring new programs and services to market in weeks and months versus years for the public system.  For example, a new program to help mothers with children who may not go to addiction treatment because of childcare issues, is being launched this fall.  It was a six-month process (it could have been done in three months, but government-issued building permits slowed things down) and will commence operating in January of 2020.  This is well within one planning cycle of a typical public healthcare competitor in Ontario, who would very likely take several years, if ever, to bring a new service like this to market.

People: The fourth and by far the most important lever is people.  Attracting and retaining talent that is motivated and passionate about positive patient outcomes is critical to EHN Canada.  EHN Canada invests heavily in continuous training on the latest clinical techniques to ensure that staff is delivering the highest possible level of care to patients.

This is a bold, new model for healthcare that works.  EHN Canada’s longer-term goal is to “bend the cost curve” in healthcare across the country as more “payers” demand improvements and accountability from their “providers” in cost, quality, and timeliness of services.  Increasingly, many  employers are seeing the value of getting an employee suffering from mental health and addiction back to work faster, and are bypassing the public system and seeing real improvements in cost, quality, and timeliness of treatment.

Adding to the competitive advantage of EHN’s business model are the inabilities of the current public healthcare providers in Ontario from responding due to:

  • Lack of awareness from being too inwardly focused
  • “Silo-ed” unit management
  • The veto power of entrenched bureaucracies
  • Denial by top management
  • Lack of courage at the top

But even the disruptor can get disrupted

EHN Canada cannot stand still.  Many new types of competitors (such as 100 percent digital solutions or extremely low- cost/ very limited service providers) intend to disrupt the market.  EHN Canada is constantly looking at these potential disruptors and finding ways to accelerate its own innovation process to develop even better solutions.  For example, EHN Canada developed their own digital platform to complement in-person care that dramatically lowers the cost of services while maintaining or improving patient outcomes.

This alone will not be enough.  EHN Canada needs to continue to innovate as the next new disruption is around the corner.

Learning to Be a Disruptor: Lessons From Military History

Disruptors like EHN have a pattern to their behavior:

  • They do strategy fast
  • They make decisions fast
  • They execute their decisions quickly, and
  • They repeat this cycle again and again at a fast tempo

We believe there is a better way to respond to disruptors than that offered by the pundits. Military history provides needed insight. In 1976, Col. John Boyd (USAF retired, now deceased) explained why U.S. fighter pilots had a far higher “kill ratio” (10:1) than Communist pilots in the Korean War. At the time, the commonly offered explanation was that U.S. pilots were much better trained. If this was true, then dogfight victories should have been evenly distributed among all U.S. pilots. They were not. A few pilots achieved most of the kills and the others very few or none.

Pilot training and the innate ability of each pilot were key factors, but so were the jets themselves. The F-86 that the U.S. pilots flew had vastly superior visibility from the cockpit than the enemy’s MIG 15—and was easier to maneuver at higher speeds.  Because of these factors, Boyd postulated that U.S. pilots operated at a much faster tempo than their opponents did:

“…the ability to transition quickly from one maneuver to another was a crucial factor in the victory.  Thinking about operating at a quicker tempo – not just moving faster – than the adversary was a new concept in waging war.

“Generating a rapidly changing environment – that is engaging in activity that is so quick it is disorienting and appears uncertain or ambiguous to the enemy – inhibits the adversary’s ability to adapt and causes confusion and disorder that, in turn, causes an adversary to overreact or underreact [Authors’ note: Read “Disruption”.]”(1)

Observe-Orient-Decide-Act: The OODA Loop

Boyd pronounced, “He who  can handle the quickest rate of change is the one who survives.”(2) Only a small number of all the U.S. pilots had the ability to drive the tempo of combat until the enemy failed and the U.S. pilot was victorious.  This ability was what differentiated the performance of the high scorers from the rest.  Boyd labeled this the Observe-Orient-Decide-Act loop, or the OODA loop, shown below:

He later revised the loop to show how to set the tempo of competition:

When explaining the second generation OODA loop Boyd emphasized:

 “Note how orientation shapes observation, shapes decision, shapes action, and in turn is shaped by the feedback and other phenomena coming into our sensing or observing window.

“Also note how the entire ‘loop’ (not just Orientation) is an ongoing many-sided implicit cross referencing process of projection, empathy, correlation, and rejection.” (3)

In other words, an aggressor whose OODA loop has a faster tempo than his competitor can get “inside” his competitor’s OODA loop. By the time the competitor reacts, it is too late: the aggressor may be executing his 2nd or 3rd OODA loop while the competitor is still reacting to the 1st loop. The competitor becomes confused, under- or over-reacts, and eventually loses the ability to command and control his situation.  In short, the competitor is disrupted!

Adapting the OODA Loop for Uncertain Healthcare Environments: Scan, Orient, Decide, and Act (SODA)

Disruptors—the most agile, responsive, and aggressive companies—put the squeeze on competitors with a similar, dynamic loop. However, since the reaction time of a solo pilot is unique to the circumstances and is far faster than that of an organization, we have adjusted the loop to better reflect that reality of business. Our business version has four repeating aspects: Scan, Orient, Decide, and Act (SODA). Disruptors continually scan the landscape, orient themselves to new circumstances, decide how to respond, and act quickly. Then they regroup and repeat the process. With experience and expertise, their SODA loop tightens and tempo accelerates.

Extract from EHN Canada Case Study: The SODA loop in practice

Imagine if in any industry a provider came up with a customer solution that was one-third the cost, with three times better quality, and only took one-sixth the time of the “status quo” competitive offering.  If this could be scaled it could completely disrupt the industry.

As a result, EHN Canada operates with 95 percent fewer administrative resources than its public “competitors”, or about one-third the operating cost per bed per day.

EHN Canada can treat the same patient in one-sixth of the time of its legacy competitors and get them back to a productive life faster.

EHN Canada is able to bring new programs and services to market in weeks and months, versus years for the public system.

A tempo advantage relative to the competition is the best long-term insurance against disruption. In any sector, the company that is able to sustain the fastest cycle-time wins. We call this rapid, continuous cycle tempo-based competition.

Disaggregating the SODA loop

To illustrate how the SODA loop works, let’s look at each aspect more closely:

Scan. Since competitors, technologies, and markets can change quickly, companies must systematically scan the horizon both for new opportunities and potential disruptions. Look for trend lines, new customer behaviors, anomalies, unexpected competitors, and changing demand patterns. China’s Alibaba, the massive online marketplace, continually scans its customers’ behaviors by capturing and analyzing more than a petabyte of customer data every day. The insights drive a powerful innovation engine that delivers a continuous stream of new products and platforms. Similarly, Amazon looks for retail categories that are ripe for disruption. It brings these underperforming categories online, cuts costs, makes them more efficient, and improves service. Look for “tipping points” that signify that a new trend or technology is gaining traction. For instance, the explosion in global demand for robotics was preceded by new price, performance, and adoption thresholds of component technologies that signified a tipping point was near. By continuously scanning the landscape, companies maintain an external focus—and avoid becoming complacent or surprised.

Orient. After identifying potential sources of opportunity or disruption, companies must assess where they have gained—or lost—a competitive advantage, and adjust their strategy accordingly. Doing this well requires a diverse leadership team that can analyze different scenarios, discuss and realistically evaluate the choices available, and look beyond the obvious. Depending on the circumstances, options may include the need for a new product to be developed and tested, an offensive move to counter a perceived threat on the horizon, a new set of skills or capabilities, or an acquisition to quickly enter a promising new market. Evaluating the available options and how they affect the current strategy requires time, discipline and a common understanding of the situation throughout the leadership structure.  This is a continuous process – it is “always on”.

Decide. Winning over the long term—and avoiding disruption—requires clarity on the key factors that determine competitive advantage. A powerful (and continuous) exercise is for the executive team to identify a short list of critical questions about the business, the answers to which shape the company’s strategy. Potential questions include: Who are our target customers—and how are their needs changing? Will other customer segments become more attractive over time? If so, what would we need to do to win them profitably? Do we have the talent and capabilities we need? Where are we most vulnerable and why? The process of answering these questions typically yields clear strategic decisions and priorities.

Act. Maintaining a rapid tempo requires the fast execution of strategy. Here, larger companies are often at a disadvantage relative to smaller, more nimble ones. To overcome this drawback, the leadership team must distill and clearly articulate the company’s strategic intent and context in the simplest language possible, so that people at all levels of the organization are aligned and can make better decisions more quickly. For instance, Zappos has one overriding mission: to make its customers happy. The company’s service reps know they can do whatever it takes to meet that goal—without having to get approval from their superiors. So they’ll refund defective products and replace them for free, send flowers to a customer’s sick mother, and spend as many hours on the phone as necessary to resolve a problem. To ensure alignment and fast action, individual and team missions must be explicitly linked to the company’s overall mission and strategy. Any incongruities among goals, resources, and constraints must be identified and flushed out early, so that time and effort are not wasted.

A hallmark of tempo-based competition based on the SODA loop is the ability to move more and more quickly through the four steps of the SODA loop as learning and experience accrue. In a larger sense, the SODA loop is a description of scaled learning on a company-wide level.

Challenges to Getting it Right

Simplicity and clarity are not easy to get right. Dr. Gary Klein, an expert on decision making, determined that only 40% of US Marines understood their leaders’ intent—even though the Marines are noted for fast execution.

A particularly well-done piece describing the static aspect of the above is, “Can You Say What Your Strategy Is?” by David J. Collis and Michael G. Rukstad  (HBR April 2008)

Market leaders stay ahead—and keep the competition guessing—by changing and improving key aspects of their value proposition and operating model on an ongoing basis. Ralph Hamers, the CEO of ING, put it this way:  “Don’t wait for new players or incumbents to compete with you, disrupt you, or disrupt your model. You take the lead. If you feel there’s an opportunity to disrupt and change your business model, do so. It’s very hard to make this decision as a manager or a leader because, basically, you’re cannibalizing your own business.”(4) Quicken is a perfect example of this aggressive strategy in action. Once a traditional mortgage provider, the company shifted to an online focus in the late 1990s. With its online arm, Rocket Mortgage, Quicken Loans makes the mortgage process easy for the average consumer to understand. Today, Quicken Loans is the largest home lender in the U.S.

Taking Advantage of the Opportunity for Tempo-Based Competition

Extract from the EHN Canada Case Study

In the EHN Canada case study above, we noted that EHN gains competitive advantages because current public healthcare providers in Ontario are inwardly focused, operate in silos, face vetoes from entrenched bureaucracies, encounter denial by top management, and often do not have sufficient courage at the top. As a result, faced with these limits in the public sector, some employers are seeing the value of getting an employee suffering from mental health and addiction back to work faster, and are bypassing the public system and seeing real improvements in cost, quality, and timeliness of treatment.

The legacy public health care system of Ontario has much to learn from EHN Canada, a healthcare disruptor. As with most disruptive new models, initially only a few customers switch from the legacy supplier to the disruptor. When the disruptor’s share of what had been the business of the legacy supplier reaches 5-10 percent the disruptor usually cannot be stopped. When the disruptor’s share reaches 15 percent or more the disruptor starts to drive the market.

In the EHN Canada example, many of the most attractive customers – those companies who need their employees with problems to quickly and successfully overcome them and are willing to pay – are now core customers of EHN, arguably leaving less attractive, higher cost to serve patients to the public health care system. But EHN works with several governments across the country to also take these complex patients (such as those suffering from OCD or severe trauma) and has successfully applied its operating model to these patient groups  and with outstanding results. The public healthcare system cannot continue to do “more of the same” and must continue to partner with companies such as EHN Canada to be able to provide affordable, high quality healthcare.

*****

We know of no companies whose executives say they are satisfied with the speed and effectiveness of their corporate decision-making and execution processes.  They are right to be concerned, because a whole generation of new competitors is arising across almost all sectors of business for whom rapid decision-making and execution is second nature.

Most companies spend far too much time on things that slow people down, use up resources, and add little value. Tempo-based competitors like Quicken, Alibaba, Amazon, and Zappos understand that the best way to avoid disruption is to keep an unwavering focus on the factors that confer a competitive advantage—and to never stand still.  If you are standing still, you are a target.

Quotes and references

(1) Reference: Coran, R (15 April 2004) Boyd: The Fighter Pilot Who Changed the Art of war. Back Bay Books, Reprint edition, ISBN-13: 978-0316796880, Page 328

(2) Boyd, J. R. (1976) New Conception for Air-to-Air Combat (Boyd’s 1976 “Fast Transients” briefing), Page 24

(3) Reference: Coran, R (15 April 2004) Boyd: The Fighter Pilot Who Changed the Art of war. Back Bay Books, Reprint edition, ISBN-13: 978-0316796880, Page 344

(4) Reference: Hamers, Ralph – On Disrupting the Banking Industry. A Conversation with the CEO of ING (20 September 2016), Boston Consulting Group, No page # as is a web article https://www.bcg.com/en-ca/publications/2016/financial-institutions-people-organization-ralph-hamers-disrupting-banking-industry.aspx


The Current State of Physician Leadership Training

Indira Laothamatas, MD, and David B. Nash, MD, MBA, Founding Dean and Dr. Raymond C. and Doris N. Grandon Professor of Health Policy, Jefferson College of Population Health, Thomas Jefferson University

Contact: Indira Laothamatas ilaotham@gmail.com

Abstract

What is the message?

The US spends almost one-fifth of its GDP on healthcare yet lags behind other developed countries in many outcome measures. Physician leadership training can play a pivotal role in improving health outcomes in an increasingly complex and fragmented healthcare system. However, the training must go beyond the traditional approach of developing intellectual competencies to also focus on less tangible qualities such as character building and emotional intelligence. The studies also show that harnessing technologies such as a smartphone app in addition to proven teaching methods such as coaching can improve different aspects of learning outcomes. Additionally, employing a case-based longitudinal curriculum with a strong practical component can demystify leadership, allowing participants to practice the skills and competencies learned in the training. Physician leadership training, together with other timely interventions, may help bridge the discrepancy between healthcare spending and outcomes.

What is the evidence?

This article is an annotated bibliography of physician leadership training, including articles published in the last five years that describe either a study to better understand perceptions of leadership among physicians, or an intervention for which the primary purpose was to promote leadership competency in physicians.

Submitted: June 13, 2019; accepted after review: July 7, 2019.

Cite as: Indira Laothamatas, MD, and David B. Nash. 2019. The Current State of Physician Leadership Training. Health Management Policy and Innovation, Volume 4, Issue 1.

Introduction

There is a large discrepancy between healthcare spending and outcomes in the United States. In 2017, the US spent 17.2% of its GDP on healthcare, significantly more than any other developed country[1]. This figure is projected to grow to 19.4% by 2027[2]. Unfortunately, higher healthcare spending in the US does not necessarily translate to better health outcomes. In a study published in the Lancet last May, the US ranks 29th out of 195 countries on the Healthcare Access and Quality (HAQ) Index, which measures age- and risk-standardized mortality rates for 32 causes of death considered preventable by effective care[3].

Although the reasons for the discrepancy between healthcare spending and outcomes in the US are manifold, one would be hard-pressed to argue that the complexity and fragmentation of the US healthcare system does not play a role. The growth in medical knowledge and technology has naturally resulted in hyperspecialization. However, the unintended consequence is the fragmentation of care, wherein each specialist works in a silo and the primary care physician neither has enough time nor resources to properly coordinate care. Moreover, the US healthcare system has multiple stakeholders – providers, patients, insurance companies, and biomedical companies, to name a few – who often have conflicting interests.

Physician leadership training has been touted as a potential solution to some of the shortcomings of our healthcare system. Traditionally, medical education has concerned itself with the acquisition of medical knowledge and skills, and barely grazes the surface on important systemic issues such as population health, health policy, and health management. Physicians thus complete their training prepared to treat patients but not necessarily to lead or affect change on a larger scale. However, there has been an increasing consensus on the need to incorporate leadership training into medical education. One study of almost 1200 hospitals across seven countries found that hospitals with higher management-practice scores had better clinical outcomes and better financial performance[4]. This suggests that a greater emphasis on management practices, including physician leadership training, can contribute to improving both the quality and cost-efficiency of healthcare.

Methods

The goal of this study was to compile an annotated bibliography on physician leadership training. We included only articles published within the last five years in order to focus on recent findings. We used the keywords “physician leadership training” to run a search on PubMed and selected articles written in English and published from 2014 to May 2019 describing either a study to better understand perceptions of leadership among physicians, or an intervention for which the primary purpose was to promote leadership competency in physicians. We also found some articles in print using the same inclusion criteria.

Results

  1. Cerrone SA, Adelman P, Akbar S, Yacht AC, Fornari A. Using Objective Structured Teaching Encounters (OSTEs) to prepare chief residents to be emotionally intelligent leaders. Medical Education Online. 2017 May 2;22(1):1320186. doi:10.1080/10872981.2017.1320186.

This article describes a program designed to prepare incoming chief residents (CRs) at Northwell Health for their leadership role. In the first part, CRs completed an emotional intelligence (EI) inventory and received their results along with feedback on their strengths and weaknesses. The second and third parts took place over a day and consisted of interactive sessions on leadership, management, and feedback skills, followed by OSTEs simulating scenarios in which junior residents presented with difficult interpersonal and professionalism situations. Each CR completed two OSTEs and was evaluated by the actor, a peer observer, and the CR on the use of skills taught during the earlier interactive sessions. The program succeeded at three levels of Kirkpatrick’s evaluation model: CRs had a positive reaction, with 92% agreeing that their learning needs were met (Level 1). CRs also learned new knowledge and skills, as evident from the statistically significant increase in the average score between the first and second OSTEs (Level 2). Finally, the knowledge and skills learned will likely lead to improved work performance, with 76% agreeing that the course would help them become more effective at work (Level 3).

  1. Ginzburg SB, Deutsch S, Bellissimo J, Elkowitz DE, Stern JN, Lucito R. Integration of leadership training into a problem/case-based learning program for first- and second-year medical students. Advances in Medical Education and Practice. 2018 April 9;9:221-226. doi:10.2147/amep.s155731.

The authors describe the integration of a leadership training program called Patient-Centered Explorations in Active Reasoning, Learning and Synthesis (PEARLS) into the case-based learning curriculum for first- and second-year medical students at Zucker School of Medicine at Hofstra/Northwell. Students met in small groups three times per week. They focused on two cases per week, developing their own learning objectives and taking turns leading case-based discussions. Students received individual feedback and assessments at the middle and end of each course. Results from the assessment forms were used to evaluate the impact of PEARLS on students’ leadership skills. The skills that improved the most were related to process improvement and thinking outside the box. Notably, PEARLS allowed students to develop leadership skills without impairing USMLE Step 1 scores or adding more time to the curriculum.

  1. Green WM, Farquhar C, Mashalla Y. The Afya Bora Fellowship: An Innovative Program Focused on Creating an Interprofessional Network of Leaders in Global Health. Academic Medicine. 2017 Sep;92(9):1269-1273. doi:10.1097/acm.0000000000001856.

The Afya Bora Fellowship is a one-year fellowship designed to train doctors, nurses, and public health professionals to take on leadership roles in global health. It was founded in 2011 by the Afya Bora Consortium which originally consisted of eight universities in Botswana, Kenya, Tanzania, Uganda, and the US and has since expanded to include Cameroon. The program teaches leadership and management skills via 8 weeks of classroom-based learning, four distance learning modules, and two 4.5-month experiential apprenticeship opportunities. Modules are case-based and focused on leadership training, monitoring and evaluation, research processes, global health policy, implementation science, and HIV/AIDs as a global challenge. Meanwhile, apprenticeship opportunities are offered at local institutions in order to retain talent and build local capacity, or in the case of US fellows to provide a more nuanced understanding of global health issues. The fellowship also provides support to alumni via networking opportunities and financial awards. Most fellows have returned to their countries of origin and taken up leadership opportunities. In 2015-16, all mentors reported the fellows had a significant impact on their site and 61% of mentors reported seeing growth in leadership skills among fellows.

  1. Hartzell JD, Yu CE, Cohee BM, Nelson MR, Wilson RL. Moving Beyond Accidental Leadership: A Graduate Medical Education Leadership Curriculum Needs Assessment. Military Medicine. 2017 Jul 1;182(7):1815-1822. doi:10.7205/milmed-d-16-00365.

The investigators surveyed trainees and faculty members at Walter Reed on their perceived need for a leadership curriculum, the presence of a formal leadership curriculum in their department, and the content, format and timing that they would like to see in a leadership curriculum. Only 17% of participants reported the presence of a formal leadership curriculum in their department, even though the average participant rated their current leadership skills as only slightly better than moderately effective. The topics perceived to be the most important were conflict resolution, motivating a subordinate, and implementing change. Formats perceived to be the most effective were case studies and small group exercises, whereas reflective writing and online presentations were rated as the least effective. The results of this study could be used to guide the design and implementation of a formal leadership training curriculum for physicians.

  1. Helitzer DL, Newbill SL, Cardinali G, Morahan PS, Chang S, Magrane D. Narratives of Participants in National Career Development Programs for Women in Academic Medicine: Identifying the Opportunities for Strategic Investment. Journal of Women’s Health. 2016 Apr 13;25(4):360-370. doi:10.1089/jwh.2015.5354.

The authors conducted phone interviews of 45 women faculty who participated in at least one of three national career development programs (CDPs) for women from 1988 to 2010: Early-Career Women in Medicine (EWIM), Mid-Career Women in Medicine (MWIM), and Executive Leadership in Academic Medicine (ELAM). The most commonly cited reasons for enrolling in the CDPs were to reduce isolation, network with other women faculty, find women mentors, and to gain skills that would help advance their careers. Interviewees cited institutional support, including financial support and a culture of advocacy for women, as promoting their participation in the CDPs.  Additionally, interviewees reported several positive outcomes from the CDPs, including skill development, academic advancement, increased organizational visibility, and a broader perspective of the institutional culture. However, most interviewees agreed that after attending the CDP, the sponsoring institutions did little to seek out their newly acquired skills and insight in creating formal initiatives for women in academic medicine; instead, any such initiatives had resulted from the interviewees’ own efforts. The authors suggest that CDPs could make a bigger and more sustainable impact on achieving gender equity in academic medicine when combined with strategic, intentional support of the sponsoring institutions.

  1. Hopkins J, Fassiotto M, Ku MC, Mammo D, Valantine H. Designing A Physician Leadership Development Program Based on Effective Models of Physician Education. Health Care Management Review. 2018 Oct 1;43(4):293-302. doi:10.1097/hmr.0000000000000146.

This article describes the implementation and outcomes of the Stanford Leadership Development Program. The program uses a framework developed by education researcher M.D. Merrill which describes the “Activation-Demonstration-Application-Integration” sequence towards effectively learning a new knowledge or skill. Participants completed baseline assessments and received feedback on their strengths and weaknesses (Activation). Then, in six sessions spread out over nine months, participants learned principles of leadership and organizational management using proven educational methods such as case-based learning (Demonstration). Participants then completed leadership projects tailored to their own roles (Application).  Finally, participants presented the outcomes of their projects (Integration). The program succeeded on all levels of the Kirkpatrick evaluation model. The program was given an average rating of 4.5 out of 5 (Level 1: Reaction). In addition, pre- and post-survey results showed significant improvements in self-assessed leadership knowledge, skills, and attitudes (Level 2: Learning). More than 80% of participants reported plans to use their new leadership knowledge and skills (Level 3: Behavior). Lastly, 100% of participants completed their experiential projects (Level 4: Results).

  1. Jha P, Quinn B, Durbin S, Bhandari S. Perceptions of Junior Faculty in General Internal Medicine Regarding Mentoring Medical Students and Residents in Scholarly Projects. Journal of General Internal Medicine. 2019 Mar 18. doi:10.1007/s11606-019-04937-4.

The goal of this study is to survey junior faculty members on their perceptions towards the benefits of mentoring, barriers to mentoring, and ways to overcome those barriers. A survey was sent out to all 50 assistant professors in General Internal Medicine at the Medical College of Wisconsin, with a response rate of 68%. Of those, only 38% reported mentoring resident and student projects in their first year as faculty, and only 50% were involved in mentoring after the first year. Involvement in mentoring did not increase with the number of years spent as faculty. The perceived benefits of mentoring include enhanced CV and publication, critical thinking, medical knowledge, leadership, networking and collaboration, and fulfilling teaching requirements. The perceived barriers were inadequacies in resources/training, time, institutional support, faculty development, and structured mentorship programs. The perceived solutions were, among others, protected time for mentorship, financial and non-financial incentives, institutional support, coordinating with experts, and structured peer mentorship programs.

  1. Könings KD, Berlo JV, Koopmans R, et al. Using a Smartphone App and Coaching Group Sessions to Promote Residents’ Reflection in the Workplace. Academic Medicine. 2016 Mar 1;91(3):365-370. doi:10.1097/acm.0000000000000989.

This study explores the impact of a smartphone app and coaching sessions on residents’ reflection in the workplace. 64 residents were randomly assigned into four groups: app-only, coaching-only, both, and neither. The app was designed to capture learning moments in real-time as text, pictures, audio, or video. The nonapp group was instructed to capture learning moments as they normally would, such as memorizing or writing them down. Coaching groups met every other week to discuss learning moments; participants were required to submit these moments before each session. In contrast, non-coaching groups were required to fill out and submit reflection forms at the same interval. All participants filled out pre- and post-test questionnaires regarding the amount learned, alertness to learning moments, and follow-up activities pursued.  The frequency of reflection was measured by the number of app entries, cases submitted before coaching sessions, or experiences included on the reflection form. App users reflected more often and reported greater learning progress than nonapp users. Participants that received coaching were more alert to learning moments and pursued more follow-up activities. Those who received both types of support had the highest alertness to learning moments.

  1. Lawson L, Lake D, Lazorick S, Reeder T, Garris J, Baxley EG. Developing Tomorrow’s Leaders: A Medical Student Distinction Track in Health System Transformation and Leadership. Academic Medicine. 2019 Mar;94(3):358-363.

This article describes a medical student distinction track in health system transformation and leadership called the Leaders in Innovative Care Scholars Program at East Carolina University, focusing on the program’s summer immersion experience. The eight-week summer session took place between the first two years of medical school, during which participants completed reading and writing assignments, discussions, presentations, skills sessions, experiential activities, and finally a clinical improvement project. The three evaluation tools included a pre- and post-program knowledge test, pre- and post-program self-assessment, and a program evaluation. 93% of participants rated the summer experience as valuable/highly valuable. After the summer program, participants’ knowledge score increased by an average of 17 points; in addition, their self-assessed skills and knowledge in patient safety, quality improvement, team-based care, population health, and leadership skills all showed significant improvements.

  1. Palamara K, Kauffman C, Chang Y, et al. Professional Development Coaching for Residents: Results of a 3-Year Positive Psychology Coaching Intervention. Journal of General Internal Medicine. 2018 Nov;33(11):1842-1844.

This article describes a professional development program for internal medicine residents at Massachusetts General Hospital. The program focuses on positive psychology principles. Residents are assigned a faculty coach outside of their specialty with whom they meet at least three times a year over the course of three years. Year 1 focuses on strengths exploration, building resilience, and finding meaning in work. Year 2 builds on the foundation from Year 1 with the addition of leadership skills and emotional intelligence. Year 3 builds on the previous two years with the addition of authentic leadership, finding a purpose, and cultivating life lessons. At the end of the program, participants were asked to evaluate the quality of communication with their coaches and opportunities for reflection, and to indicate if they believe the coaching program has improved their ability to cope with challenges. The results showed that participants who rated the quality of communication with their coaches as good/excellent reported higher coping skills and better work relationships. In contrast, residents who rated their opportunities for reflection as fair/poor were more likely to report higher emotional exhaustion.

  1. Rosenbaum L. Divided We Fall. New England Journal of Medicine. 2019 Feb 14;380(7):684-688.

This article is Part 1 in a three-part series on Teamwork. In this part, the author explores the barriers to collaboration in medicine. She starts off with the paradox that “though medicine can offer patients more than ever before, we rely on increasing numbers of people to do it” and suggests that the hyperspecialization of modern medicine is part of the reason for the fragmented care and breakdowns in communication. Another factor that contribute to communication errors include many doctors’ unwillingness to acknowledge uncertainty or ask questions. The author then introduces Crew Resource Management (CRM), a type of team training in aviation safety that focuses on building a culture of shared responsibility. It was developed based on findings from a NASA-sponsored teamwork simulation study and has been endorsed by the Institute of Medicine to reduce medical errors. The author concludes that this will not be an easy fix; instead, it would require both introspection and an empirical study of teamwork in medicine.

  1. Rosenbaum L. Cursed by Knowledge – Building a Culture of Psychological Safety. New England Journal of Medicine. 2019 Feb 21;380(8):786-790.

This article is Part 2 of a three-part series on Teamwork. The author introduces us to the importance of psychological safety, i.e. the willingness to take interpersonal risks such as admitting mistakes and asking questions, in promoting a collaborative work environment. There is an absence of psychological safety in medicine, which stems partly from the antagonism between physicians. A study found that nearly a third of physicians in the UK experienced “rude, dismissive, and aggressive” communication from other physicians multiple times per week and that 40% said it moderately or severely affected their workdays, with 7% saying that it led to errors. The author goes on to explore other factors that may contribute to the absence of psychological safety in medicine. For instance, with lives at stake, most physicians understandably feel the need to always appear smart and competent, and thus may not feel comfortable owning up to their mistakes or expressing uncertainty. Furthermore, the hyperspecialization of modern medicine leads to “the curse of knowledge” – that is, when we know something, it is difficult to recognize that someone else does not, thus posing another challenge to communication and collaboration.

  1. Rosenbaum L. The Not-My-Problem Problem. New England Journal of Medicine. 2019 Feb 28;380(9):881-885.

This article is Part 3 of a three-part series on Teamwork. The author discusses the fragmentation of patient care and a few features of our healthcare system that contribute to it, including hyperspecialization and shift work, and uses social psychology to try to explain it. She posits that the bystander effect, in which individuals are less willing to act in a crisis if others are present, can help us understand the difficulty in collaboration when it comes to patient care. Furthermore, the sheer number of healthcare professionals on a patient care team often leads to the diffusion of responsibility. Outside of true emergencies such as a code resuscitation, physicians often struggle to work together efficiently as a team. For instance, in caring for a complex patient, it might be easy to assume that others involved have already thoroughly considered the case, and therefore hesitate to speak up when something does not feel right. Research on the bystander effect suggests that context – such as situational cues – is more important than character or disposition in influencing helping behavior. The author suggests that there should be more research on how our social environments influence the quality of medical care that we deliver, including our ability to work together effectively. In other words, we should invest more in social sciences research in healthcare and use the research findings to shape our social environments in a way that optimizes the quality of care.

  1. Saravo B, Netzel J, Kiesewetter J. The need for strong clinical leaders – Transformational and transactional leadership as a framework for resident leadership training. Plos One. 2017 Aug 25;12(8). doi:10.1371/journal.pone.0183019.

In the IMPACT study, the investigators assess the effectiveness of a four-week program designed to teach residents across multiple specialties transactional and transformational leadership skills. Transactional leadership uses extrinsic rewards to motivate followers, whereas transformational leadership appeals to inspirational motivation or intrinsic rewards. The program spanned over four weeks, with 2.5-hour sessions per week and consisted of didactics, simulations, feedback sessions, and skills workshops. The leadership skills of each participant were scored before and after the program (1) by a blinded external evaluator using a performance scale and (2) by self-assessment using both a performance scale and a knowledge test. After the four-week program, the average score based on the external evaluator increased by 15% in transactional leadership performance and 14% in transformational leadership performance. Similarly, the average score based on self-assessment before and after the program saw increases of 4% and 6% in transactional and transformational leadership performance, respectively.

  1. Sultan N, Torti J, Haddara W, Inayat A, Inayat H, Lingard L. Leadership Development in Postgraduate Medical Education: A Systematic Review of the Literature. Academic Medicine. 2019 Mar;94(3):440-449.

This is a systematic literature review on leadership development interventions for residents. The inclusion criteria were peer-reviewed articles written in English and published between 1980 and May 2, 2017 describing interventions aimed at developing leadership competencies. The authors used Kirkpatrick effectiveness scores and Best Evidence in Medical Education (BEME) Quality of Evidence scores to assess the effectiveness of different interventions. From the 21 studies included, the most common setting was classroom and the most common instructor type was clinical faculty. Most studies used at least two pedagogical methods, most commonly small group learning, didactics, and independent learning. Most studies focused on competencies under the cognitive domain, i.e. related to intellectual competencies, instead of character or emotional intelligence. The average Kirkpatrick score was 1.0 (Reaction: Change in learner’s attitude). The average BEME score was 2 (Results ambiguous, but there appears to be a trend). In conclusion, the interventions appear to have poor outcomes. The authors suggest that future interventions should be grounded in evidence-based conceptual frameworks and include the development of skills and knowledge related to character building and emotional intelligence.

Conclusion

There is increasing recognition both in the US and other countries of the importance of physician leadership training. Numerous medical schools and hospitals have started incorporating formal leadership training programs into their curriculum. A review of the current literature has shown that many studies seem to have good outcomes, although admittedly the outcomes are subjective and difficult to measure. Future investigators might consider using a more standardized evaluation process. One evaluation model that has been validated and used in a few studies is Kirkpatrick’s Evaluation Model, which describes the four levels of evaluating any learning process: Reaction (i.e. how satisfied learners were with the process), Learning (i.e. the extent to which new knowledge and skills were acquired), Behavior (i.e. behavioral or performance-related changes resulting from the new knowledge and skills acquired), and Results (i.e. tangible results such as increased productivity).

Lessons from specific studies include the importance of not simply approaching leadership training as a list of competencies to master, but to also focus on less tangible qualities such as character building and emotional intelligence. Another lesson is the importance of a longitudinal curriculum with a strong practical component and an ongoing support network, as seen in the Afya Bora Fellowship. Part of the utility of the practical component lies in its ability to demystify leadership, allowing the participants to practice the skills and competencies learned in the classroom. Ongoing support is necessary to help trainees receive real-time feedback and advice.

Lastly, physician leadership training has the potential to have a far-reaching impact. Physician leaders can go on to train and mentor others, thus extending the benefits of leadership training beyond themselves. Furthermore, the knowledge and skills acquired are highly transferable, enabling physicians to lead and affect change on a larger scale than that afforded by the doctor-patient relationship alone. For instance, at the hospital level, physician leaders can adopt management practices that lead to more cost-effective and high-quality care, while at the policy level, they can advocate for changes that will increase coverage and affordability for their patients. Thus, together with other timely interventions, physician leadership training is an important step towards solving the fragmentation of our healthcare system and bridging the discrepancy between our healthcare spending and outcomes.

References

[1] Health Expenditure and Financing [Internet]. OECD. 2019 [cited 2019 Jun 6]. Available from: https://stats.oecd.org/index.aspx?DataSetCode=HEALTH_STAT#_ga=2.227777567.327788563.1559832150-536334733.1559832150

[2] NHE Fact Sheet [Internet]. CMS.gov Centers for Medicare & Medicaid Services. 2019 [cited 2019 Jun 6]. Available from: https://www.cms.gov/research-statistics-data-and-systems/statistics-trends-and-reports/nationalhealthexpenddata/nhe-fact-sheet.html

[3] Fullman N, Yearwood J, Abay SM, Abbafati C, Abd-Allah F, Abdela J, et al. Measuring performance on the Healthcare Access and Quality Index for 195 countries and territories and selected subnational locations: a systematic analysis from the Global Burden of Disease Study 2016. The Lancet. 2018;391(10136):2236–71.

[4] Dorgan S, Layton D, Bloom N, Homkes R, Sadun R, & Reenen, JV. Management in Healthcare: Why Good Practice Really Matters [Internet]. 2010 [cited 2019 Jun 6]. Available from: http://worldmanagementsurvey.org/wp-content/images/2010/10/Management_in_Healthcare_Report_2010.pdf